


 nueva página del texto (beta)
 Inglés (pdf)
 Artículo en XML
 Referencias del artículo
 Enviar artículo por email
 Citado por SciELO
  Similares en
SciELO
Similares en
SciELO 
 Permalink
1. Introduction
Surface baroclinic zones are the most important meteorological systems that modify the weather in the extratropical and subtropical latitudes of South America. Cold fronts occur throughout the year over the extratropical zones of the continent, being more frequent during the winter, when the polar air mass also reaches these latitudes.
The term front refers to the interface between air masses of different thermal characteristics near the surface (Bjerknes and Solberg, 1922; Taljaard, 1972). There are four kinds of fronts: cold, warm, occluded and stationary. Cold fronts are characterized by systems with a sharp wind shift and a narrow line of cumulonimbus convection at the surface front (Browning and Harrold, 1970; Hobbs et al., 1980). Moreover, the discontinuities in the air temperature are simultaneous with the wind shift and coincident with the pressure trough (Schultz, 2005). Browning and Monk (1982) also mention that the strong vertical motion at the surface front occurs in association with a broader region of upgliding warm moist air above a wedge of cold air behind the front. As polar cold fronts have all these features, they are frequently called classical cold fronts (Bjerknes, 1919).
Considering South America and, more specifically Brazil, classical cold fronts that reach this country lose their thermal contrast (weakening of the horizontal temperature gradient) as they move toward the southeast and northeast Brazilian regions in lower latitudes. Therefore, these fronts lose their characteristic of classical cold fronts. Kousky (1979) was the first researcher to call these fronts that weaken near the east coast of Brazil, subtropical fronts. After the pioneering study of Kousky, the theme subtropical fronts remained “asleep” in the literature.
Another surface baroclinic zone, which in general has a weak horizontal temperature gradient, but that can produce heavy rains along the east coast of the south and southeast regions of Brazil, is the baroclinic trough. The main difference of these systems regarding the classical cold fronts is that in the troughs the cloudiness and the area of precipitation is located ahead of the system (Sanders, 2005), while in classical cold fronts, the cloudiness and the precipitation occur on the colder side of the wind shift.
Sanders (2005) highlighted that in synoptic charts of operational meteorological centers, several atmospheric systems are erroneously identified. For example, classical cold fronts are drawn in regions without strong horizontal temperature gradients and, sometimes, there are extreme examples in which these systems are represented in regions with a nocturnal temperature rise. Many of the cold fronts drawn on surface synoptic charts of Brazil’s operational meteorological centers are also erroneously identified because they do not show a significant horizontal temperature gradient. In several cases, these systems should be identified as baroclinic troughs instead of cold fronts. Bjerknes (1919) understood that in the classical cold fronts, the wind shift must be accompanied by a significant horizontal temperature gradient. This means, for example, that without the significant horizontal temperature gradient the wind shift from the north to south quadrant in the Southern Hemisphere does not represent a classical cold front. The main problem of all weather forecasters around the world is to define what is a significant horizontal temperature gradient in surface maps, especially in Brazil, where approximately 70% of the country is located in subtropical and tropical regions. Sanders (2005) mentions that this definition is arbitrary.
There is nothing in the atmospheric science literature that treats the issue of the different surface baroclinic zones (classical cold fronts, subtropical fronts and baroclinic troughs) over Brazil. The studies of cold front climatology in South America do not distinguish these kinds of systems and include all of them in the same dataset to compute statistics (Andrade, 2005, 2017; Cavalcanti and Kousky, 2009; Silva et al., 2014; Foss et al., 2017). Therefore, a climatology of each kind of system would be very useful for Brazilian weather forecasters since it would indicate the seasonality and preferential regions of these baroclinic systems. In this context, the purpose of this study is to establish a climatology of the three types of surface baroclinic zones along the coast of Brazil. For this reason, we applied the criteria (described below) recently developed by the weather forecasters from the Brazilian Center for Weather Forecast and Climate Studies, National Institute for Space Research (CPTEC-INPE). Then we performed a new analysis of CPTEC-INPE synoptic charts (which are constructed with Global Forecast System [GFS] analysis since 2010) to properly classify the classical cold fronts, subtropical fronts and baroclinic troughs.
2. Data
Classical cold fronts, subtropical fronts and baroclinic troughs were identified in eight cities along the coast of Brazil: Porto Alegre (Rio Grande do Sul, RS), São Paulo (São Paulo, SP), Rio de Janeiro (Rio de Janeiro, RJ), Vitória (Espirito Santo, ES), Caravelas, Porto Seguro, Ilhéus, and Salvador (Bahia, BA). For this purpose, the surface and upper synoptic charts at 00:00 UTC, 06:00 UTC, 12:00 UTC and 18:00 UTC, between 2010 and 2016, from the CPTEC-INPE were used. Cloudiness associated with the three different kinds of systems was identified through the brightness temperature (K) from GOES (10, 12, and 13) geostationary satellites (data from the Satellite and Environmental System Division [CPTEC], INPE). Furthermore, daily precipitation data from São Paulo city (23.6º S, 46.6 ºW) provided by the National Meteorological Institute, Brazil (INMET) were used.
3. Methodology
The magnitude of the horizontal temperature gradients associated with baroclinic zones may vary by region, season and meteorological events. Therefore, this variable is not the only that should be analyzed for the identification of the different kinds of baroclinic zones. Weather forecasters must also analyze the horizontal pressure gradient, the direction and intensity of the wind, the air humidity, the presence of the polar jet and the cloud cover. Thus, the use of automated analyses is not adequate (given that they are very hard to implement computationally when there is great number of criteria) to distinguish the different types of baroclinic systems. In this way, we highlight the necessity of employing the knowledge and experience of the weather forecasters to identify the different baroclinic systems. Cold fronts are always associated with a more intense horizontal temperature gradient than subtropical ones and baroclinic troughs. According to the practical experience of the weather forecasters from the CPTEC-INPE, cold fronts have a horizontal temperature gradient defined as at least 3 ºC (100 km-1). Moderate or strong gradients are defined as at least 5 ºC (100 km-1). On the other hand, the subtropical fronts and the baroclinic troughs show weak horizontal temperature gradient, defined as at least 2 ºC (100 km-1). We highlight again that these values may vary according to the region of occurrence, season and baroclinic system.
In the present study, we used the criteria developed by the weather forecasters from CPTEC-INPE (presented in the next paragraphs) to identify classical cold fronts, subtropical fronts and baroclinic troughs. In the following section some synoptic charts are shown to illustrate the features of the three different systems. These charts are constructed with GFS analysis and surface data from synoptic weather stations. Moreover, the charts show the synoptic systems drawn by the meteorologists.
3.1 Classical cold fronts
A classical cold front is identified in the synoptic charts when there are:
A moderate or strong horizontal temperature gradient at surface, that in the analysis region can be considered greater than 3 ºC 100 km-1, or a significant horizontal 1000-500 hPa thickness gradient (Fig. 1a).
A moderate or strong horizontal dew point temperature gradient at surface.
A polar jet stream (250 hPa) associated with the surface cold front (sometimes the subtropical jet stream can appear coupled with the polar jet) (Fig. 1b).
An abrupt wind shift in the cyclonic sense (Fig. 1a).
Cloudiness and precipitation behind the cold front (Fig. 1c).
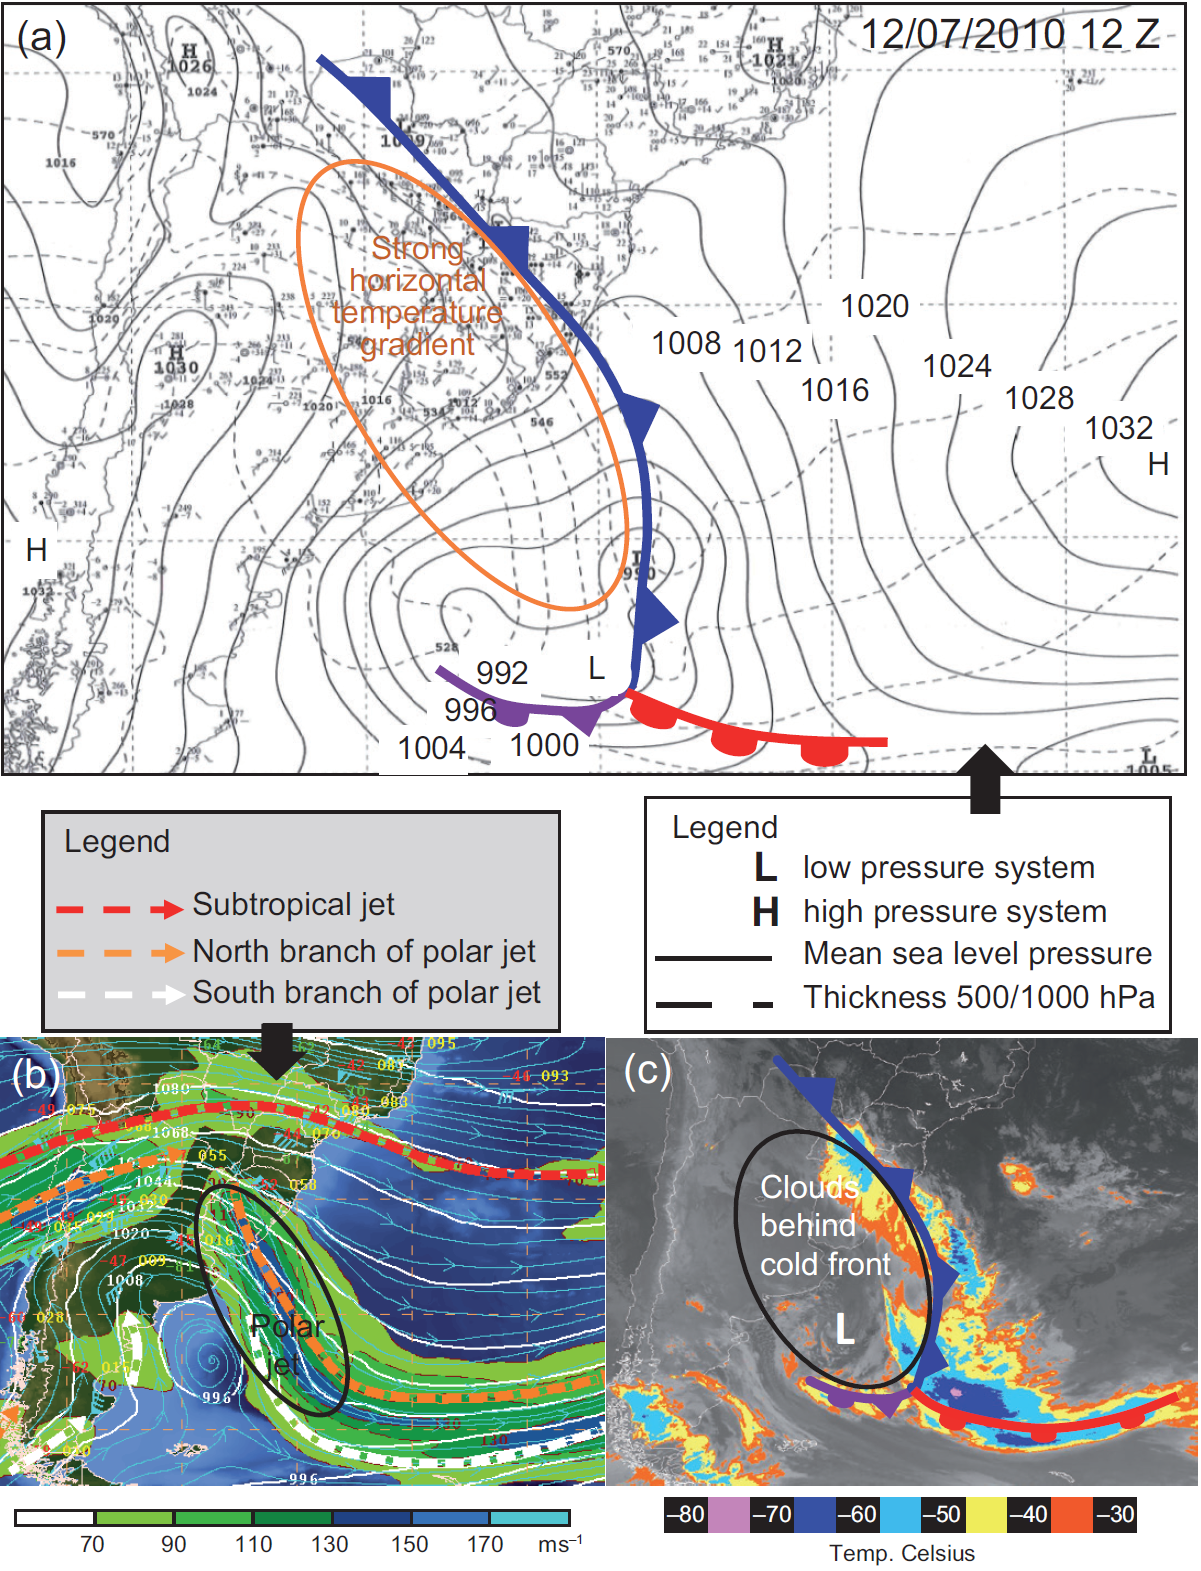
Fig. 1 Synoptic fields at 12:00 UTC on July 12, 2010 showing the features of a classical cold front. (a) Surface synoptic chart showing sea-level pressure (hPa, black line), thickness between 1000-500 hPa (dashed lines), the fronts position (cold front in blue, warm front in red and occluded front in purple) and surface data from synoptic weather stations plotted in conventional model. (b) Synoptic chart at 250 hPa showing geopotential height in tens of meters (white lines), streamlines (light blue lines), isotachs (kts, green shaded), upper level jets stream position and upper-data from synoptic weather stations plotted in conventional model. (c) Brightness temperature (ºC) from GOES-13 (data from the CPTEC, INPE).
3.2 Subtropical fronts
In synoptic charts, a subtropical front presents the following features:
A weak horizontal temperature gradient at surface or weak horizontal 1000-500 hPa thickness gradient (Fig. 2). In other words, the distance between the isolines is higher than that shown in Figure 1a.
Weak or nonexistent horizontal dew point temperature gradient at surface (Fig. 2).
Gradual wind shift in the cyclonic sense (Fig. 2).
Subtropical jet stream (250 hPa) or polar jet coupled with subtropical jet, but far from the front at surface (Fig. 3a).
Cloudiness and precipitation behind of the subtropical front (Fig. 3b) similar to a cold front (Fig. 1c).

Fig. 2 Synoptic chart at 00:00 UTC on May 19, 2013 showing the features of a typical subtropical front. Sea level pressure (hPa) is represented with continuous black lines and 1000-500 hPa thickness (black dashed lines). Synoptic symbols plotted in conventional model are also shown in the figure. The zoom emphasizes that the values in the synoptic chart have weak dew point temperature gradient (see orange boxes, for example).
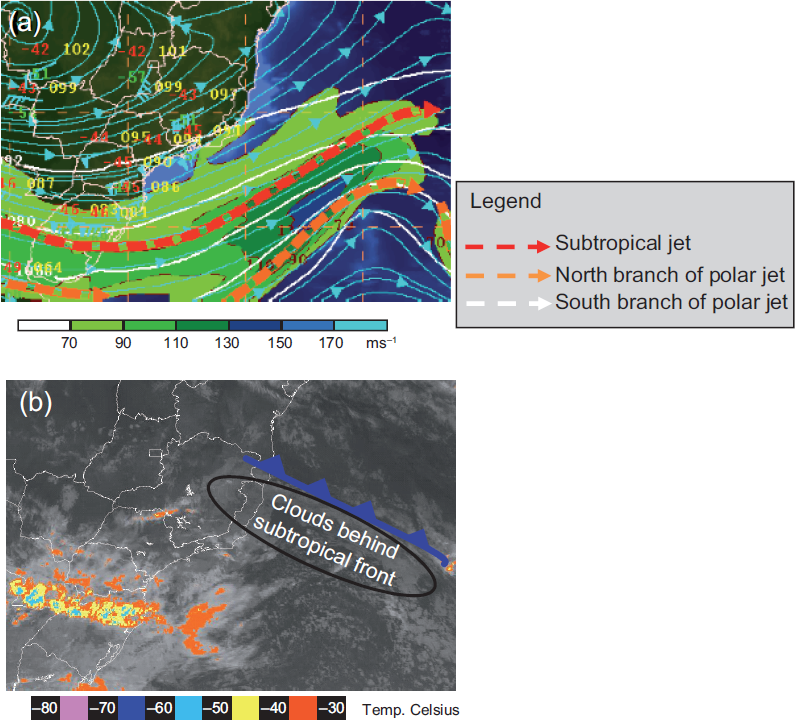
Fig. 3 Synoptic fields at 00:00 Z on May 19, 2013 showing the features of a typical subtropical front. (a) Synoptic chart at 250 hPa showing the geopotential height in tens of meters (white lines), streamlines (light blue lines), isotachs (kts; green shaded), upper level jets stream position with the subtropical jet indicated by the red color and the and upper-level data from synoptic weather stations plotted in conventional model. (b) Brightness temperature (ºC) from GOES-13 (data from CPTEC, INPE).
3.3 Baroclinic troughs
A baroclinic trough has the following features in the synoptic charts:
Weak horizontal temperature gradient at surface or weak horizontal 1000-500 hPa thickness gradient (Fig. 4).
Usually, they are the cold fronts of extratropical cyclones with a weak baroclinicity represented throughout a weak horizontal 1000-500 hPa thickness gradient (Fig. 4).
Strong horizontal gradient of humidity and/or total precipitable water; dew point temperature, specific humidity and equivalent potential temperature.
Gradual wind shift in the cyclonic sense.
Subtropical jet stream associated with the baroclinic trough at surface (Fig. 5a). The polar jet stream is not associated with this system.
Cloudiness and precipitation occur ahead of the trough (Fig. 5b), in the warmer side of the system.
In many cases, baroclinic troughs are associated with South Atlantic Convergence Zone (SACZ) events (Carvalho et al., 2004).
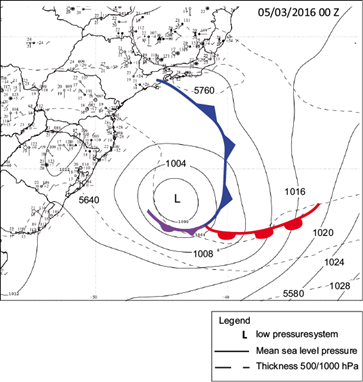
Fig. 4 Synoptic chart at 00:00 UTC on March 5, 2016. Sea level pressure (hPa) is represented with continuous black lines and 1000-500hPa thickness in black dashed lines. Synop symbols plotted in conventional model are also shown in the figure.
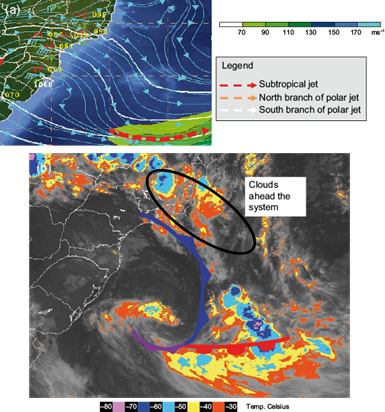
Fig. 5 Synoptic fields at 00:00 UTC on March 5, 2016. (a) Synoptic chart at 250 hPa showing the geopotential height in tens of meters (white lines), streamlines (light blue lines), upper level jets stream position and upper data from synoptic weather stations plotted in conventional model. (b) Brightness temperature (ºC) from GOES-13 (from CPTEC, INPE).
In summary, the main differences between classical cold fronts and baroclinic troughs over the Southern Hemisphere can be observed in Figure 6 (adapted from Sanders, 2005). Classical cold fronts are associated with more intense horizontal temperature gradient over their cold side than baroclinic troughs. Moreover, clouds and precipitation also occur on the cold side of the frontal systems while in baroclinic troughs it occurs on the warm side of these systems. As mentioned in Sanders (2005), most of the weather forecasters confuse baroclinic troughs with classical cold fronts because in both there are cloudiness bands. Table I summarizes the principal differences between the three types of surface baroclinic zones.
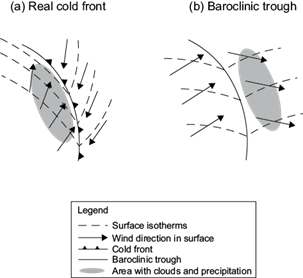
Fig. 6 (a) Schematic sketches of a real cold front and (b) a baroclinic trough for the Southern Hemisphere. Adapted from Sanders (2005).
Table I Main properties associated with the three analyzed surface baroclinic zones over South America and the South Atlantic Ocean. The last two lines of the table include the results obtained in this work.
| Properties | Classical cold front | Subtropical front | Baroclinic trough |
| Horizontal temperature gradient at surface | Located ahead of an intense gradient | Located ahead of a weak gradient | Located ahead of a weak gradient |
| Horizontal 1000-500 hPa thickness gradient | Located ahead of an intense gradient | Located ahead of a weak gradient | Located ahead of a weak gradient |
| Horizontal dew point temperature gradient at surface | Located ahead of an intense gradient | Located ahead of a weak gradient | Located ahead of a strong or moderate gradient |
| Wind shift | Abrupt in the cyclonic sense | Gradual in the cyclonic sense | Gradual in the cyclonic sense |
| Upper level jet stream | Polar jet or subtropical jet coupled with polar jet | Subtropical jet or polar jet coupled with subtropical jet, but far from the front in surface | Subtropical jet |
| Cloudiness and precipitation | Behind of the frontal system | Behind of the frontal system | Ahead of the system |
| Preferential latitude | South of 20º S | Between 25º-15º S | Between 25º-15º S |
| Most frequent period season of the year | Winter | Spring | Spring/summer |
3.4 Methods
After the identification of the different baroclinic systems with the criteria presented, the total number of classical cold fronts, subtropical fronts and baroclinic troughs passing by the eight cities along the Brazilian coast from 2010 to 2016 were computed. Furthermore, the monthly and seasonal averages (summer from December to February; autumn from March to May; winter from June to August, and spring from September to November) of these systems were determined.
From the eight studied cities, three (São Paulo, Rio de Janeiro and Vitória) have well defined dry (from May to September) and wet (from October to April) seasons (Kousky, 1988; Reboita et al., 2010; Marengo et al., 2012). Hence, for these cities we also computed the total number of systems for dry and wet periods from 2010 to 2016.
In order to estimate the percentage of precipitation associated with each kind of system in the region with a well-defined dry and wet period, São Paulo was the city chosen for this analysis. For this reason, the same methodology by Silva et al. (2014), de Jesus et al. (2016) and Andrade (2017) was applied, i.e., the precipitation from a classical cold front is one that occurs in the period between a day before (pre-frontal rain) and a day after (post-frontal rain) the passage of the cold front. The same method was applied for the precipitation associated with subtropical fronts and baroclinic troughs.
4. Results
4.1 Mean annual frequency
The annual mean and the total number of classical cold fronts, subtropical fronts and baroclinic troughs for each city are shown in Figure 7. The frequency of classical cold fronts decreases from the south to the northeast coast of Brazil, while the frequency of subtropical fronts increases in this direction. On the other hand, baroclinic troughs are more frequent along southeastern Brazil (20º-15º S). The highest annual mean of classical cold fronts is registered in Porto Alegre (48 systems/year), of subtropical fronts in Vitória (~6 systems/year) and of baroclinic troughs is São Paulo and Rio de Janeiro (11 systems/year).
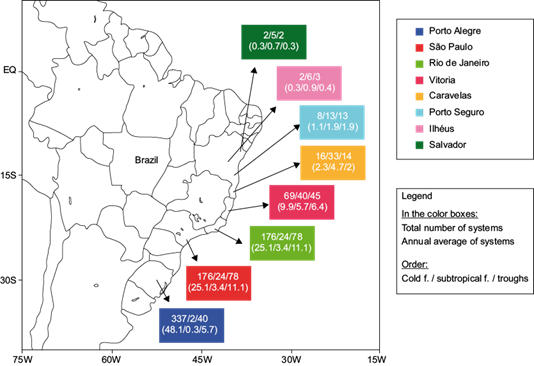
Fig. 7 Annual mean and total of classical cold fronts, subtropical fronts and baroclinic troughs by city in the period 2010-2016. The initial part of the arrows indicates the cities location. The frequency of the systems is shown in color boxes. The first line in each box indicates the total number of systems while the second one, the annual mean.
4.2 Monthly and seasonal frequency
Figure 8 shows the monthly and seasonal frequency of classical cold fronts, subtropical fronts and baroclinic troughs for each city. Cold fronts are more frequent in winter followed by spring in all the cities studied (Fig. 8a, d). This result is associated with the position of the polar jet during the year. In the austral winter (summer), this jet reaches the most northerly (southerly) position and, consequently, the classical cold fronts follow it. Due to this seasonal pattern, cold fronts reach more frequently Brazil in winter. The findings here agree partly with other works about cold fronts in Brazil, such as Cavalcanti and Kousky (2009) and Foss et al. (2017). These works, in general, used an automatic method based on the change of the wind direction from north to south quadrant to identify cold fronts. This criterion together with changes in air temperature and pressure are not enough to classify cold fronts as classical ones. Other systems can be included in the statistics, like a trough, which is also associated with change in the wind direction, but it does not have a strong horizontal temperature gradient at surface. For this reason, those works show higher frequency of cold fronts in spring in southeastern Brazil. We emphasize that to guarantee the presence of a classical cold front it is necessary to analyze the synoptic charts.

Fig. 8 Monthly and seasonal mean (2010-2016) of classical cold fronts, subtropical fronts and baroclinic troughs in the eight studied cities.
Regarding subtropical fronts, these systems are more frequent in spring, except in Porto Alegre, where this kind of front essentially does not occur (Fig. 8b, e). The seasonality of subtropical fronts may be related with the presence of the Bolivian High during spring. This high has an associated ridge, which intensifies and amplifies towards the South Atlantic Ocean due to the strong pre-frontal warm advection caused by the frontal systems coming from the south of the continent. Consequently, by conservation of absolute vorticity, the upper level trough that is ahead of the ridge also intensifies and amplifies over the Atlantic Ocean (Kousky and Gan, 1981). During this atmospheric configuration, some classical cold fronts can advance to lower latitudes, mainly over the ocean, becoming subtropical fronts.
Baroclinic troughs occur preferentially in spring and summer and are less frequent in winter (Fig. 8c, f). Most of these surface systems are associated with the displacement of a trough in the middle troposphere that moves mainly from west to east. In general, the surface troughs are coupled with the subtropical jet stream in upper levels that, when interacting with a humid and warm air mass, organize a band of cloudiness. In this situation, the latent heat released by condensation can contribute to develop a low-pressure system in the surface, i.e., a cyclogenetic process (Evans and Braun, 2012; Gozzo et al., 2014). Most of these systems are weak extratropical cyclones, but in some cases, they can be subtropical cyclones (which are more frequent during the rainy season of Brazil [Gozzo et al., 2014]).
4.3 Dry and rainy season in southeastern Brazil
Since Brazil has a large territory, it experiences different climate regimes (Reboita et al., 2010). In the southeastern region, the most populated of the country, a rainy season from October to April and a dry season from May to September (Kousky, 1988; Reboita et al., 2010; Marengo et al., 2012) predominate. Due to this feature, we also identified the frequency of baroclinic zones in the dry and wet periods (2010-2016) in São Paulo, Rio de Janeiro and Vitória (Fig. 9), which are cities located in southeastern Brazil as shown in Figure 7.

Fig. 9 Total number (2010-2016) of classical cold fronts, subtropical fronts and baroclinic troughs in the rainy (October-April) and dry (May-September) seasons from 2010 to 2016, in three cities in southeastern Brazil.
The highest number of classical cold fronts occur during the dry season for all three cities in the southeast of Brazil: 104 systems in São Paulo, 77 in Rio de Janeiro and 53 in Vitória (Fig. 9a). Indeed, the dry period occurs concomitantly with the austral winter and it contributes to an environment favorable to the cold fronts occurrence. The frequency of subtropical fronts is slightly higher during the dry season than in the rainy season (Fig. 9b); this small difference can be associated with the influence of September, inside the dry season, and October, inside the rainy season, which are months with great frequency of subtropical fronts (Fig. 8b). During the dry season, the number of subtropical fronts detected was 15 in São Paulo, 18 in Rio de Janeiro and 21 in Vitória (Fig. 9b). Baroclinic troughs show an opposite behavior to classical cold fronts, meaning that these systems are more frequent during the rainy season. From 2010 to 2016, during the rainy season, 61, 47, and 43 baroclinic troughs were observed in São Paulo, Rio de Janeiro and Vitória, respectively (Fig. 9c). According to the CPTEC-INPE forecasters experience, the number of troughs during the rainy season is large and they are associated with the occurrence of the SACZ.
The percentage of precipitation associated with each of the three systems in relation to the total precipitation of the rainy and dry seasons was computed for São Paulo city (Fig. 10). According to Figure 9, during the rainy season in São Paulo there are more cold fronts and baroclinic troughs than subtropical fronts. This result impacts directly on precipitation, since these two baroclinic zones amount to 36.2% of precipitation. The contribution of subtropical fronts to precipitation during the rainy season is only 1.6% (Fig. 10). During the dry season, the number of classical cold fronts in São Paulo is higher than the other two baroclinic systems (Fig. 9). However, precipitation in this period is associated mainly with baroclinic troughs, 45.6% of the total (Fig. 10). A possible explanation of this behavior can be related to the combination of baroclinic troughs with higher temperatures observed over the southeastern region of Brazil during the end of the dry season (August and September). In this time of the year, convection becomes more frequent over São Paulo city and this factor can be responsible for more rain than that produced by cold fronts during the beginning of the dry season (May, June and July). At the beginning of the dry season, air masses are very dry in the southeastern region of Brazil, and the transients cannot produce significant volumes of rain. In Figure 10, the “other systems” classification refers to the instability produced by the combination of high temperatures and the presence of a humid air mass and by the passage of cyclonic disturbances in the middle troposphere.
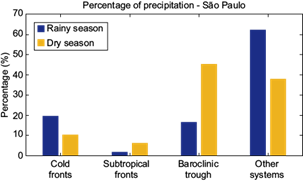
Fig. 10 Percentage of precipitation (%) associated with classical cold fronts, subtropical fronts, baroclinic troughs and other systems during the dry and rainy seasons (2010-2016) in São Paulo city.
In a more global analysis, during the rainy season almost 40% of the precipitation is associated with the three baroclinic systems while in the dry season this number increases to 60% (Fig. 10). This result agrees with other studies such as the one by Silva et al. (2014), who established a climatology of cold fronts for a city in southeastern Brazil using the changes in wind direction to identify the systems. As mentioned before, this criterion does not allow the separation of subtropical fronts and baroclinic troughs from classical cold fronts. For this reason, the total precipitation associated with cold fronts in those studies is similar to the sum of precipitation provided here by classical cold fronts, subtropical fronts and baroclinic troughs.
5. Conclusions
A climatology of the principal surface baroclinic zones (classical cold fronts, subtropical fronts and baroclinic troughs) along the coast of Brazil was established through the application of criteria based on traditional synoptic charts.
The main difference between the three analyzed surface baroclinic zones is related to the horizontal temperature gradient. Classical cold fronts show a moderate or strong horizontal temperature gradient in relation to subtropical fronts and baroclinic troughs. We highlighted that it is very hard to define thresholds for the horizontal temperature gradient associated with different systems, since it depends on the region of occurrence, the season and meteorological event. For this reason, to classify baroclinic systems other features need to be analyzed. For example, cloudiness occurs ahead of the baroclinic troughs, while it occurs behind in classical cold fronts and subtropical fronts.
Classical cold fronts are more frequent in winter followed by spring in all the studied cities, while subtropical fronts occur preferentially in spring and in cities located along the southeast of Brazil. On the other hand, baroclinic troughs are more frequent in spring and summer and in the south and southeast regions of Brazil.
In southeastern Brazil, classical cold fronts and subtropical fronts are more frequent during the dry season, while baroclinic troughs occur more often during the rainy period; however, the latter have also a great contribution to total precipitation at the end of the dry season. In São Paulo city, during the dry season baroclinic troughs justify 45.6% of the total precipitation while in the rainy season this value is 16.6%. Considering the three surface baroclinic zones together, baroclinic troughs are responsible for about 40% (60%) of the total precipitation during the rainy (dry) season.
Finally, in order to improve the knowledge and criteria for identification of the different baroclinic zones, a statistical analysis of the magnitude of horizontal gradients in different meteorological variables should be carried out.

