


 nueva página del texto (beta)
 Inglés (pdf)
 Artículo en XML
 Referencias del artículo
 Enviar artículo por email
 Citado por SciELO
  Similares en
SciELO
Similares en
SciELO 
 Permalink
1. Introduction
One of the most important phenomena in arid and semiarid climates is dust formation, which is among the seriously damaging environmental issues in these areas (Kutiel and Furman, 2003). In many environmental studies such as dust balance calculation in arid and semiarid areas (Rajot, 2001), water and soil pollutions caused by polluted sediments and toxic particles, and the amount of metal entering to the oceans (Jickells et al., 2005), the estimation or measurement of dust deposition rate (DDR) has been vital (Arimoto et al., 2005). DDR is influenced by many parameters including those affecting dust source, dust transfer, and particles deposition (McTainish et al., 1997). DDR essentially depends on dust supply rate from the source, precipitation, atmospheric turbulence and climatic conditions in the source and destination regions (Ta et al., 2004). Soil conditions such as soil moisture, soil texture, surface roughness, binding energy among soil particles, vegetation, and topography (Xuan et al., 2004) are mentioned as the main attributes of dust sources. Hojati et al. (2012) stated that climatic conditions in places where dust particles are deposited, distance from sources of dust, and differences between local and remote sources of dust storms are three factors controlling DDR. On the other hand, drought and increased desertification due to human activities can enhance DDR (McTainsh, 1999).
DDR in the world varies from 0.05 to 450 g m-2 year-1 (Lawrence and Neff, 2009). Identifying dust sources and estimating dust emission rates are necessary, especially for investigating atmospheric dust pollutions (Lu et al., 2007). The extent of dust effects on air quality, public health and climate depends on the particle size and chemical composition of dust (Zheng et al., 2010). Generally, the chemical and mineralogical properties of dust particles are similar to those of the soil from which they are derived (Lawrence and Neff, 2009). Iran is not only one of the world’s major sources of dust formation (Sing and Sing, 2010), but also the geographical distribution of atmospheric dust shows that DDR in this country is very high (Tanaka and Chiba, 2006).
Various studies have been conducted on the physical and chemical properties, as well as the deposition rate of atmospheric dust in different regions of Iran (Zarasvandi et al., 2011; Hojati et al., 2012; Rashki et al., 2013; Norouzi et al., 2015; Naderizadeh et al., 2016). In recent years, the crisis caused by dust in Isfahan, a historical city in central Iran, has been claimed as one of the worst natural disasters affecting the daily life of citizens as well as the regional economy. The province of Isfahan is one of Iran’s arid and semi-arid regions, having vast natural and anthropogenic sources for dust production. Currently, the main dust source in Isfahan city is the Segzi plain, located at the east. In addition, the Gavkhouni wetland with an area of 47 000 ha in the southeast of Isfahan (52 39 E, 32 25ˊ N), is one of the most valuable aquatic ecosystems of the region and plays a vital role for sustainable development. However, in recent years, the quality and quantity of this wetland’s water have declined and destruction of this natural ecosystem has begun. Upstream diversions, as well as unfair management of water resources have led to reduced inflows downstream and undesirable ecological effects on the Gavkhouni wetland. On the other hand, excessive input of untreated industrial and domestic wastewater from Isfahan has influenced the quality of the wetland’s water. Drought occurrences arising from climate change have intensified all of these problems in recent years. These conditions have had adverse impacts on the Gavkhouni wetland and have changed the hydrological regime of this natural ecosystem. Subsequently, it has turned into a saltpan.
Effects of the dried-up Gavkhouni wetland could be classified as ecological, social, economical and health-related issues. The main problem appears to be the salt desert with an area of 47 000 ha that is covered with a thick salt deposit. When drought happens, wind carries the salts, chemicals, heavy metals, fertilizers and pesticides deposited in the wetland basin to other areas. These materials damage agricultural lands, pollute the ecosystem and cause a variety of diseases in affected rural and urban areas, especially Isfahan city.
Saline dust storms differ from ordinary storms in terms of suspended particle sources, chemical composition, particle size, and distribution processes. They are defined as a sort of environmental disaster in arid and semiarid areas that arises from dust extraction originated from mineral-rich sediments of the wetlands, and dried lakes and saline soils around the wetlands and lake margins (Abuduwaili et al., 2010). This kind of phenomenon has already been registered in many parts of the world such as the Aral Sea in Kazakhstan and Uzbekistan, the Balkhash Lake in Kazakhstan, Inner Mongolia in China, Southeast Australia and many other semi-arid and arid regions (Gill, 1996). It is obvious that due to the accumulation of salts, lack of vegetation and also wind erosion, these sediments will have a loose-structured surface (Abuduwaili et al., 2010). Compared to ordinary dust storms, saline dust storms carry high concentrations of fine particles of saline-alkaline salts such as sodium sulfate, sodium chloride and other potentially toxic substances that threaten the environment and human health in arid regions (Small et al., 2001; Mu et al., 2002).
The chemical composition of saline dust storms depends on soil properties, which might lead to doubling effects, depending on the nature of the carried materials. According to some studies, saline dust storms enriched by CaCl2, NaCl, MgCl2 and other chloride particles can remain suspended in the atmosphere for a long time (Liu et al., 2011). Therefore, it is vital to study the atmospheric dust formation in the Gavkhouni sub-basin and determine the relationship between dust particles and their effective characteristics that can be considered as a possible natural source of dust production in Isfahan.
In recent decades, among the non-linear indirect methods, attention has been focused on intelligent systems in agriculture and natural resources studies (Twarakavi et al., 2009; Besalatpour et al., 2013; Abbaszadeh Afshar et al., 2016). Intelligent system methods such as decision tree based Chi-square Automatic Interaction Detection (CHAID) algorithm can be used to provide a low-cost solution and to solve the problems of imprecision and uncertainty, and also to avoid over-fitting problems (Huang et al., 2010; Besalatpour et al., 2014). These methods make intelligent systems able to analyze the long-term series of large-scale data and thus solve the problems that conventional methods are not still able to analyze and fix up in a cost-effective way (Wang et al., 2009; Huang et al., 2010; Besalatpour et al., 2013). The decision tree is a robust and popular data mining method and a tool for classification and prediction of problems, which is now widely used in medical, social, economic and environmental studies. The CHAID method is a decision tree algorithm that has been rarely used to investigate the determinant factors influencing DDR. In this study, the CHAID algorithm was used to determine the non-linear relationship of physical and chemical properties of soil in the Gavkhouni wetland sub-basin, located in Central Iran, and the seasonal and annual DDR. Furthermore, the results obtained with this method were compared to those of the commonly used multiple linear regression (MLR) in order to investigate the accuracy and performance of the CHAID algorithm.
2. Materials and methods
2.1 Study area
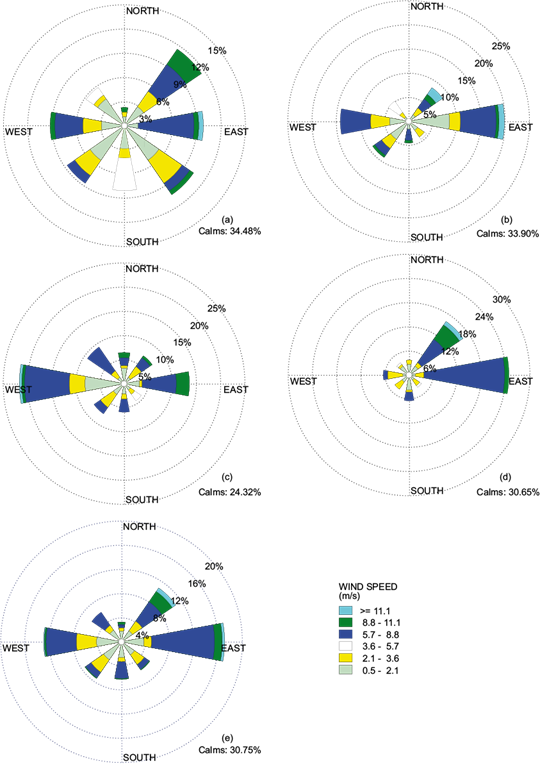
The Gavkhouni wetland sub-basin, located in Central Iran (31º 51’-32º 45’ N, 52º 31’-53º 21’ E), has an area of 3616 km2 (Fig. 1a). The average altitude of this sub-basin is 1549 m. The international Gavkhouni wetland occupies about 472 km2 of the basin area and is located in the outermost part of the Zayandeh Roud river in the southeastern part of Isfahan city. Based on the Koppen classification, this region has a dry climate. Average annual precipitation is about 60 mm and the mean precipitation during the sampling period in autumn, winter, spring and summer was 18.2, 31.8, 9.1, and 1.1 mm, respectively. The average annual temperature is 18.6 ºC and the mean temperature during sampling periods in autumn, winter, spring and summer was 8.8, 8.9, 27.7, and 29.3 ºC, respectively. Figure 2 shows wind roses of the atmospheric dust sampling periods, which were plotted using the WR View 7.0.0 software.
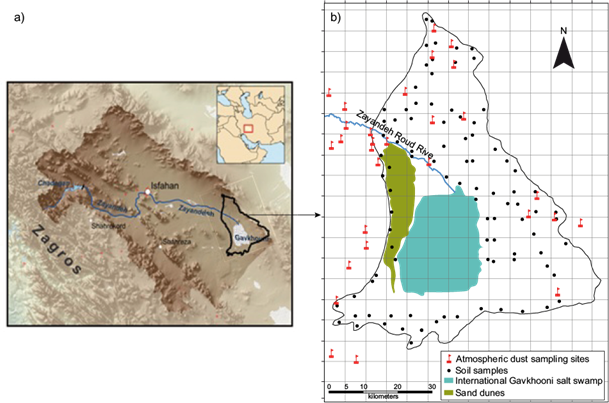
Fig. 1 The location of Gavkhouni wetland sub-basin. (a) Atmospheric dust and (b) surface soil sampling sites.
2.2 Sampling method
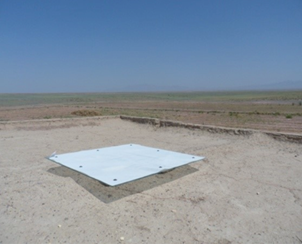
A set of 124 atmospheric dust samples was collected from a flat surface with an area of 1 m2 (Fig. 3). This method has been widely used in previous studies (Menéndez et al., 2007; Hojati et al., 2012; Norouzi et et al., 2015). The sampling surface consisted of a glass plate (1 × 1 m) covered with a PVC net (2 mm mesh opening) in order to trap atmospheric dust particles. In each sampling site, a glass tray was placed on a roof of a one-floor building about 3-4 m above the ground level. Dust samples were collected from 31 sampling sites (Fig. 1b) from autumn 2013 to summer 2014. The last two months (60 days) of each four seasons were considered as a dust-sampling period.
Atmospheric dust samples trapped on glass trays were collected and transferred to the laboratory in plastic sealed containers. At the end of each sampling period, glass trays were washed with distilled water. DDR was calculated according to Eq. 1 (Hojati et al., 2012):
In addition, a particle size distribution analysis of atmospheric dust was carried out. Dust sand particles (0.05-2 mm) were separated by sieving through a 270-mesh US standard sieve. Dust silt particles (0.002-0.05 mm) were also separated from dust clay particles (< 0.002 mm) by centrifuge, according to the Stokes law (Burt, 2004).
Surface soil samplings (0-10 cm) from the Gavkhouni sub-basin were carried out by the method of random sampling within blocks at the beginning of the atmospheric dust sampling, in autumn 2013. According to the Gavkhouni sub-basin area (i.e., 3616 km2), the region was divided into 96 blocks with an area of 6 × 6 km and surface soil samples were collected randomly in each block from a depth of 0-10 cm (Fig. 1b). Soil samples were passed through a 2 mm sieve after air-drying. Gravel content was determined using the volumetric method. Other soil analyses included electrical conductivity (EC) and soil pH (Page et al., 1986), soil organic matter (Walkley and Black, 1934), dissolved sodium concentration (Chapman, 1965), concentrations of dissolved calcium and magnesium (Burt, 2014), calcium carbonate equivalent (CCE) (Allison and Moodie 1965), gypsum (Artieda et al., 2006) and clay, silt and sand percentages (Gee and Bauder, 1986).
2.3 Statistical descriptions
SPSS 23 software was used to determine the statistical characteristics of data including maximum, minimum, mean, skewness, kurtosis and coefficient of variation (CV), as well as investigating the correlation of DDR and soil properties. Distribution of variables was investigated using the Kolmogorov-Smirnov test (Massey, 1951).
2.4 Multiple linear regression
Linear regressions are simple modeling methods that can be used to predict one or more response variable (dependent) values from a set of predictors (independent). Linear regressions may be used for bivariate and/or multiple regressions. In bivariate regressions, there are one independent variable and one dependent variable, while in multiple regression analysis there are one dependent variable and two or more independent variables. Eq. (2) is an example of an overall multiple linear regression:
Where Y is the dependent variable, X is the independent variable, and βi is the regression coefficient of variable X i (Schneider et al., 2010).
2.5 CHAID algorithm method
The CHAID method was originally proposed by Kass (1980) and was then further developed by Magidson (1993). CHAID is considered one of the main decision-tree methods. In order to build a decision tree, this method splits the data into similar number of subsets until each subset of data covers a given number of samples. The CHAID algorithm can produce a decision tree that, in some cases, acts as non-binary. In fact, it uses multiple separate methods instead of binary separation means that can be divided into more than 90 parents. This algorithm uses the chi-square test to decide in each division for specifying child nodes. Tree branches are then pruned to fulfill the stop criteria or reach the required level of complexity.
In other words, the CHAID algorithm first finds the differences between each sample and the other samples to produce a tree. The pruning of the tree is done by finding the differences (Chattamvelli, 2011). In CHAID trees, the homogeneity of the groups that generated the tree is evaluated by a Bonferroni corrected P-value obtained from the chi-square statistic applied to two-way classification tables with K splits and C classes for each tree node (Maroco et al., 2011):
where n̂ ck refers to the observed frequencies of the cell ck and n̂ ck is an expected frequency under the null hypothesis of two-way homogeneity. In the CHAID analysis, the epsilon parameter for convergence and the maximum number of runs for convergence were set at 0.001 and 100, respectively. The Pearson method was used for the chi-square of the categorical target. The variable selection using CHAID was carried out using Clementine 15 software.
It should be noted that the temporal variability studies (both CHAID and MLR) were performed with the assumption that the physical and chemical characteristics of surface soil did not have a notable temporal variability in the area during the short study period, thus soil samples were collected only once.
3. Results and discussion
3.1 Statistical description of the studied properties
Table I shows annual and seasonal DDR statistics and also some measured physical and chemical parameters of surface soil in the study area. The maximum and minimum DDR were 4.8 and 3.0 t km-2 month-1 corresponding to summer and autumn, respectively. Furthermore, the maximum and minimum coefficients of variation for DDR were found in summer and spring, respectively. Norouzi (2016) also studied DDR in Isfahan province and reported that summer and autumn had the highest and lowest DDR, respectively, in this region. Ta et al. (2004) studied DDR in Gansu province, China and found that the highest and lowest DDR may happen in spring and autumn. Javed et al. (2015) reported that concentrations of all size fractions were lowest during the monsoon sampling period at all sites in Faisalabad, Pakistan.
Table Ι Descriptive statistics of physical and chemical properties of soil and DDR used for developing the CHAID model.
| Parameters | Unit | Min. | Max. | Mean | Skewness | Kurtosis | K-S | CV (%) |
| DDRAut | t km -2 month -1 | 0.1 | 15.2 | 3.0 | 1.8 | 3.3 | 0.00 | 118.8 |
| DDRWin | t km-2 month -1 | 0.1 | 18.1 | 3.9 | 1.9 | 2.8 | 0.00 | 118.5 |
| DDRSpr | t km-2 month -1 | 0.1 | 15.0 | 3.6 | 2.2 | 7.1 | 0.07* | 80.8 |
| DDRsum | t km-2 month -1 | 0.3 | 27.4 | 4.8 | 2.7 | 7.9 | 0.00 | 133.1 |
| DDRAnnual | t km-2 month -1 | 6.9 | 221.5 | 46.1 | 2.9 | 6.4 | 0.00 | 98.6 |
| Gravel (2-20 mm) | % | 0.0 | 25.8 | 12.9 | 0.1 | -1.0 | 0.18* | 52.9 |
| Sand (0.05-2 mm) | % | 61.2 | 86.7 | 76.6 | -0.7 | -0.4 | 0.02 | 8.6 |
| Silt (0.002-0.05 mm) | % | 5.2 | 26.7 | 11.0 | 1.5 | 2.6 | 0.00 | 44.1 |
| Clay (<0.002 mm) | % | 7.5 | 21.5 | 12.4 | 1.1 | 1.4 | 0.00 | 28.5 |
| SOM | % | 0.0 | 1.6 | 0.4 | 2.4 | 7.4 | 0.00 | 81.9 |
| CCE | % | 9.3 | 47.3 | 26.8 | 0.7 | 0.3 | 0.00 | 35.2 |
| Gypsum | % | 0.0 | 50.4 | 3.7 | 5.0 | 26.6 | 0.00 | 243.9 |
| pH | - | 6.8 | 8.7 | 7.9 | -0.5 | -0.6 | 0.13* | 6.8 |
| EC | dS m-1 | 0.9 | 361.7 | 60.9 | 2.0 | 3.3 | 0.00 | 159.2 |
| SAR | (meqL-1)1/2 | 1.4 | 898.7 | 151.6 | 1.7 | 3.4 | 0.00 | 141.8 |
K-S: Kolmorov-Smirnov test; CV: coefficient of variation; DDR: dust deposition rate; SOM: soil organic matter; CCE: calcium carbonate equivalent; EC: electrical conductivity; SAR: sodium adsorption ratio.
*Significant at the 5% significance level.
Al-Harbi (2015) investigated the monthly total amount of dust fall in Shuwaikh city, Kuwait and reported that the highest DDR in the study area was observed during the summer. It appears that dryness, and lack of moisture and rainfall in summer are the main reasons for increased DDR as well as a high coefficient of variation (CV) during this season.
The adhesion of dust particles is probably increased by the increase in rainfall and relative humidity, which leads to reduced dust generation in the source area and ultimately to reduced DDR in the deposition area. On the other hand, precipitation affects soil moisture and vegetation, which are the two most important factors controlling dust, and reduces the amount of dust produced (Ta et al., 2004). Kutiel and Furman (2003) reported that rainfall and the presence of vegetation significantly reduced the amount of dust because of their impacts on wind speed and particle sizes. Among the surface soil properties in the study area, gypsum, EC and sodium adsorption ratio (SAR) with a CV > 100% (Nielsen and Wendroth, 2003) had a strong variation and pH with a CV < 10% showed a weak variation. The reason for the observed changes in parameters of gypsum, EC and SAR might be the salty wetland in the region and large variations of soluble salts in soil from the wetland. The minimum CV value belonged to pH, since pH is the logarithm of H+ concentration in soil solution and if this parameter is reflected directly by proton concentration, it could show more changes. Other researchers have also observed less variation in soil pH than other soil parameters (Tesfahunegn et al., 2011; Mousavifard et al., 2013).
To determine the relationship between annual and seasonal DDR and surface soil properties in the study area, correlation coefficients were calculated (Table II). The results showed that annual and seasonal DDR (except for summer) are negatively correlated with soil pH. DDR in winter showed a significant positive correlation with CCE, EC, and SAR. However, no significant correlation was observed between the annual and seasonal DDR and other soil parameters.
Table ΙΙ Correlation coefficients between physical and chemical properties of soil and DDR.
| Parameters | DDRAut | DDRWin | DDRSpr | DDRSum | DDRAnnual |
| Gravel | -0.34 | -0.20 | -0.40* | -0.30 | -0.34 |
| Sand | 0.04 | -0.20 | -0.04 | 0.28 | 0.07 |
| Silt | -0.07 | 0.16 | -0.19 | -0.37* | -0.13 |
| Clay | 0.06 | 0.18 | 0.34 | -0.10 | 0.04 |
| SOM | 0.17 | 0.33 | 0.26 | -0.08 | 0.07 |
| CCE | 0.26 | 0.49** | 0.05 | -0.02 | 0.21 |
| Gypsum | 0.31 | 0.14 | 0.18 | 0.24 | 0.22 |
| pH | -0.43* | -0.45* | -0.40* | -0.27 | -0.43* |
| EC | 0.25 | 0.45* | 0.28 | 0.05 | 0.22 |
| SAR | 0.20 | 0.44* | 0.12 | 0.02 | 0.18 |
DDR: dust deposition rate; SOM: soil organic matter; CCE: calcium carbonate equivalent; EC: electrical conductivity; SAR: sodium adsorption ratio.
*Significant at the 5% significance level; **significant at the 1% significance level.
3.2 Linear relationships between physical and chemical properties of soil and DDR (MLR model results)
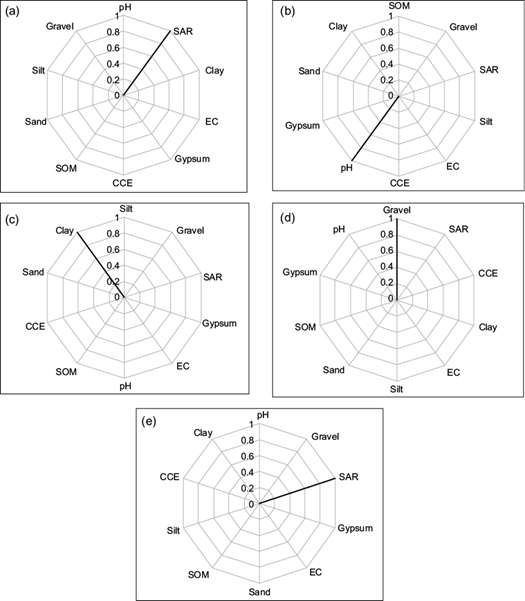
The characteristics influencing DDR in the study area were determined with the linear method (i.e., the MLR); the results are depicted in Figure 4. Based on the obtained results, the effective parameters of DDR in the study area using the MLR method in autumn, winter, spring and summer were SAR (Fig. 4a), pH (Fig. 4b), clay (Fig. 4c) and gravel (Fig. 4d), respectively. Moreover, the parameter influencing annual DDR in the study area was SAR (Fig. 4e).
3.3 Non-linear relationships between physical and chemical properties of soil and DDR (CHAID algorithm results)
Figure 5 presents the characteristics influencing DDR in the study area, which were determined by using the non-linear decision tree CHAID method. Determinant parameters in autumn in order of importance coefficients (IC) were organic matter (IC = 0.34), sand (IC = 0.28), silt (IC = 0.25), and gravel (IC = 0.14) (Fig. 5a), whereas the most effective parameters in winter were gypsum (IC = 0.42), sand (IC = 0.38), clay (IC = 0.14), and soil organic matter (IC = 0.06) (Fig. 5b).

Fig. 5 Importance coefficient (IC) values of surface soil physical and chemical parameters in the Gavkhouni sub-basin affecting DDR in (a) autumn, (b) winter, (c) spring, and (d) summer, as well as (e) annual DDR using the CHAID method.
In spring, soil texture was introduced as a determinant parameter influencing the DDR within the area where sand content was the most important feature (IC = 0.39) and silt percentage (IC = 0.26) had the minimal effect (Fig. 5c). Prevailing westerly wind in spring (Fig. 2) and sand dunes in the west of the study region, which could lead to release of sand in the area, might be the most important factors explaining the importance of sand content. In summer, five variables including silt, sand, organic matter, gypsum and soil pH had a greater influence on DDR in the study area. Among these parameters, silt had the highest importance coefficient (IC = 0.31), whereas pH and gypsum had the lowest IC (0.15) (Fig. 5d). Determinant parameters influencing annual DDR in the study area were sand, soil organic matter, silt, CCE, clay and pH, being sand the most important feature (IC = 0.23) and pH (IC = 0.04) the least significant (Fig. 5e).
3.4 Comparing MLR and CHAID model results
Based on the results obtained from the MLR model, only one parameter was introduced as determinant factor affecting DDR in the study area. However, several parameters were determined as affecting factors in each sampling period with the non-linear CHAID algorithm method. In addition, according to the results obtained with the CHAID analysis, it appears that among the measured parameters, surface soil sand content in the Gavkhouni wetland had the greatest impact on DDR during the sampling periods, where similar particle size distribution of surface soil and atmospheric dust were found (see Table III).
Table ΙΙΙ Particle size distribution of atmospheric dust and surface soil in the study area.
| Sample | Sampling period | Sand (%) | Silt (%) | Clay (%) |
| Dust | Spring | 42.30 | 33.15 | 24.55 |
| Summer | 49.73 | 29.13 | 21.14 | |
| Autumn | 56.16 | 26.27 | 17.57 | |
| Winter | 42.55 | 34.96 | 22.49 | |
| Annual | 47.69 | 30.88 | 21.44 | |
| Soil | - | 76.6 | 11.0 | 12.4 |
Therefore, it can be concluded that the accuracy of MLR is unacceptable as compared with the non-linear CHAID algorithm to determine parameters influencing DDR in the Gavkhounisub-basin. Since the results of CHAID algorithm are more acceptable and much more similar to ground measurements and natural conditions of the study area, most soil physical and chemical properties seem to have non-linear relationships with DDR in the study area. Abbaszadeh Afshar et al. (2016) found that the CHAID algorithm had a greater ability to determine clay content with higher accuracy by comparing it with the MLR method for estimating clay. Besalatpour et al. (2015) used the MLR method to model aggregate stability and reported its non-acceptable accuracy for estimating and modeling the aggregate geometric mean diameter in the northern Karun Basin. Tóth et al. (2012) developed some transitional relations based on the CHAID classification tree and used them as input data; they concluded that classification tree methods (regression trees and CHAID) are useful and effective to model complex relationships between soil water retention and soil properties in salt affected soils. In general, the CHAID algorithm has extreme flexibility and high performance to detect complex nonlinear relationships between input and output data. On the other hand, training based methods in comparison with regression-based models have much more ability to recognize relationships between inputs and target variables. Therefore, it seems that in areas with high ecological complexity and complex nonlinear relationships among input and output data, nonlinear methods such as the CHAID algorithm are superior to linear methods such as MLR.
4. Conclusions
Atmospheric dust samples (n = 124) were collected during four seasons from 31 sampling sites in the Gavkhouni wetland sub-basin, located in Central Iran, to investigate the surface soil physical and chemical properties which affect the seasonal and annual DDR using CHAID and MLR. According to the results obtained by the CHAID analysis, it appears that sand content has the highest impact on DDR in the study area among the surface soil parameters measured. The similarity of atmospheric dust particle size distribution and that of surface soil of the study area also confirms this finding. In this study, the MLR model did not have acceptable accuracy to determine the parameters affecting DDR in Gavkhouni wetland sub-basin in comparison with the non-linear CHAID algorithm. In fact, the results of CHAID were more acceptable and much more similar to measured data and natural conditions of the study area than MLR model. Therefore, it is concluded that soil physical and chemical properties have mostly non-linear relationships with DDR in the study area. These results can motivate researchers to use decision tree algorithms, particularly the CHAID method, as a novel method with relatively good accuracy and efficiency for determining nonlinear relationships of various properties with different soil characteristics, in order to achieve the greatest accuracy with minimal cost and time. However, further studies on factors affecting DDR in different regions under various weather conditions using a variety of decision tree algorithms are suggested to be carried out.

