nova página do texto(beta)
 Inglês (pdf)
 Artigo em XML
 Referências do artigo
 Enviar este artigo por email
 Citado por SciELO
  Similares em
SciELO
Similares em
SciELO 
 Permalink
1. Introduction
Black carbon (BC) aerosols are fine short-lived climate forcers emitted as a result of incomplete combustion of fossil and biomass fuels (Venkataraman et al., 2005; Rehman et al., 2011). Regardless of its short atmospheric lifetime, the strong capacity of absorbing solar radiation makes BC an extremely important aerosol species, which contributes largely to climate forcing (Ramanathan and Carmichael, 2008; Wang et al., 2014). Several scientific evidences have verified the significant contributions of BC to global warming (Ramanathan and Carmichael, 2008) and warming in high altitude regions (Menon et al., 2010). Estimates of direct radiative forcing of BC aerosols vary widely, from 0.19 (Wang et al., 2014) to 0.88 Wm-2 (Bond et al., 2013), while the Intergovernmental Panel on Climate Change (Boucher et al., 2013) reports its direct radiative forcing as 0.40 Wm-2. Not limited to this, BC is reported to have effects on the Asian monsoon (Lau et al., 2008; Kumar et al., 2017a), and thereby it has the potential to affect the hydrological cycle and regional food security (Ramanathan and Carmichael, 2008).
Among the dominant sources of BC aerosols, low temperature combustion of solid biomass fuels for residential cooking and heating purposes contribute to nearly 25% of the global BC emissions (Bond et al., 2007). These residential biomass-based fuels are the largest contributors of ambient BC emissions also in the South Asian region (Venkataraman et al., 2005; Banerjee et al., 2017), posing serious threats to human health (Janssen et al., 2011; Kumar et al., 2015a), agriculture and other areas of socio-economic interest (Banerjee et al., 2017). A 60% sectorial contribution from anthropogenic and 37% from biomass burning has also been noted over the Bay of Bengal and the Arabian Sea (Kumar et al., 2015b). Fossil fuel-based vehicular emissions (diesel and gasoline) represent another important sectorial emission of BC over this region (Sadavarte and Venkataraman, 2014). This has been the trend over India, East Asia and North America, where local sources contribute almost to 89, 77 and 73% of the BC aerosols burden, respectively. This contrasts with the former Soviet Union and Middle Asia, where local sources contribute to < 50% of the BC loading, whereas emissions from Europe account almost to 40% of the BC burden (Zhang et al., 2015). Over South and Southeast Asia, extreme pollution events like agro-residue burning in North India (Rajput et al., 2014a; Singh et al., 2018), peatland burning (like in central Kalimantan) (Stockwell et al., 2016) and celebratory fireworks over India (Kumar et al., 2016a) emit huge carbonaceous aerosols into the atmosphere. As emitted, BC aerosols are mostly hydrophobic (Laborde et al., 2013), having relatively shorter residence time (< 7 days) (Bond et al., 2013) before gradually mixing with water-soluble components through atmospheric aging, and thereby converting into a hydrophilic compound (Riemer et al., 2010). The aging timescales of BC over East and Southeast Asia, India and North America are in most cases relatively short and remain less than half a day (Wang et al., 2015).
The Indo-Gangetic Plain (IGP) is located in South Asia, covering territories of India, Pakistan and Bangladesh. It has emerged as a global aerosol hotspot with significant emissions of fine aerosols (Mhawish et al., 2017; Singh et al., 2017a, b; Kumar et al., 2018). It is well reported that the entire IGP has a huge aerosol burden, while recent satellite-based observations identified a part of central IGP with elevated fine aerosol concentration, commonly referred as the ‘aerosol pool’ region (Banerjee et al. 2015; Kumar et al., 2018). Nearly 40-50% of the total aerosol mass over the IGP is comprised of carbonaceous aerosols (Singh et al., 2017a). The prominent BC sources over IGP are the emissions from conventional fuels (fossil fuels and biofuels), less efficient combustion technologies, household cooking using wood, and a decade-old transport system (Venkataraman et al., 2005; Janssen et al., 2011; Kumar et al., 2015b; Sadavarte and Venkataraman, 2015; Banerjee et al., 2017). The regional meteorology also drives the atmospheric BC profile by facilitating the transport of the local emissions to a larger distance (Kumar et al., 2015a, b; Murari et al., 2016). The heterogeneity of aerosol properties and BC sources induces major uncertainties in estimating its climate and health effects. Such uncertainties in BC dynamics over the central IGP needs detailed investigation on the BC mass loading, temporal variations and long-term trend.
This article depicts long-term (2009-2013) characteristics of ambient BC aerosols over an urban location of the IGP. Emphasis was made in understanding the variation of BC mass concentrations in the context of temporal (both diurnal and seasonal) patterns, influence of local meteorology, especially the atmospheric boundary layer (ABL), long-range transport, and trend. Documentation of BC emissions, its trend and identification of transport pathways will possibly help to understand BC sources and dynamics over the region. As per our knowledge, such detailed analysis on BC is reported for the first time over Varanasi. Therefore, it will help to constitute a scientific basis for framing suitable policies to reduce carbonaceous aerosols over this region and will help in evaluating the model outputs for practical applications.
2. Experimental methods
2.1 Site description and general meteorology
The long-term assessment of ambient BC aerosols was made for a period of five years (January 2009-December 2013) at Varanasi (Fig. 1). Being located at one of the most fertile flood plains of the world, Varanasi has a huge population (1.6 million) with a density of 9751 inhabitants per km2 (MHA, 2011). The total number of registered vehicles in the city was 588 000 until March 2012, with an estimated annual growth of 6% (MOSPI, 2017a). As one of the important religious centers of India, the city attracts a large amount of tourism and associated anthropogenic activities throughout the year. Along with tourism, Varanasi is also characterized by many small and medium scale industries including silk weaving, metal and power equipment manufacturing, agriculture and animal husbandry within the peripheral areas. Such anthropogenic activities inject significant amounts of pollutants, especially carbonaceous aerosols into the city’s environment. The presence of huge carbonaceous aerosols over other locations of the Indo-Gangetic Basin has been previously reported by several researchers (Venkataraman et al., 2005; Kumar et al., 2015b, c). In addition to local sources, the city also experiences a significant load of aerosols via long-range transport (Kumar et al., 2015c, 2018; Sen et al., 2017).
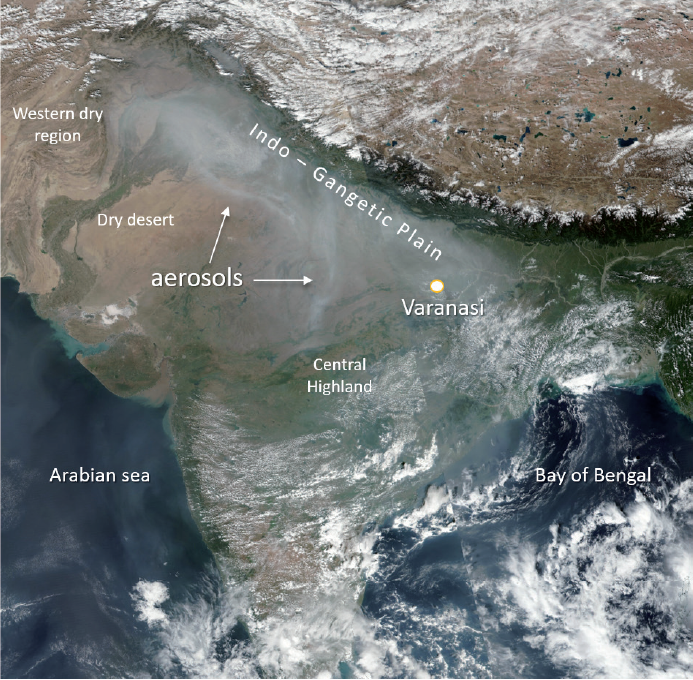
Fig. 1 Geographical location of the BC aerosol monitoring station. The background image retrieved from the Suomi NPP VIIRS satellite shows the thick aerosol layer over north India on October 31, 2016.
Varanasi (25.16º N, 82.59º E, 77 masl) typically represents an urban setting with sub-tropical semi-arid climate, having four distinct seasons, i.e. pre-monsoon (March-May), monsoon (June-September), post-monsoon (October-November), and winter (December-February). Meteorological variables, i.e. temperature, wind speed (WS), relative humidity (RH), and visibility obtained from the India Meteorological Department suggest sharp temporal variations. Temperature ranges from 7.0 ºC in winter to 40.0 ºC during the summer, while RH varies from 15 to 100%. The city receives an annual precipitation of 1100 mm, the majority of which occurs during the monsoon (Murari et al., 2017). Wind over the study site was mainly westerly during summer and winter, and easterly during the monsoon with varying wind speeds. Seasonal means of various meteorological parameters from 2009 to 2013 have been enlisted in Table AI.
2.2 Measurements and quality control
2.2.1 BC mass concentration
Real time ambient BC concentrations were measured using a seven-channel aethalometer (model-AE42, Magee Scientific, USA) from January 2009 to December 2013, at the Banaras Hindu University campus. The aethalometer was kept at an altitude of 25 m from the ground and measurements were made with a temporal resolution of 5 min. The estimation of BC mass concentration from the aethalometer is based on the attenuation of light transmitted at seven different wavelengths, i.e. 370, 470, 520, 590, 660, 880 and 950 nm via its filter tape, on which aerosols are deposited through a uniform flow rate. The BC mass concentration corresponding to 370 nm represents BC emissions from biomass burning, while BC measured at the infra-red wavelength (880 nm) was used to represent both fossil fuel and biomass burning emissions (Wang et al., 2012; Singh et al., 2018). Delta-C was computed as the difference between BC370 and BC880. To interpretate general BC characteristics, BC880 was followed while BC370 was solely used to compute Delta-C and was not described in general. The range of detection of BC concentration by the aethalometer was 0-500 µg m-3 (resolution: 0.1 µg m-3) while the uncertainty associated with the measurements was 10% (Sedlacek, 2016). Further details about the principles for estimating BC and instrumentation of the aethalometer can be found elsewhere (Sedlacek, 2016).
The rate of change in the attenuation of light is used to estimate the BC mass concentration with Eq. (1), using a specific attenuation cross-section (σ) of 16.6 m2 g−1:
where ATN is the attenuation of light of a particular wavelength, σ is the specific attenuation and [BC] is the ambient BC concentration. Theoretically, the increment in attenuation of light varies linearly with BC mass being deposited on the filter when this is not saturated with particles. However, in the case of extremely high aerosol loadings, high relative humidity and in presence of fresh BC particles, the linearity between attenuation with BC loadings diminishes due to ‘loading effects’, resulting into ambiguous estimation of BC mass concentrations. This measurement artifact was removed using an algorithm suggested by Virkkula et al. (2007).
2.2.2 Air mass trajectories and boundary layer
Air mass back trajectories, particularly in days with high and low BC mass concentrations, were computed using the Hybrid Single Particle Lagrangian Trajectory (HYSPLIT) model considering archives from the Global Data Assimilation System (GDAS). HYSPLIT (Draxler and Hess, 1998) was run to identify if there was any change in potential emission-source regions during days with high and low BC concentration. The selection of high and low BC events was based on the 25th and 75th percentiles of BC mass concentrations. ABL height was retrieved from GDAS archives from NOAA-Air Resource Laboratory at 0.5º × 0.5º resolution. ABL was retrieved with a 3-h frequency, which was further averaged over different scales to investigate the role of ABL dynamics.
2.3 Data analysis and trend estimation
BC mass concentrations retrieved at 5-min intervals were initially processed for the removal of outliers and were further averaged on various temporal scales. For estimating monotonic trends in BC aerosol, non-parametric statistical techniques were applied in view of the non-normal distribution of the BC time series over multiple years. Environmental time series data (here BC) are significantly prone to auto-correlation and seasonality; therefore, prewhitening of BC time series was made to remove auto-correlation and seasonality using seasonal trend decomposition based on the Loess method. Mann-Kendall trend test and Theil Sen’s slope functions were used to visualize and quantify the monotonic trends in the data on annual and seasonal basis. Further details of Mann-Kendall trend and Theil Sen’s slope functions may be found elsewhere (Kumar et al., 2018).
3. Results and discussion
3.1 Temporal variations in BC mass
Considerable variations in 24-h averaged BC concentrations were noted at Varanasi (Fig. 2). The 24-h averaged BC mass concentration from 2009 to 2013 varied from 1.4 to 48.1 µg m-3, with a long-term average (± SD) of 11.8 (± 8.6) µg m-3. Extremely high BC mass concentrations over Varanasi in comparison to other South Asian cities (Table I) portray the central IGP as a potential BC hotspot. The sharp temporal variation in BC concentrations is in line with other aerosol components reported elsewhere (Murari et al., 2015, 2017), depicting substantial inhomogeneity in aerosol chemistry across the region. Owing to the temporal change in emission sources and their relative strengths, such variations in BC concentration were obvious. Additionally, Varanasi is located downwind to highly polluted urban centers of the IGP, i.e. Lahore (Pakistan), New Delhi, and Kanpur (India). Hence, meteorological interventions in BC loadings are apparent on temporal scales mainly due to changing fates of pollutants with varying meteorology.
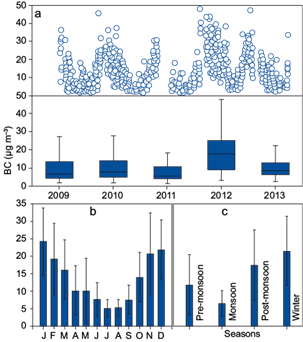
Fig. 2 Time series of BC mass concentrations at the ground station: (a) annual, (b) monthly, and (c) seasonal.
Table I BC mass loadings over different locations of South Asia.
| Station | Period of study | BC (µg m-3) | References | ||
| Minimum | Average | Maximum | |||
| Varanasi | January 2009-December 2013 | 1.4 | 11.8 ± 8.6 | 48.1 | Present study |
| Varanasi | June-September (2009-2011) | 3.2 | 5.5 ± 1.1 | 8.8 | Kumar et al., 2017a |
| Varanasi | October-December 2016 | 2.0 | 8.3 ± 2.9 | 15.4 | Singh et al., 2018 |
| New Delhi | August 2010-July 2011 | 0.9 | 6.7 ± 5.7 | 25.5 | Tiwari et al., 2013 |
| Kharagpur | December 2009 | 26 | 36.0 | 51 | Pani and Verma, 2014 |
| Kharagpur | April 2010 | 3.3 | 4.4 | 6.3 | Pani and Verma, 2014 |
| Patna | January 2015-December 2015 | 0.06 | 9.1 ± 3.5 | 28.6 | Arif et al., 2018 |
| Kathmandu | February 2013-January 2014 | 2.5 | 11.6 ± 10.7 | 20.0 | Putero et al., 2015 |
| Colombo | May 2000- December 2005 | - | 11.3 ± 3.6 | 23.4 | Seneviratne et al., 2011 |
| Karachi | April 2006-April 2007 | 1.0 | - | 15.0 | Dutkiewicz et al., 2009 |
BC mass concentrations depict a consistent seasonality throughout the study period. Figure 2 represents the seasonal and monthly variations in BC mass concentrations averaged over 2009-2013. The monthly averaged BC mass loading revealed high BC concentrations during winter, i.e. December (21.8 ± 8.7 µg m-3) and January (24.2 ± 9.7 µg m-3), and lower during the monsoon, i.e. July (5.0 ± 2.5 µg m-3) and August (5.2 ± 2.5 µg m-3). The changes in meteorological conditions over the seasons have also been recognized as a key driver in BC dynamics across India (Kumar et al., 2015b). During winter, extremely high loadings of BC aerosols were observed (21.5 ± 9.9 µg m-3, ranging from 4.4-46.8 µg m-3), followed by post-monsoon (17.4 ± 10.2; range: 3.9-48.1 µ gm-3). This may be possibly due to an increase in household emissions, like domestic heating and biomass burning, additionally influenced by frequent occurrences of stable atmospheric conditions (Kumar et al., 2017b). Essentially, the burning of paddy residues over northern India and Pakistan during post-monsoon is reported to emit 400 Gg of organic aerosols (OA) and 40 Gg of BC aerosols (Rajput et al., 2014b), mainly from burning of rice husks (90%) (Rajput al., 2011; Singh et al., 2017a). There is strong evidence of trans-boundary transport of such huge BC aerosols across the IGP, thereby causing high BC concentrations in the lower parts of this region (Kumar et al., 2015c, 2017a), which is further discussed in the following section.
Monsoon (6.4 ± 3.8 µg m-3) and pre-monsoon (11.8 ± 8.7 µg m-3) seasons exhibited a comparatively weak BC mass concentration, mainly due to incidences of wet deposition and higher convective turbulence. Increase in the ABL also facilitates the dispersion of fine mode BC aerosols. Alike the post-monsoon, the pre-monsoon season experiences agro-residues burning, especially wheat residues (Rajput et al., 2014a). However, weaker BC loadings during the pre-monsoon were possibly due to unstable meteorological conditions, which disperse BC aerosols both horizontally and vertically. Wind also governs the BC distribution (Putero et al., 2015) and has a major role in dispersing BC during the pre-monsoon season. Monsoon-specific low BC concentration are mainly driven by relative humidity and precipitation, which helps to the agglomeration of finer particles and their subsequent wet deposition. The relative contributions of specific meteorological variables to BC mass loadings are further developed in the following sections.
3.2 Distribution of BC mass
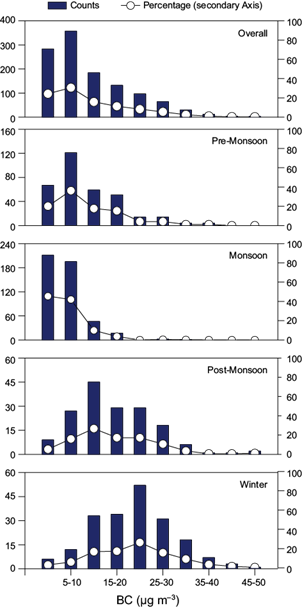
The frequency of BC mass concentrations indicate a strong seasonality in BC observational ranges (Fig. 3). The annual frequency distribution highlights the dominance of BC in ≤ 10 µg m-3, accounting for 55% of the total observations, the majority of which fall within the range of 5-10 µg m-3 (31%). The low range of BC concentrations (≤ 10 µg m-3) mainly prevailed during the pre-monsoon and monsoon seasons, accounted for 56% and 87% of the season-specific values, respectively. In contrast, only few incidences of low BC loadings (<10 µg m-3) were evident during the post-monsoon (21%) and winter (9%). Additionally, during the non-polluted seasons (summer and monsoon), larger frequencies were only observed for small concentration bins while, in polluted seasons (post-monsoon and winter), larger frequencies were noted in high concentration bins. Likewise, in the pre-monsoon, the majority of the BC concentration remain within 5-10 µg m-3, while in monsoon, BC mainly persists < 5 µg m-3i (45%). Nevertheless, some specific incidences of high BC concentrations (15-20 µg m-3) were also evident during the pre-monsoon (15%), referring auxiliary effects of local emissions and transported BC from upper IGP during the wheat residue burning period (Kumar et al., 2016b). However, extremely high BC values (≥ 20 µg m-3) were only noted during post-monsoon (34%) and winter (57%), consistent with the general BC observations over the region (Udayasoorian et al., 2014). Likewise, during winter, 27% of the BC observations were in the range of 20-25 µg m-3, while concentrations exceed 30 µg m-3 in 6% of days.
3.3 Diurnal variation of BC aerosols
Diurnal variation of BC aerosols averaged over 5 yrs was typically bimodal, consisting of two isolated peaks, i.e. one during the early-morning (06:00-08:00 LT) and the other during evening hours (22:00-00:00 LT; Fig. 4). However, the extent of peaks during morning and evening hours differs, with higher magnitude during the evening hours irrespective of seasons. Fig. 4 also includes BC diurnal variations for the respective seasons anticipating different mechanisms of BC dynamics. The initial rise in BC concentrations began just at sunrise (05:00-06:00 LT), achieving its maximum at 07:00-09:00 h (16 ± 9 µg m-3) before decreasing at 14:00-16:00 h (5 ± 3 µg m-3). The entrainment of BC nocturnal residuals starts during early morning hours, leading to an augmented BC concentration only during a few hours. This phenomenon, commonly referred as ‘fumigation effect’, coupled with other anthropogenic emissions during early rush hours (mainly cooking, commuting etc.), is responsible for initial BC peaks. A further rise in temperature during daytime leads to a deepening of the ABL height and the consequent dilution of BC particles to its minimum concentration (5 ± 2 µg m-3). With the sunset, the second peak in BC concentration merge with the evening traffic rush hours (17:00-20:00 LT). However, the BC concentration continues to rise and reaches its maximum at 23:00 h (20 ± 12 µg m-3), mainly due to restricted vertical mixing of the prevailing air mass. The diurnal variations of BC concentrations are highly region-specific, having specific signatures of regional emissions and meteorological conditions. Highly variable BC dynamics were also reported over different locations across South Asia, particularly over Karachi (Dutkiewicz et al., 2009), Lahore (Husain et al., 2007), and Kathmandu (Putero et al., 2015), highlighting different profiles in BC concentrations across the seasons.
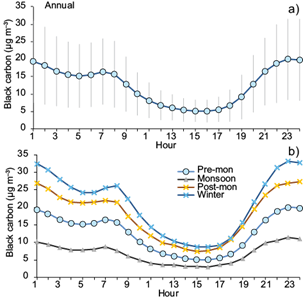
Diurnal variations of the BC aerosol mass are also plotted in Figure 4 for individual season averages from 2009 to 2013. The night-to-day BC ratio varied from 1.8 to 2.1 (mean ± SD: 1.89 ± 0.09), with ratios > 2.0 mainly from August to November. There was strong inter-seasonal deviation in BC mass, most significantly during the post-monsoon (day: 12 ± 2; night: 23 ± 1 µ gm-3) and winter (15 ± 1; 27 ± 2 µg m-3) compared to pre-monsoon (7 ± 2; 14 ± 2 µg m-3) and monsoon (5 ± 1; 9 ± 1 µg m-3). Irrespective of the seasons, greater daytime fluctuations in BC mass concentrations (8.6-30.5 µg m-3) were also noted compared to nighttime (6.2-17.8 µg m-3), which may be influenced by periodicity in household, transport activities and local convective processes.
3.4 Impact of the atmospheric boundary layer and local meteorology on BC aerosols
The influence of the ABL on temporal and diurnal variations of BC mass was further investigated. Figure 5a shows the variations in monthly averaged ABL heights with BC loadings averaged over the entire study period.
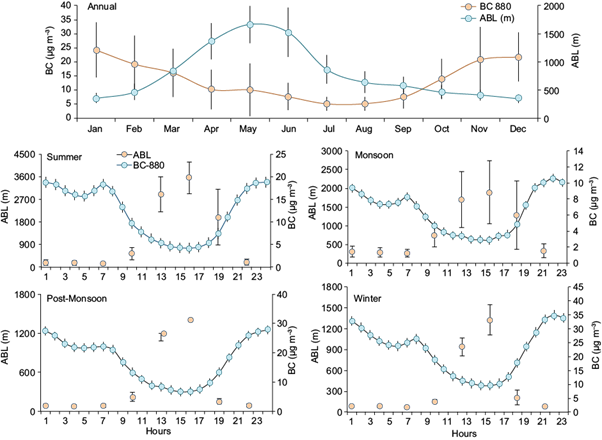
An inverse relation between ABL height and BC mass concentration was noted throughout the monitoring period. ABL height ranged from 307 m in December to 2100 m in May, with annual average (± SD) of 794 m (207 m). Seasonal observations depicted extremely shallower ABL heights, as low as 390 ± 77 m during winter, while it was quite deeper during the pre-monsoon season (1295 ± 384 m). High BC concentrations in winter (21.5 ± 9.9 µg m-3) and post-monsoon (17.4 ± 10.2 µg m-3) are in good correspondence with their lowest ABL heights, indicating minimal ambient mixing of BC in comparison to pre-monsoon (11.8 ± 8.7 µg m-3) and monsoon seasons (6.4 ± 3.8 µg m-3). Ambient BC mass concentrations and ABL heights reflected the negative correlation between the two variables (r = -0.25), varying considerably across seasons.
The influence of boundary layer dynamics on BC loadings was also evaluated for individual seasons on a diurnal scale (Fig. 5b). Diurnal cycles of both BC and ABL heights were found negatively associated, showing highest nocturnal BC concentrations (5-yr nighttime BC average: 27.2 ± 1.59 µg m-3) when ABL height was minimum (nighttime ABL: 388 ± 633 m) and vice-versa (daytime BC: 14.6 ± 1.05 µg m-3; daytime ABL: 1104 ± 1092 m). The diurnal variation in BC loadings observed over central IGP with elevated nocturnal peaks clearly highlighted the foremost role of ABL in regulating BC mass concentrations. The influence of ABL height on BC dynamics was consistent across the seasons. This suggest a stronger impact of boundary layer on the diurnal variations of BC aerosols in comparison to their seasonal behavior, which is mostly affected by the variation in BC source strengths and long-range transport of BC aerosols.
3.5 Source characterization and long-range transport
In comparison to long-lived greenhouse gases, the residence time of BC aerosols is relatively short and is mainly influenced by meteorology and the geographical region (Liu et al., 2011). There have been significant uncertainties in horizontal and vertical distribution of BC aerosols, which cause uncertainties in BC-induced radiative forcing. Multi-fold increase in direct radiative forcing efficiency of BC has been reported with increase in altitude, which is in contrast with the reduction in semi-direct effects. Still, there are evidences of rise in precipitation with increase in near-surface BC concentrations, while at high altitudes BC is believed to reduce precipitation (Samset and Myhre, 2015). The long-range transport and atmospheric aging of BC aerosols are also reported to influence its physical property, modifying it from hydrophobic (as emitted) to hydrophilic aerosols (coated with water-soluble components). This significantly impacts the BC residence time as otherwise BC aerosols are subject to cloud condensation nuclei and are readily scavenged from the atmosphere (Riemer et al., 2010; Singh et al., 2017a).
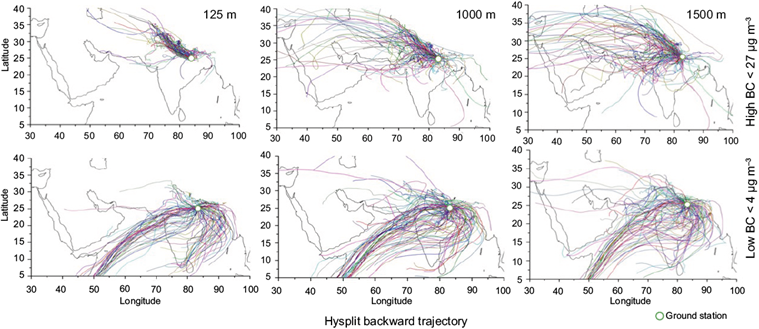
Long-range transport of BC aerosols is often reported as a significant contributor to local concentration, primarily from Asia to north Pacific, South America to southwest Atlantic (Evangelista et al., 2007), and eastern and central Asia to oceans over the Northern Hemisphere (Kaneyasu and Murayama, 2000). Over India, only local sources (89%) were however reported to influence BC concentrations (Zhang et al., 2015), while there are few evidences that indicate episode-specific contributions of transboundary aerosols over the IGP (Kumar et al., 2015b, 2017a). Considering such hypothesis and uncertainties, long-range transport of BC aerosols across the IGP were mapped contemplating two possible scenarios: days with high BC mass concentration (> 27 μg m−3, fourth quartile), and days with low BC mass concentration (< 4 μg m−3, fourth quartile) (Fig. 6).
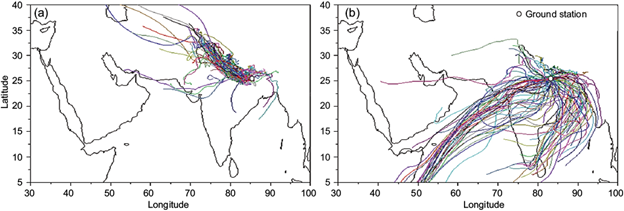
Fig. 6 HYSPLIT seven-days backward trajectories at 125 masl for (a) very high and (b) very low BC loading days (different trajectory colors indicate different BC monitoring days).
To establish the influence of regional transport of air masses, seven-day isentropic air-mass back trajectories at varying altitudes were also calculated (Fig. A1). This potentially serves as an indicator of the BC source regions and its transport. Back trajectory analysis revealed an overall contribution from both marine and continental aerosols, although to a different extent. Interestingly, at a lower altitude (125 masl, Fig. 6), days with relatively high BC concentration were only found to be influenced by air-masses originating from the upper IGP, especially from northern parts of Pakistan, the Indian state of Punjab and Haryana, and from the western semi-arid region. This is consistent with the increase in altitude (1000 and 1500 m), with additional influence of long-range transport from western semi-arid regions of Pakistan, central eastern Asia, and western dry regions of India (Fig. A1). Further, most cases of high BC loadings fall within the months of October to January, coinciding well with the dominating biomass burning period. In contrast, days with low BC mass concentrations indicate the dominance of continental air masses (from the central highlands, Deccan plateau, and the southern peninsular region) and marine air masses (from the Bay of Bengal and the Arabian Sea), without having any specific influence from the upper IGP. It should be noted that we only considered regional air-masses as a proxy for BC aerosol transport across the IGP; however, a detailed sensitivity simulation using global chemical transport model is under process. The distinction in air mass origin between days with high and low BC concentrations was prominent, providing clear evidence of the contribution of sources from the upper IGP to the local BC concentrations.
3.6 Long-term trend in BC aerosol
India’s fast-growing economy based on manufacturers and service industries resulted into a massive growth of BC emissions during the 1990s, with the IGP as the major regional source. In their estimate for the period 1960-2007, Wang et al. (2014) state that the growth of energy in India was projected to be higher (4% per year) in comparison to BC emissions (2% per year). Emissions of BC were also estimated to increase by 49% collectively from industry, transport, residential and agricultural sources from 2005-2015 (Pandey et al., 2014; Sadavarte and Venkataraman, 2015) and is projected to be doubled by 2030. Exceptional increase in coal and petroleum consumption within the last three decades coupled with emissions from biofuel-based energy mainly facilitate the increase in BC concentration.
Considering all these projections, the long-term (2009-2013) monotonic trend in BC mass concentration was evaluated using non-parametric statistics. Figure 7 shows the monotonic trend in a pre-whitened de-seasonalized annual BC time series, while within-season trends were plotted using a standard MK test. The long-term semi-decadal trend in BC mass concentration shows a statistically significant increase in BC mass concentration (0.9 µg m-3 y-1) within 95% uncertainty bounds of 0.38-1.52 µg m-3 y-1. On a closer observation of estimates, it was found that the BC trend was steeper during the later phase of the study (2011-2013) compared to the initial period. Since the majority of emission estimates over India are based on bottom-up approach (Sadavarte and Venkataraman, 2015), evaluation of key BC sources and their generalized emission budget may well be useful to understand BC emissions and its trend over a region. Increase in Indian energy consumption in terms of coal (2009-2013: 24%), crude petroleum oil (19%), natural gas (1%) (MOSPI, 2017b) as well as per capita consumption of petroleum products over the Indian state of Uttar Pradesh (7%) (MPNG, 2016) highlights the possibility of carbonaceous aerosol emission (Table AII). Beside, a 9% growth in urbanization exclusively over Uttar Pradesh (MUD, 2016) was also consistent with the increase in BC emission. Additionally, a 77% increase in the number of register vehicles over Uttar Pradesh may be used as a proxy for BC emissions and justify the increasing trend in BC aerosols.
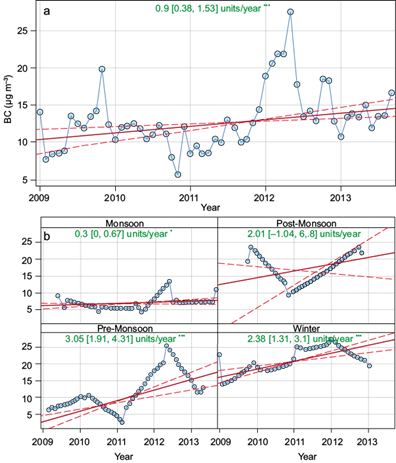
Fig. 7 Long-term trend in BC mass concentration. (a) Annual and (b) seasonal. The plot shows 5-yr trends in BC over the ground-monitoring station at Varanasi.. The blue line represents the monthly averaged aerosol optical depth time series. The solid red line shows the trend estimate and the dashed red lines show the 95% confidence intervals for the trend based on resampling methods. The overall trend is shown in green as unit per year, and the values inside the brackets denote the 95% confidence interval limits.
Considering the significant temporal heterogeneity of sources and the strengths of carbonaceous aerosols, the trend of BC aerosols was further classified into seasons (Fig. 7b). Seasonal estimates also resemble the annual increasing trend. Significant increase in BC emission during winter (2 µg m-3 y-1) and in pre-monsoon (3.0 µg m-3 y-1) depicts the high season specific contribution. The high pre-monsoon specific trend is possibly related to massive emission of wheat residue burning, coupled with recent decline in winter monsoon rainfall. There was insignificant increasing trend during post-monsoon (2.0 µg m-3 y-1), while BC trend during monsoon was feebly significant (0.3 µg m-3 per Y-1). The long-term trend estimates over central IGP clearly define the relative contribution of seasonal BC sources and therefore, require proper addressing both in terms of policy and scientific levels.
3.7 Spectral dependence of BC aerosols
To account for the temporal variation of BC sources, we assumed that the attenuation of radiation by aerosols at different wavelengths is mainly influenced by different kind of carbonaceous particles. Considering the spectral dependence of carbonaceous aerosols, BC measured at UV range (370 nm) was used as representative of biomass burning emissions, while BC measured at infrared range (880 nm) was used to represent both fossil fuel and biomass burning emissions (Wang et al., 2012; Singh et al., 2018). Such assumptions have scientific ground, as organic aerosols emitted from biomass burning emissions have higher absorption at UV range than in infrared. The difference between both, i.e. Delta-C, is reported to symbolize BC emissions mainly from biomass burning (Wang et al., 2012; Kumar et al., 2016a). To understand the variation in BC sources, monthly averages of Delta-C concentration (mean ± SD: 5.4 ± 3.1 µg m-3) is included in Fig. 8, which also shows a temporal shift in BC sources. Invariably, the highest Delta-C values were noted in December (12.7 ± 8.0 µg m-3) and January (11.0 ± 5.1 µg m-3), followed by November (10.7 ± 6.1 µg m-3). Characteristically, all the high Delta-C values (> 7 µg m-3) were noted only from October to February, which exhibits the predominant contributions of biomass burning emissions. As expected, a strong seasonality was also noted with higher Delta-C values, particularly in winter (seasonal mean: 10.4 µg m-3) while lower values were observed during summer months (2.1 µg m-3).

The diurnal variation in Delta-C was mostly consistent with the BC880nm profile, having a bimodal peak, one at 08:00 LT (9.3 µg m-3) and the next one at 22:00 LT (11.6 µgm-3). Both peaks correspond to an increase in anthropogenic emissions, particularly from vehicular emissions. This lead us to conclude with reasonable confidence that BC dynamics over the middle IGP are mostly regulated by anthropogenic emissions from local sources, mainly emissions from fossil fuel combustion and residential emissions, while biomass burning emissions during winter and post-monsoon, and the contribution from long-range transport (primarily from the upper IGP), also have considerable influence on local BC concentrations. Therefore, we strongly suggest that both long-range transport of BC and inter-seasonal variations of BC sources are necessary in regional climate and air quality modeling to improve the parameterization of BC aerosols.
4. Conclusions
The first ever long-term measurements of BC aerosols over Varanasi, in the middle IGP are presented. Discussions are made considering variations in BC sources, local meteorology, trends and a possible transport mechanism across the IGP. Some specific findings are briefed:
A considerable variation in 24-h mean BC concentrations was noted, primarily influenced by regional/local sources and regional meteorology. A consistent seasonality in BC concentrations was also noted with high BC aerosol loadings during winter, followed by the post-monsoon.
The diurnal variations of BC aerosols were typically bimodal, including two specific peaks, one at morning hours (06:00-08:00 LT) and other at evening hours (22:00-00:00 LT). In both cases, local sources and boundary layer heights were found to influence the BC diurnal variation.
Characteristic seasonal and diurnal responses of BC aerosols to atmospheric boundary layer dynamics were also noted. An inverse relation of BC mass loadings with ABL heights persisted throughout the year, although more prominently for diurnal cycle compared to the seasonal cycle.
The diurnal BC profile was found mainly governed by the ABL height while seasonal variations in BC mass was in function both to source strengths and aerosol long-range transport.
The long-range transport potential of BC aerosols across the IGP was also mapped considering two possible scenarios: days with high BC loading and days with low BC mass. At lower altitudes, air-masses originating from the upper IGP, northern parts of Pakistan, the Indian state of Punjab and Haryana, as well as the western semi-arid region, were found to influence local BC concentrations during high BC loading days. In contrast, winds from central India and marine winds were found to influence local BC concentrations during low-loading days.
The long-term trend in BC mass concentration refers to a statistically significant increasing trend, well consistent with regional rise in potential BC sources.
Relatively high Delta-C values during post-monsoon and winter indicate predominant emissions from biomass burning.