


 nueva página del texto (beta)
 Inglés (pdf)
 Artículo en XML
 Referencias del artículo
 Enviar artículo por email
 Citado por SciELO
  Similares en
SciELO
Similares en
SciELO 
 Permalink
1. Introduction
The Mexico City Metropolitan Zone (MCMZ) is generally accepted as having critical levels of air pollution. In the 1980s, particulates and sulfur dioxide (SO2) were identified as the main atmospheric pollutants, and an effort to reduce emissions was made by changing from fuel oil to natural gas at power plants. This resulted in a reduction in the levels of both target pollutants; however, it was accompanied by an increase in nitrogen oxides (NOx) due to lack of control equipment (Aldana et al., 1999; Bravo et al., 2012).
The air quality monitoring network of the city (which measures particulates, NOx, SO2, CO, and O3) consists of 42 stations and has been operational since 1988. In the case of SO2, this network has been useful in evaluating the effectiveness of the switch from fuel oil to natural gas. Although the concentration of acid rain precursors (SO2 and NOx) has declined in recent decades (Fig. 1) (SIMAT, 2015), acid rain is an outgoing problem in the area (Alarcón et al., 2011).
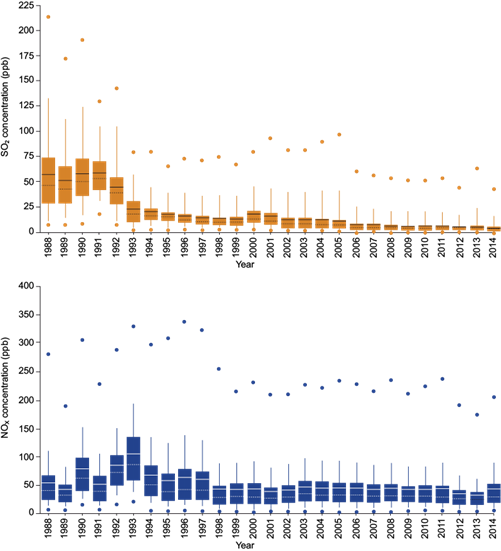
Fig. 1 Annual concentration boxplots of SO2 and NOx from 1988 to 2014 based on hourly concentrations from monitoring stations. The average, minimum, and maximum values are presented for each year, as well as the 10th and 90th percentiles (SIMAT, 2015).
This paper analyzes the temporal and spatial variation of the chemical composition (i.e., pH, electrical conductivity, sodium [Na+], ammonium [NH4 +], potassium [K+], magnesium [Mg2+], calcium [Ca2+], sulfate [SO4 2-], nitrate [NO3 -] and chloride [Cl-]) of wet atmospheric deposition during the period 2003-2014. The objective was to identify areas of greater importance, as well as the trends and behaviors of critical parameters to recommend prevention, minimization, and control strategies.
The Environmental Pollution Section of the Center for Atmospheric Sciences at the National Autonomous University of Mexico (SCA-CCA-UNAM, Spanish acronym) has maintained a program for sampling and analysis of atmospheric deposition in several regions of Mexico (Heckel, 2007; Sosa et al., 2017). Since 2002, the SCA-CCA-UNAM, together with the Atmospheric Monitoring System (SIMAT, Spanish acronym) of Mexico City, has continuously monitored wet deposition in this area.
2. Methodology
2.1 Description of the study area
The MCMZ is located in the southwestern corner of the Mexico basin at an altitude of 2240 masl. The basin’s topographical situation does not allow the free circulation of winds and good ventilation, and it presents diurnal patterns of wind blowing from the northwest and the northeast. The industrial area of the MCMZ comprises more than 30% of the national industry and is located in the northern sector of the study area.
There are important sources of acid rain precursors outside of the MCMZ: (1) the Popocatépetl, an active volcano (Delgado et al., 2001; Grutter et al., 2008) located 80.7 km to the east of the city, and (2) the Tula-Vito-Apasco industrial corridor, a critical zone containing power plants, refineries, and petrochemical and Portland cement industries, among others, located to the north of the study area. For example, the power plant in the industrial corridor utilized fuel oil until 2014, with a sulfur content of 4%, and estimated SO2 emissions of 113 000 t per year. Several options for controlling SO2 emissions have been recommended to the Mexican electric sector, such as scrubbing technologies, fuel oil hydro treating, desulphurization, and alternate fuel sources (Islas and Grande, 2007).
2.2 Location of atmospheric deposition sampling stations
The atmospheric deposition network in Mexico City consists of 16 sampling stations that are spatially distributed as shown in Fig. 2. These sites comply with the USEPA criteria (US-EPA, 1994).

2.3 Sampling and analysis
The sampling and analysis program implemented by the SCA-CCA-UNAM consists of quality assurance and a quality control plans that yield reliable data complying with recommendations from the US-EPA (1994), the National Atmospheric Deposition Program (NADP, 2014), and the Global Atmosphere Watch Precipitation Chemistry Program of the World Meteorological Organization (WMO, 2004). The sampling and analysis program was adopted based on the SCA-CCA-UNAM experience (Bravo et al., 1991, 2003, 2006) and recommendations from institutions, as well as recognized researchers (Krupa, 2002; US-EPA, 1991).
Wet deposition samples were collected weekly using automatic wet/dry deposition collectors (Environmental Tisch Model TE-78-100 and Graseby T-100) during the rainy season in Mexico City (May to November). Each sample was collected into a standard high-density polyethylene bucket, transferred to a polypropylene bottle (Nalgene®), and refrigerated at 4 ºC for preservation (NADP, 2017). Samples were sent to the SCA-CCA-UNAM laboratory for chemical analysis.
Samples greater than 1.0 mm were analyzed. Rain samples were filtered through a 0.22 µm Millipore membrane, and all materials were washed with deionized water before chemical analysis. The pH was measured within 24 h of the arrival to the laboratory using a pH meter (Corning 315, Methrom 827, and Orion 960). SO4 2-, NO3 -, Cl-, Ca2+, Mg2+, K+, NH4 +, and Na+ were analyzed by high performance liquid chromatography (HPLC); anions were analyzed with a Perkin Elmer equipped with an isocratic LC pump 250 and conductivity detector and a Hamilton PRPX-100 analytical anion column; and cations were analyzed with a Waters liquid chromatograph equipped with an isocratic Waters 510 pump and a conductivity detector (Waters 432) using a Waters analytical cationic column. High-purity ion standards were used for calibration. This identification and quantification of ions was based on the US-EPA Method 300.1 (Hautman et al., 1997).
Alkalinity (HCO3 −) was determined using the Gran titration method with pH meters (Stumm and Morgan, 1970). EC was determined with YSI 32 and HORIBA D-424 conductivity instruments.
The detection limits in µeq L-1 were: 2.29, 1.77, 2.26, 2.50, 3.29, 1.79, 2.22, and 1.74 for SO4 2-, NO3 -, Cl-, Ca2+, Mg2+, K+, NH4 +, and Na+, respectively.
The quality of analysis of each sample was checked for ion balance and specific conductance calculations. Additionally, field blanks were analyzed to guarantee the cleanness of the sampling material, and replicates were analyzed routinely to assure appropriate precision and accuracy.
3. Results and discussion
The analysis of wet deposition in Mexico City for 12 consecutive years (2003-2014) at 16 stations resulted in 3867 total samples.
3.1 Spatial distribution of pH, SO 4 2- and NO 3 -
Box plots showing volume weighted means (VWMs) of the annual pH for different areas of the MCMZ (northeast [NE], northwest [NW], downtown [DT], southeast [SE], and southwest [SW]) are presented in Figure 3.
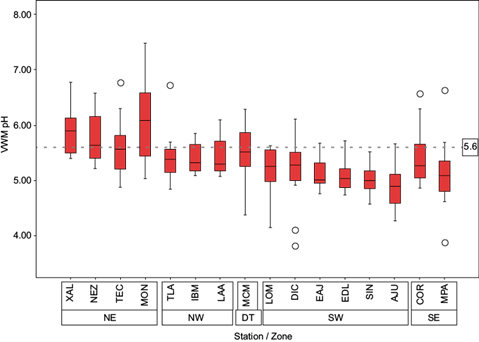
Fig. 3 Volume weighted means of the annual pH for 16 wet atmospheric deposition sampling stations in the MCMZ.
The pH values of collected samples at stations in the south were more acidic than samples collected in the north. This result is in line with meteorological conditions (i.e., prevailing winds blowing from the north to the south), as well as emission sources located in the north sector.
Box plots showing VWMs of the annual SO4 2- and NO3 - concentrations are presented in Figure 4.
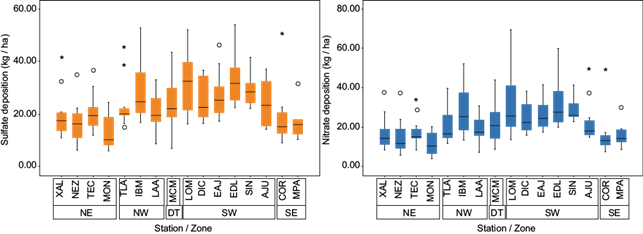
Fig. 4 Box plots showing the wet deposition of SO4 2- and NO3 - (kg ha-1) for 16 stations in the MCMZ.
SO4 2- wet deposition was higher in the southwest, which was likely due to high precipitation in this area. This region also had more acidic pH values.
To visualize the spatial distribution of pH, SO4 2-, and NO3 - levels, maps were made using interpolation of data from each of the 16 sampling stations showing the VWMs of pH, SO4 2-, and NO3 - depositions (Figs. 5, 6 and 7, respectively). To observe the temporal variation of the parameters, maps are presented for the study period 2003-2014.
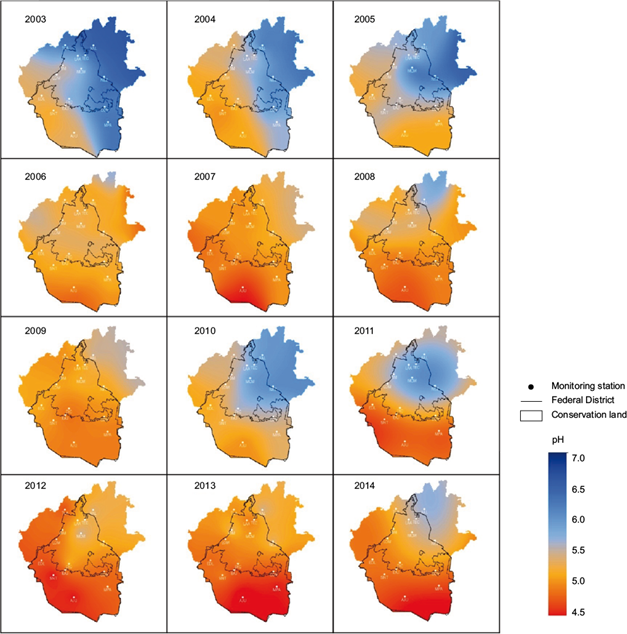
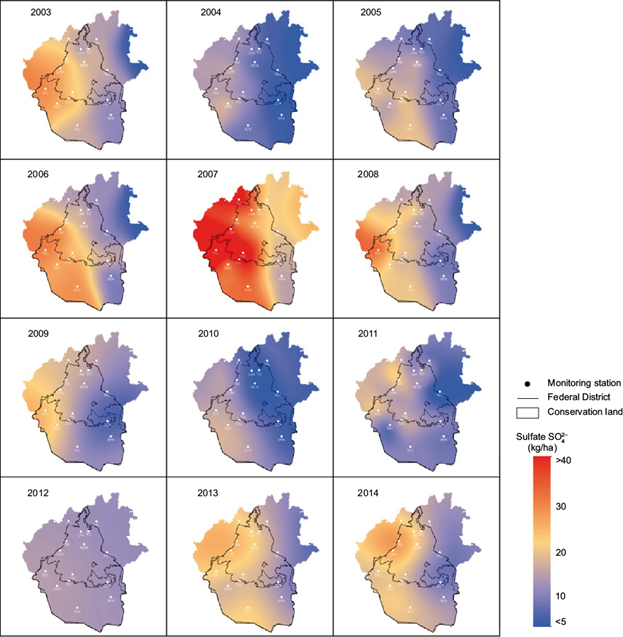

SO4 2- and NO3 - wet deposition in Mexico City ranged from 5-40 kg ha-1 during the study period, with the highest level occurring in 2007. For the last two years (2013 and 2014) the values were 30 and 27 kg ha-1 for SO4 2-, respectively, which are similar to the level registered in the USA (24 kg ha-1); for NO3 -, the values were 22 and 25 kg/ha, comparable to levels in the USA (20 kg ha-1) (NADP, 2018).
The SO4 2-/NO3 - ratio has been used as an indicator of the effectiveness of emission reductions on acid rain precursors in the USA (Lehmann et al., 2015); for this reason, the ratio was applied for Mexico City, resulting in an average of 1.5. This result indicates there is a major contribution of SO4 2- to rain acidification.
3.2 Temporal variation of pH at four representative sampling stations.
To observe the trends of pH from 2003 to 2014 in the MCMZ, four representative stations were selected for further evaluation: Ajusco (AJU), located in the southern area with conservation soil; Montecillos (MON), located in the northeast in a rural area with agricultural activity and high vehicular flow; Xalostoc (XAL), located to the north in an industrial area with high vehicular influence, and Lomas (LOM), located in the southwest in a urban area (i.e., residential and commercial) with high vehicular flow (Fig. 8).
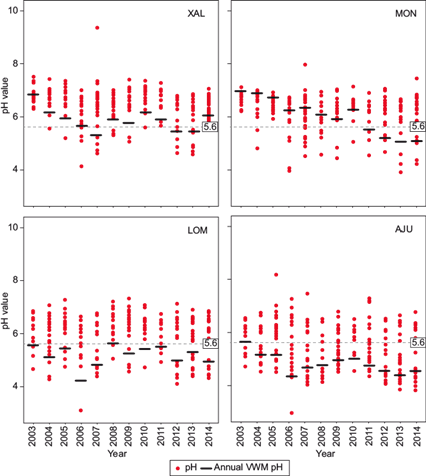
Fig. 8 pH values and volume weighted mean annual pH at four representative stations located in the MCMZ.
At the XAL station, the VWM of pH decreased from 2003 until 2007. Values rise slightly in 2008, 2011, and 2014, and decreased again in 2012 and 2013. At the MON station, pH declined every year from 2003 to 2014 except in 2010; values became acidic in 2011. Values at the LOM station were acidic except during 2003 and 2008; there was a critical VWM value of 4.16 at this station in 2006. At the AJU station, the pH was acidic for all years except 2003, when the average pH was 5.66. The stations located in the south (AJU and LOM) had more acidic pH values, which was likely due to the meteorological conditions in the region (i.e., north winds).
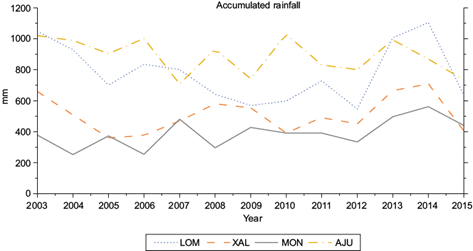
For these samples sites, accumulated rainfall is presented in Figure 9. LOM and AJU presented higher rainfall levels. The LOM sampling site, located in the west of the city, showed the highest level in 2014.
3.3 Ionic composition
Figure 10 shows the relative abundance of major ions determined at the four selected stations.
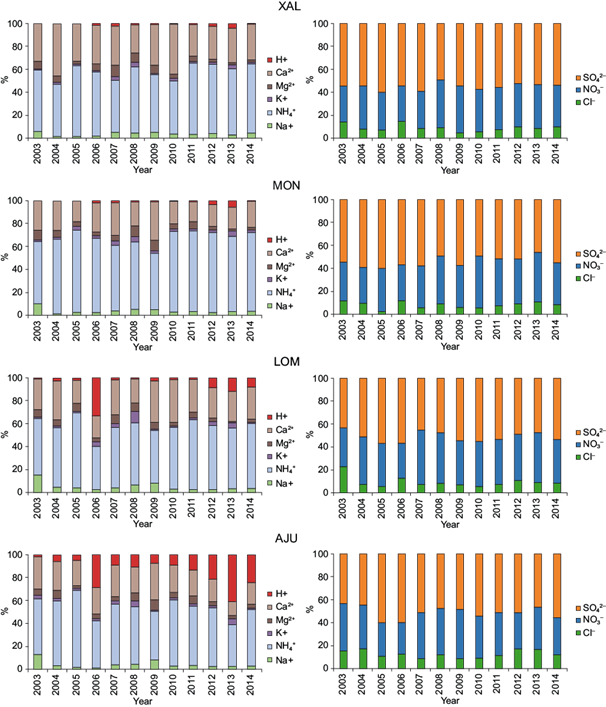
Fig. 10 Annual ion composition (%) for the XAL, MON, LOM, and AJU stations. The major ions from 2003 to 2014 were SO4 2- (50% of anions), NO3 - (40% of anions), NH4 + (60% of cations), and Ca2+ (30% of cations). The XAL and MON stations had the highest SO4 2- contribution (%); both stations are located in the northern section of the study area downwind from the critical zone Tula-Vito-Apasco.
Figure 10 shows that NH4 + is the major cation in all sampling sites, hence the importance of paying attention to NH3 in vehicular emissions all over the city. The proportion of NH4 + was higher in the MON station, likely due to agricultural activity in the area, as well as chemical reactions of NH3 emitted by mobile sources. NH3 emissions have been associated with traffic in different European cities (Elser et al., 2018) and can emanate from vehicles running under rich air to fuel conditions, with three-way catalytic converters designed to reduce NOx (Fraser and Cass, 1998).
A low contribution of NH4 + was observed in samples collected in 2006 and 2013 from the LOM and AJU stations, which is consistent with a high percentage of H+ during those years at both stations. The proportions of H+ and Cl- are greater at AJU compared to other stations.
3.4 Ionic associations
To identify associations between ion concentrations in all the wet deposition samples collected at each station, a linear Spearman correlation was applied to the four chosen stations. Results for the MON station are presented as a representative sample (Table I). Group solutes associated with potential sources are: (1) the acidic group, which is a combination of H+, SO4 2-, and NO3 - primarily resulting from the combustion of fossil fuels; (2) the salt group, which is mainly an association of Na+ and Cl- from sea salt and/or road salt, and (3) the agriculture and soil group, which is a combination of base cations (i.e., Ca2+, Mg2+, and K+) and nitrogenous solutes (i.e., NO3 - and NH4 +) from fertilizers, feed lots, and dust particles (Loÿe-Pilot and Morelli, 1988; Loÿe-Pilot and Martin, 1996; Herut et al., 2000; Praveen et al., 2007).
Table I Spearman correlation for ion concentrations at the MON station.
| H+ | EC | Na+ | NH4 + | K+ | Mg2+ | Ca2+ | Cl- | NO3 - | SO4 2- | |
| H+ | 1.000 | -0.017 | -0.098 | -0.159* | -0.008 | -0.047 | -0.267** | 0.098 | 0.059 | 0.191** |
| EC | 1.000 | 0.195** | 0.732** | 0.392** | 0.380** | 0.702** | 0.487** | 0.768** | 0.770** | |
| Na+ | 1.000 | 0.100 | 0.333** | 0.466** | 0.292** | 0.179* | 0.259** | 0.192** | ||
| NH4 + | 1.000 | 0.322** | 0.152** | 0.540** | 0.498** | 0.661** | 0.648** | |||
| K+ | 1.000 | 0.511** | 0.285** | 0.285** | 0.393** | 0.402** | ||||
| Mg2+ | 1.000 | 0.338** | 0.175* | 0.402** | 0.303** | |||||
| Ca2+ | 1.000 | 0.341** | 0.531** | 0.484** | ||||||
| Cl- | 1.000 | 0.442** | 0.497** | |||||||
| NO3 - | 1.000 | 0.755** | ||||||||
| SO4 2- | 1.000 |
*Correlation is significant at the 0.05 level (2-tailed).
**Correlation is significant at the 0.01 level (2-tailed).
Based on the four representative stations, NH4 + correlates with Cl-, NO3 -, and SO4 2-, with the predominant salts being (NH4)2 SO4 and NH4 NO3. The AJU station had a higher correlation between H+ and Cl-, The MON station had the highest correlation between H+ and SO4 2-, while H+ and NO3 - had the highest correlation at the AJU and LOM stations.
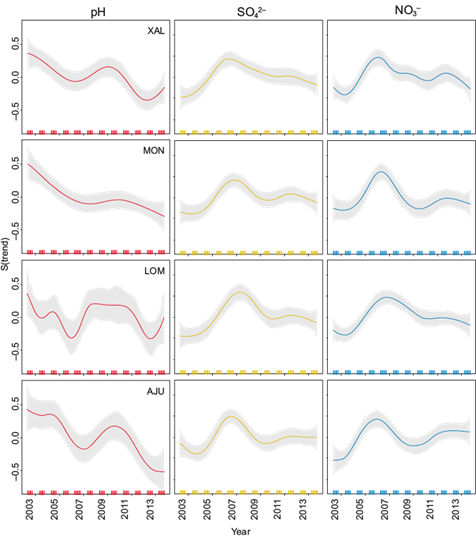
3.5 pH, SO 4 2- and NO 3 - trends
We used a non-linear technique of an additive model to determine temporal variations of the most important parameters for acid rain (i.e., pH, SO4 2-, and NO3 -). A trend analysis for the selected stations (XAL, MON, LOM, and AJU) was used from 2003 to 2014 (Fig. 11). The generalized additive model (GAM) allows smooth trends to be estimated from data using penalized regression splines (Wood, 2006).
The following additive model was fitted to each series:
where y i is the observed deposition; β 0 is the intercept or constant term; f 1 (time i ) is the smooth function of time, which represents the trend in the response and describes the variation through time of level of the response; f 2 (julian i ) represents the seasonal variation of deposition within a year, and ε i is the area of model residuals, which are assumed to be zero mean for Gaussian random variables with variance of σ 2 .
Models were fitted in a GAM framework using the Mixed GAM Computation Vehicle (MGCV) with automatic smoothness estimation v. 1.8-4 (Wood, 2014) for the R statistical software package v. 2.15.2 (R Development Core Team, 2011). A log transformation was applied to deposition variables SO4 2- and NO3 - to achieve constant variance.
The pH decreased at all stations, although for the LOM station the decrease was very light. The other three stations showed significant decreases throughout the study period; pH was lowest at the XAL, MON, and AJU stations in 2007, and SO4 2- and NO3 - concentrations were highest during this year. In the above mentioned stations, the maximum pH occurred in 2010 and corresponded to minimum levels of SO4 2- and NO3 -.
Higher deposition values for SO4 2- and NO3 - were observed in 2007 according to the maps in Figures 6 and 7, respectively, as well as in trends analysis, where the same behavior was also observed. When reviewing possible reasons for this situation, it was interesting to find that emissions from the Popocatépetl volcano presented an increase during 2007 (Carn et al., 2017).
LOM is located in the western part of Mexico City. This station showed a pH pattern similar to the other stations up to 2008; thereafter, the level was constant until the last year of the study when a small increase was recorded. However, there is a slight decrease with respect to the initial year (2003). NO3 - and SO4 2- increased from 2005 to a peak concentration in 2007, followed by a decline until 2011 and a slight increase in subsequent years. In the last year, levels at three stations (XAL, MON, and LOM) declined, while the AJU station, located in the south of the city, remained constant.
4. Conclusions and recommendations
The spatial distribution of VWM pH shows its decrease throughout the study from north to south in Mexico City, influenced by meteorological conditions. In most of the study sites, VWM pH decreased from 2003 to 2014. For example, at the MON station, values decreased from 7.48 in 2003 to 5.03 in 2014.
In the stations located in a rural area (MON and AJU), a strong correlation was found between NH4 + and SO4 2-, NO3 -, and Cl-; this is likely due to their origin in soil (i.e., fertilizer use).
It is recommended to analyze the source of NH4 + in the study area because this is the most abundant cation. It is necessary to consider the chemical reaction of NH3 emitted by mobile sources.
The same concentration trend was observed for SO4 2- and NO3 - in the Mexico City stations, which indicates that the sources of acid rain precursors are upwind (i.e., to the north) of the study area.
The high wet deposition levels for SO4 2- and NO3 - in the MCMZ were similar to levels in the USA (24 and 20 kg ha-1 in 2013 and 2014, respectively).
In all wet deposition samples, SO4 2- comprised a higher percentage (60%) than NO3 - and Cl-, indicating that the main precursor of acid rain is SO4 2-. The SO4 2-/NO3 - observed ratio was of 1.5, confirming SO4 2- as the principal anion of wet atmospheric deposition and SO2 as the principal acid rain precursor.
It is important to establish strategies for emission reduction of acid rain precursors from external sources north of Mexico City, such as the use of fuels with low-sulfur and substitution of fuel oil by natural gas, which could eliminate more than 99% of SO2 emissions.
When shifting from fuel oil to natural gas, it is important to use the best available control technology for NOx, including low NOx burners, due to some negative impacts. These include acid rain and the formation of ozone, which is a severe problem in Mexico City.

