


 nueva página del texto (beta)
 Inglés (pdf)
 Artículo en XML
 Referencias del artículo
 Enviar artículo por email
 Citado por SciELO
  Similares en
SciELO
Similares en
SciELO 
 Permalink
1. Introduction
Particular attention has been given in recent years to precipitation and variations in climate change scenarios by modeling these phenomena at different timescales. Global climate models simulate past and future climate evolution around the world. Their resolution of several hundreds of kilometers is sufficient to simulate the large-scale dynamics of the atmosphere at the planet’s scale and produce average temperature or rainfall projections; however, they are unable to reproduce regional features. In order to study the climate evolution of the Mediterranean basin, it is necessary to use regional climate models (RCM). Since the fourth IPCC report was published in 2007 (IPCC, 2007), regionalized simulations are improving and can refine trends in the Mediterranean basin. The RCMs allow high resolution simulations to assess the impact of climate change at the regional and local scales. In the Euro-Mediterranean region, several projects yielded regional climate model simulation outputs ready for research teams to use. This was the goal of the Prediction of Regional Scenarios and Uncertainties for Defining European Climate Change Risks and Effects (PRUDENCE) project (http://prudence.dmi.dk) concluded in 2004; of the Statistical and Regional Dynamical Downscaling of Extremes for European Regions (STARDEX) project (http://www.cru.uea.ac.uk/projects/stardex/), based on the simulations of PRUDENCE finished in 2005; and of the ENSEMBLE-based Predictions of Climate Changes and their Impacts (ENSEMBLES) project (http://www.ensembles-eu.org/) finalized in 2009. Eventually, the Coordinated Regional Climate Downscaling Experiment (CORDEX) (http://www.medcordex.eu) succeeded the ENSEMBLES project.
The assessment of the impact of climate change on the hydrological variability of the Mediterranean basin using climate models has been widespread in river basins in France (Quintana Seguí et al., 2010), Spain (Majone et al., 2012; Giménez et al. 2016), Italy (Senatore et al., 2011) and across the Mediterranean basin (Sánchez-Gómez et al., 2009; Dubois et al., 2012; Milano et al., 2012, 2013; Hertig and Tramblay, 2016; Paeth et al., 2016; Alemseged and Tom, 2015). However, few studies have been interested in the details in North Africa (Driouech et al., 2010; Tramblay et al., 2012; Bargaoui et al., 2014; Filahi et al., 2017).
Giorgio and Lionello (2008) analyzed rainfall data from the PRUDENCE climate model simulations in different regions of the Mediterranean basin (north, south, east, west, central). Future projections of rainfall for 2100 indicate a reduction of 15% for the wet season (September to May) and 30% in summer. This will affect southern parts of the Mediterranean. Zanis et al. (2008) assessed the simulated rainfall of nine PRUDENCE-RCM outputs for Greece for the 1961-1990 and 2071-2100 periods. The nine RCMs simulate a decrease of future rainfall of about 14% in winter, 57% in summer and 15% for annual rainfall. Coppola and Giorgi (2010) also discussed the simulated rainfall from PRUDENCE-RCM for the 1961-1990 and 2071-2100 periods in Italy. Future projections show a decline of rainfall in summer for the whole country (-40%) while winter rainfall is modelled to increase in the north and decrease in the south.
Tramblay et al. (2012) assessed the performance of the ENSEMBLES regional climate models for past and future annual and extreme rainfall in Morocco. They showed a great variability in the performance of the RCMs to reproduce the seasonal cycle and extreme rainfall of the different stations. Overall, there is a good model convergence towards a decrease in rainfall for the Atlantic stations. For the Mediterranean stations, the projected changes are difficult to assess due to the great variability. In Tunisia, Bargaoui et al. (2014) assessed the outputs of six ENSEMBLES models for the 1961-2000 control period and for two projection periods, 2011-2050 and 2051-2090. They found that, on average, the model outputs underestimate seasonal precipitation by 20%. The discrepancy between model outputs and observations depends on the season. For the future, in summer and autumn the different models do not project major changes in seasonal distributions. However, for winter and spring, all the model simulations show a significant decrease in precipitation for the whole country. In this study, following an analysis of past observed rainfall, in order to establish the actual knowledge of spatial and temporal rainfall variability in the study area, we assess the simulated seasonal rainfall of the ENSEMBLE-RCM outputs in northern Algeria during the 1961-1990 reference period and analyze future simulations of validated models during the two projection periods, 2021-2050 and 2070-2099.
2. Materials and methods
2.1 Study area and data set
Northern Algeria is characterized by a Mediterranean climate in coastal regions and a semi-arid climate in the highland plateaus. Altitudes are higher in the east than in the west, which creates an east-west rainfall gradient. Precipitation in northern Algeria shows a high spatial and temporal variability (Laborde, 1998; Meddi and Hubert, 2003; Meddi and Meddi, 2009; Taibi et al., 2013). The average rainfall varies from 689 mm yr-1 in Annaba (east) to 377 mm yr-1 in Oran (west) during the reference period (Table I).
Table I Statistical characteristics at rain gauges stations during the reference period (1961-1990).
| Stations | Minimum (mm) yr-1 | Maximum (mm) yr-1 | Average (mm) yr-1 | Coefficient of variation |
| Annaba | 320 | 1171 | 689 | 0.29 |
| Algiers | 278 | 1127 | 615 | 0.27 |
| Ténès | 356 | 1112 | 566 | 0.29 |
| Oran | 173 | 633 | 373 | 0.31 |
Many studies have shown a significant decrease in the temporal variability of rainfall in northwest Algeria (Medjerab and Henia, 2005; Meddi and Meddi, 2007; Meddi and Talia, 2007; Meddi and Hubert, 2003; Bekkoussa et al., 2008; Meddi et al., 2010; Taibi and Souag, 2011). This decrease is mostly observed during winter and spring (Taibi et al., 2013).
To assess the ability of regional climate models to reproduce rainfall variability in northern Algeria, rain gauge stations, where daily rainfall time series were lacking the least observations since 1961, were selected (Fig. 1). The four selected stations are representative of three coastal regions of northern Algeria which present different rainfall regimes, as highlighted by Taibi et al. (2017): the eastern region (Annaba station), the central region (Algiers and Tenes stations) and the western region (Oran station).
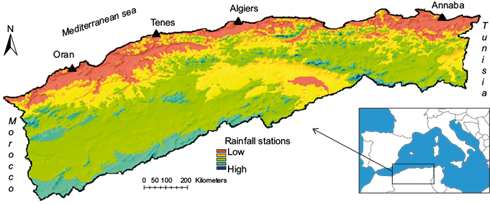
The characteristics of the rainfall stations are presented in Table II. The daily data was obtained from the National Agency of Water Resources (ANRH) and the National Office of Meteorology (ONM).
Table II Geographic characteristics of rainfall stations (decimal degrees).
| Stations | Origin | Longitude | Latitude | Altitude (m) |
| Algiers | ONM | 3.06 E | 36.41 N | 25 |
| Annaba | ONM | 7.49 E | 36.50 N | 3 |
| Oran | ONM | 0.36 W | 35.1 N | 90 |
| Ténès | ANRH | 1.32 E | 36.52 N | 5 |
The ENSEMBLES project includes 12 regional climate models (Table III). The climate models used provide high-resolution data of simulated rainfall for 25 × 25 km square areas for the reference period and for the two projected periods. The simulated rainfall of each model was then updated and compared to observed data from northern Algeria.
Table III Name of regional climate models (RCM), institution, and acronym.
| RCM | Institution | Acronyms |
| HIRAM | Danish Meteorological Institute | DMI |
| RCA | Swedish Meteorological and Hydrological Institute (SMHI) | SMHI |
| HadRM3.0 | UK Met Office, Hadley Centre for Climate Prediction and Research | HC |
| ALADIN | Météo-France | CNRM |
| Czech Hydrometeorological Institute | CHMI | |
| REMO | Max-Planck-Institute for Meteorology | MPI |
| CLM | Swiss Institute of Technology | ETHZ |
| GKSS Forschungszentrum Geesthacht GmbH | GKSS | |
| ReMCG | The Abdus Salam International Centre for Theoretical Physics | ICTP |
| RCA3 | Instituto Nacional de Meteorología | INM |
| PROMES | Universidad de Castilla La Mancha | UCLM |
| CMCR | OURANOS | OURANOS |
2.2 Statistical tests
2.2.1 Pettitt’s test
Pettitt’s test (1979) is used to detect a single abrupt change in a time series with continuous data. In our case it was used to detect a potential rupture in rainfall time series for the four rainfall stations of northern Algeria during the 1961-1990 period. This test formulates two hypotheses: H 0 , according to which the T variables follow one or more distributions that have the same location parameter (no change); and H 1 , when a change-point exists. The non-parametric statistic is defined as:
where
The change-point of the time series is located at K T , provided that the statistic is significant. The significance probability of K T is approximated for p ≤ 0.05 with
Pettitt’s test is one of the most non-parametric tests used to detect a rupture within time series of hydro-climatological data. Several studies have used this test to analyze rainfall variability in northern Algeria (Meddi and Meddi, 2007; Bekkoussa et al., 2008; Meddi et al., 2010; Taibi et al., 2013; etc.).
2.2.2 Bias method
RCM model outputs are evaluated by calculating the difference between simulated (R̅ sim ) and observed (R̅ Obs ) seasonal rainfall using the bias method. Many studies have used this method for the same analysis (Tramblay et al., 2012; Bargaoui et al., 2014; Alemseged et al., 2015; Giménez et al., 2016; Hertig and Tramblay, 2016; Paeth et al., 2016).
3. Results
3.1 Rainfall variability analysis
3.1.1 Seasonal rainfall variability
Monthly temperature and rainfall time series have been used to draw climatograms of each station studied. Climatograms usually represent precipitation (P) on the left vertical axis and temperature (T) on the right. It is also necessary to observe the following rule: the precipitation value is equal to two times the temperature value (P = 2T). Fig. 2 shows a common climatogram of the four stations studied. The climatogram shows a cold/humid period from November to April (P > 2T, as already mentioned by Meddi, 2013), while the warm/dry season lasts from June to September (P < 2T). The months of May and October are the intersection point between P and 2T and can also be considered as transition periods, which can be alternatively warm/dry or cold/humid from one year to another (Khomsi et al., 2012).

The variability of monthly precipitation (Fig. 3) over the reference period (1961-1990) shows that at the four stations winter is the rainiest season, having 40% of the annual rainfall (Table IV), while autumn and spring have between 25% and 30% (Table IV). It appears that 95% of the annual rainfall is observed during autumn, winter and spring. In winter, rainfall in Oran (150 mm) is 40% less than rainfall in Annaba and Algiers (more than 250 mm) (Fig. 3). This difference may be explained by topography, since altitudes are higher in the northeast than in the west. Many studies have shown the importance of the spatial variability of rainfall from east to west (Laborde, 1998; Meddi and Hubert, 2003; Meddi and Meddi, 2009; Taibi et al., 2013). The Algerian mountains are the prolongation of the Atlas Mountains in Morocco, and the whole mountain range, stretching from the southwest to the northeast of the Maghreb, dramatically reduces rainfall coming from the Atlantic towards eastern Algeria. The slopes of the northeastern region of Algeria are generally well exposed to rains coming from Europe (Taibi et al., 2017). On the other hand, the droughts that Algeria has experienced since 1975 have significantly affected the rainfall variability in western Algeria, while the east shows a stable rainfall distribution (Bekoussa, 2008; Meddi et al., 2010; Taibi et al., 2017).

Table IV Percentage of seasonal rainfall with respect to annual rainfall.
| Stations | SON | DJF | MAM | JJA |
| Annaba | 28 | 43 | 25 | 4 |
| Algiers | 30 | 40 | 26 | 4 |
| Tenes | 29 | 38 | 30 | 3 |
| Oran | 24 | 41 | 32 | 3 |
To analyze the temporal variability of seasonal rainfall, rupture tests have been applied to rainfall time series. For the Tenes and Oran stations, a reduction of rainfall of about 43% in winter and 38% in spring are observed (Table V). The rupture date is 1972 for Tenes and 1976 for Oran.
Table V Seasonal rainfall trend regarding Pettitt’s test (stationary stations are not included).
| Stations | Pettitt | Mean before (mm 3-month-1) | Mean after (mm 3-month-1) | Difference (%) |
| Tenes | ||||
| SON | ||||
| DJF | 1972 | 294 | 166 | -43 |
| MAM | ||||
| JJA | ||||
| Oran | ||||
| SON | ||||
| DJF | ||||
| MAM | 1976 | 149 | 92 | -39 |
| JJA | ||||
The results of Pettitt’s test highlight a decrease in rainfall during the wet season, particularly in December, January, March, and April in the Oran and Tenes stations (Table VI). Even if the rupture appears only in winter in Tenes (Table V), the month of April shows a significant reduction in rainfall of about 40% (Table VI). For the Oran station, although the main decrease takes place during spring, rainfall also significantly decreases in December by about 32%. On the contrary, in the east of the country, in Annaba, an increase of rainfall of more than 100% is observed for November and 80% for March during the 1961-1990 reference period.
Table VI Monthly rainfall trend regarding Pettitt’s test (stationary stations are not included).
| Tests | Sept | Oct | Nov | Dec | Jan | Feb | Mar | Apr | May |
| Annaba | |||||||||
| Pettit | 1974 | 1970 | |||||||
| Mean before (mm month-1) | 44 | 43 | |||||||
| Mean after (mm month-1) | 101 | 78 | |||||||
| Difference (%) | 103 | 80 | |||||||
| Oran | |||||||||
| Pettit | 1976 | 1976 | 1976 | ||||||
| Mean before (mm month-1) | 73 | 55 | 55 | ||||||
| Mean after (mm month-1) | 49 | 30 | 31 | ||||||
| Difference (%) | -32 | -45 | -44 | ||||||
| Tenes | |||||||||
| Pettit | 1972 | 1972 | 1972 | ||||||
| Mean before (mm month-1) | 122 | 101 | 72 | ||||||
| Mean after (mm month-1) | 69 | 58 | 44 | ||||||
| Difference (%) | -43 | -43 | -40 | ||||||
3.1.2 Daily rainfall variability
To better understand the monthly rainfall variability, we analyzed the evolution of the number of wet days. Taibi et al. (2017) analyzed the frequency trend of wet days for different percentiles, and rainfall classes during the 1940-2010 period for the same stations as those used in this study. The results showed a negative but not significant trend in Algiers and Oran, and a positive but not significant trend in Annaba. Only the Tenes station showed a significant decrease in the number of rainy days.
In this work we analyze the evolution of the frequency of rainy days for five rainfall classes for each month during the study period (1961-1990). The selected interval of rainfall classes are 1-5, 5-10, 10-20, 20-50 and > 50 mm. These classes were used in the last studies by Taibi et al. (2017).
Pettitt’s statistical test applied for each rainfall class and month shows an increase in the number of wet days in Annaba (Table VII) during November, March and April, which is well correlated with the rupture date for the monthly rainfall time series. The increase of the number of wet days is observed for the rainfall classes of 5-10, 10-20, and 20-50 mm day-1 in November, 5-10 and 10-20 mm day-1 in March, and only for the rainfall class of 5-10 mm day-1 in April (Table VII).
Table VII Trend of wet days frequency in Annaba for each month.
| Rainfall interval (mm day-1) | Test | Oct | Nov | Dec | Jan | Feb | Mar | Apr | May | Total |
| 1 < R < 5 | - | - | - | - | - | - | - | |||
| 5 < R< 10 | Pettitt | - | 1974 | - | - | - | 1970 | 1975 | - | 1970 |
| Mean before | - | 1.154 | - | - | - | 1.444 | 1.267 | - | 14.2 | |
| Mean after | - | 3.176 | - | - | - | 3.048 | 2.6 | - | 20.45 | |
| Difference (%) | - | 175 | - | - | - | 111 | 105 | - | 44 | |
| 10 < R < 20 | Pettitt | - | 1974 | - | - | - | 1970 | - | - | 1974 |
| Mean before | - | 1.1 | - | - | - | 1.3 | - | - | 12.47 | |
| Mean after | - | 2.0 | - | - | - | 2.2 | - | - | 17.08 | |
| Difference (%) | - | 87 | - | - | - | 70 | - | - | 37 | |
| 20 < R < 50 | Pettitt | - | 1974 | - | - | - | - | - | - | - |
| Mean before | - | 0.133 | - | - | - | - | - | - | - | |
| Mean after | - | 1 | - | - | - | - | - | - | - | |
| Difference (%) | - | 652 | - | - | - | - | - | - | - | |
| R > 50 | - | - | - | - | - | - | - | - | - | - |
In Algiers, the number of annual wet days has decreased by 30% since 1974 for the rainfall class >50 mm month-1, but this change does not appear in any month, most probably because of the low number of wet days for this rainfall interval (Table VIII).
Table VIII Trend of the frequency of wet days for each month in Algiers.
| Rainfall interval (mm day-1) | Test | - | Nov | Dec | Jan | Feb | Mar | Apr | May | Total |
| 1< R< 5 | - | - | - | - | - | - | - | - | - | - |
| 5 < R < 10 | - | - | - | - | - | - | - | - | - | - |
| 10 < R < 20 | - | - | - | - | - | - | - | - | - | - |
| 20 < R < 50 | - | - | - | - | - | - | - | - | - | - |
| R > 50 | Pettitt | - | - | - | - | - | - | - | - | 1974 |
| Mean before | - | - | - | - | - | - | - | - | 1.357 | |
| Mean after | - | - | - | - | - | - | - | - | 0.375 | |
| Difference % | - | - | - | - | - | - | - | - | -30 |
In Tenes there is a decrease in the number of wet days for most of the rainfall classes. The decrease of the number of wet days in December since 1973 for the 1-5 mm day-1 class is 58%. There is no change for the 5-10 mm rainfall class. The decrease of the number of wet days since 1973 for the 10-20 mm day-1 rainfall class is 41% without any change for individual months. For the 20-50 mm day-1 class, a decrease of the number of wet days is observed in April since 1978, but there is no change for the annual time series and finally, for rainfall > 50 mm day-1, the decrease of the number of wet days in January since 1974 is of 100% and -76% in the annual time scale (Table IX).
Table IX Trend of the frequency of wet days for each month at Tenes.
| Rainfall interval (mm day-1) | Tests | Oct | Nov | Dec | Jan | Feb | Mar | Apr | May | Total |
| 1 < R < 5 | Pettitt | - | - | 1973 | - | - | - | - | - | 1973 |
| Mean before | - | - | 3.6 | - | - | - | - | - | 22.15 | |
| Mean after | - | - | 1.5 | - | - | - | - | - | 16 | |
| Difference (%) | - | - | -58 | - | - | - | - | - | -28 | |
| 5 < R < 10 | - | - | - | - | - | - | - | - | - | - |
| 10 < R < 20 | Pettitt | - | - | - | - | - | - | - | - | 1973 |
| Mean before | - | - | - | - | - | - | - | - | 12.23 | |
| Mean after | - | - | - | - | - | - | - | - | 7.24 | |
| Difference (%) | - | - | - | - | - | - | - | - | -41 | |
| 20 < R < 50 | Pettitt | - | - | - | - | - | - | 1978 | - | - |
| Mean before | - | - | - | - | - | - | 1.056 | - | - | |
| Mean after | - | - | - | - | - | - | 0.167 | - | - | |
| Difference (%) | - | - | - | - | - | - | -84 | - | - | |
| R > 50 | Pettitt | - | - | - | 1974 | - | - | - | - | 1974 |
| Mean before | - | - | - | 0.385 | - | - | - | - | 1.833 | |
| Mean after | - | - | - | 0.001 | - | - | - | - | 0.44 | |
| Difference (%) | - | - | - | -100 | - | - | - | - | -76 |
In Oran, a decrease in the number of wet days is observed for the 10-20 mm day-1 class during December, March and April along with a decrease in the total number of wet days for the 20-50 mm day-1 class (Table X).
Table X Trend of the frequency of wet days for each month at Oran.
| Rainfall interval (mm day-1) | Tests | Oct. | Nov. | Dec. | Jan. | Feb. | Mar. | Apr. | May | Total |
| 1 < R < 5 | - | - | - | - | - | - | - | - | - | - |
| 5 < R < 10 | - | - | - | - | - | - | - | - | - | - |
| 10 < R < 20 | Pettitt | - | - | 1976 | - | - | 1976 | 1979 | - | 1976 |
| Mean before | - | - | 1.6 | - | - | 1.533 | 1.3 | - | 8.8 | |
| Mean after | - | - | 0.9 | - | - | 0.667 | 0.4 | - | 6.1 | |
| Difference (%) | - | - | -45 | - | - | -56 | -71 | - | -30 | |
| 20 < R < 50 | Pettitt | - | - | - | - | - | - | - | - | 1976 |
| Mean before | - | - | - | - | - | - | - | - | 4.00 | |
| Mean after | - | - | - | - | - | - | - | - | 2.60 | |
| Difference (%) | - | - | - | - | - | - | - | - | -35 | |
| R > 50 | - | - | - | - | - | - | - | - | - |
Overall, two of the rainfall classes (10-20 and 20-50 mm day-1) experienced a significant change in temporal variability in the number of wet days at the Oran, Tenes, and Annaba stations.
3.1.3 Relation between rainfall variability and atmospheric pressure
To understand the effect of atmospheric circulation on rainfall in northern Algeria, we analyzed the variability of sea level pressure (SLP) near Oran and Annaba. Data of SLP have been extracted from the site of the National Center for Atmospheric Research (https://climatedataguide.ucar.edu/climate-data/ncar-sea-level-pressure). A standardized SLP index was computed over the study period and represented in the Fig. 4.
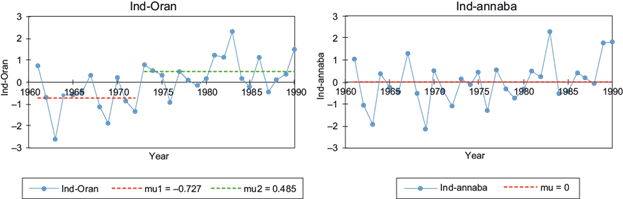
The Oran station is located at the western limit of the Mediterranean basin and is therefore influenced by Atlantic variations and the Azores anticyclones, which generally induce calm and dry weather (Taibi et al., 2017). The Annaba station is located in a transition zone between the western and eastern sides of the Mediterranean basin, influenced by ENSO and the Asian monsoon (Rodwell and Hoskins, 1996; Rodo et al., 1997; Price et al., 1998; Reale et al., 2001).
Pettitt’s test shows a positive trend of SLP in Oran since 1973 (Fig. 4). The positive phase corresponds to higher atmospheric pressure affected by the Azores anticyclone, associated with dry weather and low rainfall variability over the Mediterranean basin. Thus it appears that pressure variability over the western region has affected rainfall variability by decreasing rainfall since the 1970s.
In the eastern region, SLP variability near Annaba does not significantly change (Fig. 4), in correlation with no significant change in rainfall variability for the Annaba time series during the reference period (1961-1990).
To explain rainfall variability in the Mediterranean basin, several authors have tried to find links with the general atmospheric circulation. Numerous studies have highlighted the influence of the North Atlantic Oscillation (NAO) and the Mediterranean Oscillation (MO) on the variability of precipitation, especially in winter (Maheras et al., 1999; Xoplaki et al., 2004; Dünkeloh and Jacobeit, 2003; López and Frances, 2010; Brandimarte et al., 2011). Taibi et al. (2017) found that seasonal rainfall in northern Algeria is significantly correlated to the NAO and MO indices, while stations located in the eastern region of northern Algeria do not show significant correlations with the NAO, MO and SOI climate indices, which confirms the results observed on the variability of SLP at the Oran and Annaba stations.
3.2 Evaluation of the ENSEMBLES-RCM output rainfall
The comparison of the observed and simulated rainfall of 12 RCMs during the 1961-1990 reference period shows an underestimation/overestimation of rainfall in the wet season/dry season (summer) (Fig.5). The same results are observed in other studies in the Mediterranean basin (Zanis et al., 2008; Coppola and Giorgi, 2010; Bargaoui et al., 2014; Ceglar et al., 2014).
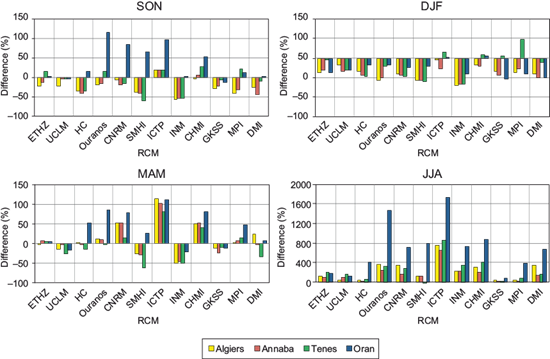
Fig. 5 Difference between simulated and observed seasonal rainfall during the reference period 1961-1990.
In autumn (SON), most of the RCMs underestimate the rainfall at all stations. The ICTP is the only model that overestimates rainfall in all stations, reaching 100% in Oran. Rainfall at the Oran station is also greatly overestimated by the OURANOS, CNRM, SMHI, and CHMI models with a bias that exceeds 50%. The ETHZ, UCLM, CNRM, CHMI, GKSS, and DMI models exhibit a bias below 30% for most stations in autumn. For each station, three RCMs were selected with the lower bias, i.e., theoretically the most efficient future rainfall simulation at each station. These are CHMI, CNRM and ICTP for the Algiers station; UCLM, CHMI and ETHZ for the Annaba station; and UCLM, GKSS and DMI for Tenes. The ETHZ, UCLM, and DMI models give simulation results for rainfall that are very close to the observed rainfall in Oran with a bias that does not exceed 2%.
In winter (DJF), the majority of the RCMs tend to underestimate precipitation. The OURANOS, SMHI, INM, and DMI models strongly underestimate rainfall for the majority of stations with a bias that exceeds 50%. The ICTP, CHMI and UCLM models better simulate the winter precipitation at the Algiers station. At Annaba, the CHMI, ICTP and MPI models are the least biased. The ETHZ, GKSS and CHMI models better simulate observed precipitation at Tenes, with a bias less than 10%. The ICTP, CHMI, and OURANOS models are the least biased at Oran.
In spring (MAM), the ICTP, CNRM, CHMI, and OURANOS models overestimate precipitations, especially the ICTP model characterized by a bias that generally exceeds 100%. The rainfall simulated by the ETHZ, UCLM, HC, GKSS, OURANOS, and MPI models simulate rainfall with biases that do not exceed 20% for most stations. The ETHZ model accurately simulates spring rainfall along the Algerian coast.
In summer, the biases are very high. The majority of models greatly overestimate rainfall, although some of them perform well during other seasons (CNRM, ETHZ, and CHMI). The GKSS is the only model with low bias values for the summer season.
Table XI summarizes the most efficient models for each season and station. Models perform differently at the same station during different seasons, and they differ from one station to another during the same season. CHMI is the most efficient model in winter and spring for all stations (except Tenes in autumn). It is therefore difficult to choose a single model that can reproduce simultaneously the spatial and temporal rainfall variability of the Algerian coast.
Table XI Efficient RCMs for each season and stations.
| Season | Autumn (SON) | Winter (DJF) | Spring (MAM) | Summer (JJA) |
| Algiers | CHMI-CNRM-ICTP | ICTP-CHMI-UCLM | ETHZ-HC-MPI | UCLM-HC-GKSS |
| Annaba | CHMI-UCLM-ETHZ | ICTP-CHMI-MPI | UCLM-HC-DMI | GKSS-HC-MPI |
| Tenes | UCLM-GKSS-DMI | ETHZ-CHMI-GKSS | ETHZ-OURANOS-GKSS | HC-GKSS-SMHI |
| Oran | CHMI-CNRM-ETHZ | ICTP-CHMI-OURANOS | ETHZ-GKSS-DMI | GKSS |
3.3 Future evolution of seasonal rainfall
Seasonal rainfall outputs of ENSEMBLES-RCM were analyzed during two projection periods, 2021-2050 and 2070-2099. The CNRM and ETHZ were the only models that efficiently simulated data during these two periods. Simulated data of the GKSS model were only available for the 2021-2050 the period.
The simulated seasonal rainfall of both projection periods was compared to simulated rainfall for the 1961-1990 reference period. The change in rainfall amounts is presented in Figure 6. The Kolmogorov-Smirnov (KS) test has been used to assess significant changes in projected seasonal rainfall. It is a non-parametric test that compares the cumulative distributions of two datasets. The KS test reports the maximum difference between the two cumulative distributions, and calculates a p-value. The null hypothesis is that both samples are from the same continuous distribution, and the p-value is superior to the significant level of 5%. The alternative hypothesis is that both samples are from different continuous distributions and the p-value is inferior to the significant level. Results of a significant change of projected rainfall are presented in Figure 7. Overall, it appears that winter and spring show a significant reduction in rainfall (Fig. 7). In summer and autumn, some models project an increase in rainfall while others simulate a decrease, but this has little impact on the total annual rainfall because of the low amount of rainfall during this season (Fig. 6).
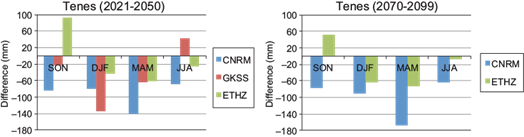
Fig. 6 Seasonal precipitation change between the two projected periods, 2021-2050 and 2070-2099, and the reference period 1961-1990.
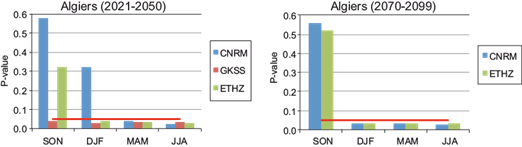
Fig. 7 Variation of p-value according to the Kolmogorov-Smirnov test (significance level of 0.05 is represented by a red line).
In autumn, the GKSS and CNRM models simulate a decrease in rainfall over the 2021-2050 period (Fig. 6) which is more significant in Algiers (GKSS), Oran (GKSS and CNRM) and Tenes (CNRM), while the ETHZ model indicates an increase in precipitation thet is more significant in the Annaba, Oran and Tenes stations (Fig. 7). In winter, all the models simulate a significant decrease in precipitation for all stations (Fig. 7). The precipitation change ranges form 50 to 120mm (Fig. 6). However, the decrease trend simulated by the ETHZ and GKSS models in Oran is not significant (Fig. 7) and is equal to 8 and 14 mm, respectively.
In spring, all models simulate a significant reduction of rainfall (Fig. 7) except the GKSS, which simulates an increase in rainfall of about 50 mm in Annaba. The variation in rainfall is between 40 and 140 mm (Fig. 6).
In summer, significant reductions in rainfall are simulated in Algiers, Oran and Tenes by the ETHZ and CNRM models, while the GKSS model simulates a significant increase in rainfall in Algiers, Oran and Tenes.
During the projected period (2070-2099) simulations follow the same trend as in the 2021-2050 period. In winter and spring the reduction of precipitation is even more important over the 2021-2050 period. In autumn, the decrease is usually greater, and increased rainfall simulated by the ETHZ model is less important than in the 2021-2050 period.
In summer the simulations vary between models and stations. The reduction or increase in rainfall during the 2070-2099 period may be more or less important than in the 2021-2050 period.
4. Discussion
The analysis of rainfall variability during the reference period (1961-1990) shows a negative trend in the west and a positive trend in the east of northern Algeria. Taïbi et al. (2013) analyzed more than 100 rainfall series over northern Algeria and demonstrated a significant decrease of annual rainfall in northwestern Algeria since the 1970s and 1980s, while rainfall variability in the eastern region did not change. Other studies also showed a decrease in rainfall in northwest Algeria (Meddi and Hubert, 2003; Medjerab et Henia, 2005; Meddi and Meddi, 2007; Meddi and Talia, 2007; Bekkoussa et al., 2008; Meddi et al., 2010; Taibi and Souag, 2011) and other regions of the Mediterranean basin such as Spain (De Luis et al., 2000; Sinoga et al., 2011), Italy (Longobardi et Villani, 2009; Caloiero et al., 2011), Greece (Xoplaki et al., 2000; Feidas et al., 2007) Morocco (Benassi, 2001; Singla et al., 2010) and Tunisia (Kingumbi et al., 2005).
Several studies correlate rainfall variability in the Mediterranean basin with the influence of general atmospheric circulation (van Oldenborgh et al., 2000; Lloyd-Hughes and Saunders, 2002; Knippertz et al., 2003; Xoplaki et al., 2004; López and Frances, 2010; Brandimarte et al., 2011). Meddi et al. (2010) and Taibi et al. (2017) highlighted a relationship between El Niño Southern Oscillation (ENSO) and annual rainfall variability over northwestern Algeria.
At the seasonal scale, a statistical test also shows a decrease in rainfall in western Algeria (Tenes and Oran) while the Annaba station located to the east of the study area recorded an increase in monthly rainfall during the study period. These results reflect the opposite effect of atmospheric circulation on rainfall over the two sides of the Algerian coastline. Indeed, some studies highlighted the influence of general atmospheric circulation on winter rainfall over the Mediterranean basin, particularly the influence of the North Atlantic Oscillation and the Mediterranean oscillation (Dünkeloh and Jacobeit, 2003; Xoplaki et al., 2004; López and Frances, 2010; Brandimarte et al., 2011). Taibi et al. (2017) found a significant relation between monthly rainfall in northwestern Algeria and the Mediterranean Oscillation.
Rainfall variability in northern Algeria is correlated to a variation in the number of wet days ranging from 10 to 50 mm, leading to a negative/positive rainfall trend in the west/east since the 1970s, whereas the frequency of R > 50 mm has decreased in Tenes and Algiers since 1974. Taibi et al. (2017) also found a relationship between the evolution of the number of wet days over time and two atmospheric circulation indexes, the ENSO and the Mediterranean Oscillation. The SLP evolution at the opposite east and west extremities of northern Algeria show a relationship between pressure and rainfall variability, most probably through the effect of the Azores anticyclone, which diminishes rainfall in the western region of Algeria. The increase of monthly rainfall and the number of wet days observed in November and March at the Annaba station may be explained by a strong anomaly of pressure around the region such as the low pressures that prevail in the Gulf of Genoa.
The comparison between observed and simulated rainfall of 12 RCMs during the 1961-1990 reference period shows an underestimation of rainfall in the wet season and an overestimation of rainfall in the summer dry season. The same results are observed in other studies of the Mediterranean basin (Zanis et al., 2008; Coppola et Giorgi, 2010; Bargaoui et al., 2014; Ceglar et al., 2014; Alemseged and Tom, 2015). Climate change projections are subject to uncertainty arising from climate model deficiencies, unknown initial conditions and scenario assumptions. Paeth et al. (2016) showed that future precipitation variability in the Mediterranean basin is almost completely attributable to the uncertainty and internal variability of the model, both being equally important. Giménez et al. (2016) evaluated the performance of two new approaches based on the reliability ensemble averaging (REA) method for producing RCM ensembles of monthly precipitation in Spain. The proposed methodologies are based on probability density functions (PDFs) considering the variability of different levels of information on one hand, and of annual and seasonal rainfall and of monthly rainfall on the other hand.
Three models have been validated over the 1961-1990 reference period. Seasonal rainfall variability simulated by the CNRM, ETHZ, and GKSS models show a negative trend over two projected periods, 2021-2050 and 2070-2099, which is more important during winter and spring. These results are similar to some studies on the Mediterranean basin (Zanis et al., 2008; Giorgi and Coppola, 2010; Ceglar et al., 2014) that show a reduction of future seasonal rainfall in winter and summer. Furthermore, Hertig and Tramblay (2016) highlighted an increase in drought severity and occurrence for the whole Mediterranean region over the 2070-2100 period.
5. Conclusions
The aim of this study is to analyze the past and future evolution of seasonal rainfall variability in northern Algeria. The analysis of monthly rainfall variability during the 1961-1990 reference period revealed a significant decrease in rainfall since the 1970s at the Tenes and Oran stations, located in northwest Algeria, which occurs during winter (December and January) and spring (March and April) associated to a decrease in the frequency of wet days in the 10-20 and 20-50 mm day-1 rainfall classes. The eastern region recorded an increase in rainfall. This study has shown the influence of pressure on rainfall variability. The Azores anticyclone strongly influences rainfall in the western region of Algeria. The topography also plays an important role in the spatial distribution of precipitation in northern Algeria.
The assessment of the ENSEMBLES model outputs for rainfall in northern Algeria by comparing the simulated rainfall of 12 RCMs and the observed data during the reference period showed that the majority of models tend to underestimate/overestimate rainfall during the wet/dry period, which affects the distribution of wet days between both periods. The models simulate rainfall differently from one season to another and from one station to another.
To deepen this study, investigations should be conducted particularly to explain the underestimation of models. Some factors must be considered such as the density of the observation network, hence requiring more stations for a better inter-comparison of the models at the scale of the study area. The analysis of projected rainfall by three models, CNRM, ETHZ and GKSS, over the periods 2021-2050 and 2070-2099, allows to compare various models for the same stations (temporal variability), as well as projections simulated by a model from one station to another (spatial variability). Models simulate a significant decline in rainfall during winter and spring for 2050, which worsens in 2099. In autumn, the ETHZ model simulates an increase in precipitation at all stations, while the CNRM and GKSS models simulate a decrease. In summer, the GKSS model simulates an increase in rainfall for all stations and the CNRM and ETHZ models indicate a decrease in precipitation. These conflicting results prevent us from reaching a definitive conclusion from model predictions for the studied areas.
It is important to consider the uncertainties affecting the results of this study, which relate to the RCMs and parameterization, and also to the quality of observed data and the uncertainties due to station location on the RCM grids.

