


 nueva página del texto (beta)
 Inglés (pdf)
 Artículo en XML
 Referencias del artículo
 Enviar artículo por email
 Citado por SciELO
  Similares en
SciELO
Similares en
SciELO 
 Permalink
1. Introduction
A great number of urban centers are located close to the coastal zones, thus it is necessary to determine how safe these areas are both for the population and tourists. For this reason, it is crucial to know the detailed processes of ocean-atmospheric interaction in such zones. Sea breeze is one of these phenomena that are present in coastal zones, and it has great importance. Sea breeze circulation is a well-known mesoscale system, boosted by the properties of reception and storage of thermal energy between land and sea. It is caused by the pressure gradient generated between land and sea, originated by the uneven warming of these two environments as a result of different caloric capacities. The temperature difference between the two surfaces generates a local horizontal pressure gradient that pushes winds of high pressure zones into low pressure zones, creating a sea breeze towards the land during the day, and a breeze from land to sea during the night (Simpson, 1994, 1995). The strength, intensity, and direction of a sea breeze can be modified through different ways due to the local orography. When the sea breeze starts blowing, it moves towards the inner land perpendicular to the shore; therefore, if the coast is straight, a uniform sea breeze is generally expected. Diverse studies have been carried out focused on providing a general vision about sea breeze theories; for example, it was determined that sea breeze in Australia could reach great distances inland, showing influence in stations located 290 km away from the coast (Clarke, 1955). Its interaction with coastal waters has also been studied (Pielke, 1981; Woodson et al., 2007), finding that the day cycle of sea breeze in the Monterrey Bay, California, is responsible for local upwelling, driving Ekman transport outwards to the sea during the day. Other studies (Masselink and Pattiaaratchi, 1998) demonstrate that during the marine breeze cycle, the wind, has a maximum speed of 12 m s-1, causing considerable changes in hydrodynamics close to the coast, as well as its morphology, making an impact on the increase of wave energy and therefore in currents close to the coast, which increase from 0.05 to 1 m s-1 and at the same time lead to an increase of 10 times the concentration of suspension sediments, and 100 times in sediment transport rates.
Research has also been conducted on the effect of sea breeze on dispersion of contaminants, showing that the movement of released contaminants at ground level can be restricted by sea breeze and that if the contaminant is released over the sea breeze cell, there can be low dispersion or it can be mixed with the surrounding air (Reible et al., 1993). A study performed in Athens (Greece), which is surrounded by high mountains, showed how important the sea breeze cycle is for the transportation of contaminants towards the inner land during the day (Helmis et al., 1987).
In Colombia, research about the characterization and understanding of the sea breeze and its interaction with coastal dynamics has been insufficient. Verhagen and Savov (1999) carried out an analytic study of the sea breeze in Cartagena de Indias, demonstrating that in days of relative calm, the local sea climate is influenced by the effect of the sea breeze. Maza and Voulgaris (2011) performed an analysis of daily currents induced by sea breeze in the internal continental platform of Cartagena de Indias, finding that, during the dry season, undersea circulation along the platform is mainly driven by the wind; while, during the rainy season, the pressure gradient seems to be the main force. In addition, a strong day oscillation, 24 h was found, presumably forced by the sea breeze.
Given that there are few studies on this topic, it is necessary to know the marine breeze phenomenon in the main cities of the Colombian Caribbean with more detail, consequently emphasis was made on the cities of Riohacha, Santa Marta, and Barranquilla. This knowledge will not only provide substantial support for identifying and determining the patterns and characteristics of the sea breeze cycle in the studied zone, but will also enable the establishment of a base knowledge to determine its influence in the coastal dynamics and in the transportation of contaminants, among others.
2. Description of the study area
2.1 General aspects
The Colombian Caribbean (Fig. 1) is located at the north of South America. It has a shore line of 1642 km, an approximate land area of 194 513 km2, and occupies 11% of the country´s surface (INVEMAR, 2005). The Colombian Caribbean´s landscape is variable; the peninsula of La Guajira has a flat landscape on the northeast, very close to the sea level, which includes some desert areas. The city of Riohacha and the carbon harbor of Puerto Bolivar are highlighted here; there is also a mountain zone where the Sierra Nevada de Santa Marta is located, which is the highest coastal mountain in the world (5775 masl) at a distance of 42 km from the coast (Sarmiento et al., 2013). The touristic city of Santa Marta and one of the main harbors of mineral carbon loading of Colombia are found in this area. The Tayrona National Natural Park, where indigenous communities and reservations are located, is also found in this area. Figure 1 also highlights the location of the two most important commercial harbors of the zone, situated in the central region of the Colombian Caribbean littoral (a semi-dry area with small elevations) within the cities of Barranquilla and Cartagena. The Darien mountain range is located towards the southeast, close to the border with Panama, which has high humidity and tropical rainforest vegetation (INVEMAR, 2005).

Fig. 1 The Colombian Caribbean region. Black squares indicate the cities included in this study (modified from Restrepo et al., 2014).
2.2 Climate
The climate of Colombia is influenced by the migration of the Intertropical Convergence Zone (ITCZ), which is a zonal band of convection where northereasterly and southeasterly winds (denominated trade winds) converge. The ITCZ (Fig. 2) is located south of the equator in the period December-February, and in mid-March it moves northward (Poveda and Mesa, 1998). Its movement determines the rainy seasons in Colombia.
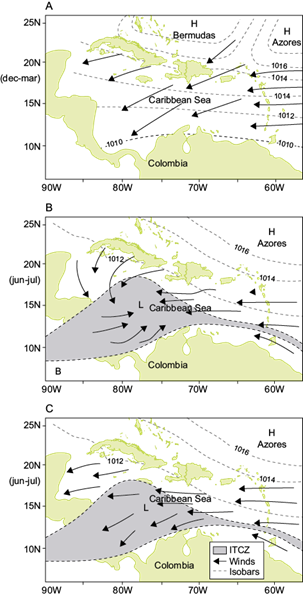
Fig. 2 Variations of the ITCZ: (a) dry season (December-March), (b) intermediate season (June-July), and (c) rainy season (August-November) (modified from Pujos et al., 1986; Andrade, 2001).
The general climate for the Colombian Caribbean is also influenced by the effect of two low level streams. The San Andres stream (related to the northeast trade winds), which is located between 13-15º N and has a nucleus lower than 900 hPa, with a maximum speed of 12 m s-1 in the periods December-February and June-August, and a minimum speed of 6 m s-1 in the quarter September-November. And the Choco stream (related to the southeast trade winds that come from the Pacific Ocean), which nucleus is located at 5º N and 850 hPa, and has a maximum speed of 6 m s-1 between September and November, and a minimum speed of 2 m s-1 between March and May (Poveda and Mesa, 1998; Poveda, 2004). The Guajira region (corresponding to Riohacha city in Fig. 1) presents a huge potential for the implementation of wind farms as sources of clean energy conversion associated with the persistence of the trade winds during all year (Martínez et al., 2017).
The migration of the ITCZ and the dynamics of surface streams that control the general climate in the Colombian Caribbean, determine two climatic seasons defined by the precipitation rate: (a) a dry season, which occurs from December to March, characterized by the increase of the northerly trade winds (Fig. 2a), and (b) a rainy season occurring from April to November, but mainly during August to November (Fig. 2c), because at the end of May a short summer known as Veranillo de San Juán (a transition time (Fig. 2b) originated as a consequence of the arrival of the southeast trade winds Poveda and Mesa, 1998; Andrade, 2001; Hastenrath and Polzin, 2013) produces a decrease in precipitation during June and July.
Average precipitation in the studied cities is as follows: Riohacha, 500-1000 mm; Barranquilla, about 1000 mm; Sierra Nevada de Santa Marta, 2500 mm, and 1500 mm in the eastern and southeastern sectors (Pabón et al., 2001).
The different climate variables in the Colombian Caribbean have enabled to determine that there are microclimates in each of the coastal regions. The northeastern part is desert, the central zone is arid and semi-arid, and the southwestern part, close to the border with Panama, (Urabá) is humid (Fig. 3). During the dry season, the average temperature in the city of Riohacha in La Guajira peninsula, reaches approximately 27.3 ºC, increases to 29.8 ºC in June, and decreases to 27.7 ºC in November. This means that this zone has an average temperature of approximately 28.3 ºC throughout the year. In Santa Marta, during the dry season, temperature reaches approximately 27.7 ºC, increases to 28.8 ºC in June, and decreases to 28 ºC in the humid season; in Barranquilla it reaches up to 26.7 ºC in the dry season, increasing to 28.1 ºC in June, and decreasing to 27.7 ºC in the humid season (CIOH, 2010).

Regarding seasonal climatic variability, in the case of the Colombian territory the extreme phases of seasonal fluctuations modulate the intensity and frequency of extreme events. The intra-seasonal oscillations have been studied by Torres-Pineda and Pabón-Caicedo (2017) and Poveda et al. (2002). These works indicate that intra-seasonal variability has a strong relation with the Madden-Julian oscillation. In the other hand, under the conditions of the warm phase of ENSO (El Niño), the Caribbean appears to have a deficit of rainfall, while during La Niña (cold phase of ENSO), the response is inverse (Pabón-Caicedo and Montealegre-Bocanegra, 2017).
The Colombian Caribbean is also affected by the transit of cold fronts in the period December-March, which come from high latitudes and descend to 10º N. These systems generate increases in the pressure gradient producing increases in wind intensity and wave height (Ortiz et al., 2013, 2014). The cyclone season occurs in the Atlantic Ocean and the Caribbean between June and November, and the sea is exposed to the impact of storms and hurricanes in their east-west trajectories. The Colombian Caribbean coast has experimented the effect of several hurricanes, the most devastating being hurricane Joan in 1988 (Ortiz, 2012). The formation of tornadoes in the central zone of the Caribbean has also been reported, mainly in the metropolitan area of the city of Barranquilla (Ortiz and Rosales, 2012).
The average wave regime in the coastline of the Colombian Caribbean comes from the northeast. The significant height of external platforms is 3.6 m in average, and with some differences between the northeast and northwest of the coastline. Tides in the Colombian Caribbean have a range of 0.48 m, of mixed type. Daily components are more representative with 58.3% of the sum of amplitudes, compared to 36.1% of semi-day components (García et al., 2011).
The average sea surface temperature (SST) in the Colombian Caribbean is 27.7 ºC (Fig. 4). Two maximums are seen in the station scale; the first occurs in June, and the second in October, with a mild decrease in July. The second maximum is even higher, exceeding the first by 0.5 ºC and reaching 28.6 ºC. The minimum temperature during this period in the region is observed in February, with a value of 26.6 ºC (Bernal et al., 2006).

Fig. 4 Monthly variation of sea surface temperature in the Colombian Caribbean (modified from Bernal et al., 2006).
In regard to geographic variation, as it can be seen in Figure 5a during the dry season (December-March) the highest SST is seen in the southwest coast (Urabá), with a value of 27.5 ºC, decreasing towards the northeast (Guajira), where the lowest value is 25 ºC. In the dry season (August-November), the SST distribution is relatively homogeneous along the Colombian Caribbean zone. Slightly higher values are observed in the Urabá zone in the southwest, and the SST zone oscillates between 28.5-28.7 ºC on average (Fig. 5b).

Fig. 5 Contours of sea surface temperature in the Colombian Caribbean: (a) dry season (December-March), and (b) humid season (August-November) (modified from IDEAM, 2005).
3. Data set and methods
The city of Santa Marta, capital of the Magdalena department, is located close to the Sierra Nevada de Santa Marta (SM). This mountain range, with an altitude of 5775 masl and approximate surface of 17 000 km2, is the highest elevation of Colombia. It is isolated from the Andean Mountains by the valley system, formed by the Cesar and Rancheria rivers. Its highest points are the Simón Bolívar and Cristobal Colón peaks.
For the spatial or geographic characterization of the general wind pattern and sea breeze in SM, data was used from two meteorological stations during the period January 1st to December 31, 2010: the Simón Bolívar International Airport (SBA) station, located 0.2 km from the coast with a temporary resolution of 1 h; and the Jorge Tadeo Lozano University of Bogotá, Santa Marta Office (UJTL), located 0.1 km from the coast line with a temporary resolution of 30 min. An analysis was also performed on the Almirante Padilla International Airport (APA) station, located 2.0 km from the coast in the city of Riohacha (RIO), which is the capital of La Guajira department; and the station of the Ernesto Cortisoz International Airport (ECA), located 20 km from the coast. This airport offers services to Barranquilla city, which is a fluvial harbor and is the capital of the Atlántico department on the western bank of the Magdalena River. Table I summarizes the stations used to analyze the sea breeze. Unfortunately, it was not possible to obtain time series with the proper frequency (a temporary resolution of at least 1 h and with continuous data series) for the southwest zone of the Colombian Caribbean. The three aforementioned coastal cities are shown with black squares in Figure 1.
Table I Location of the meteorological stations used to characterize the sea breeze.
| Station name | City | Lat. (ºN) | Long. (ºW) | Alt. (m) | Distance to sea (km) |
| Almirante Padilla Airport (APA) | RIO | 11.527 | 72.92 | 4 | 2 |
| Ernesto Cortisoz Airport (ECA) | BAQ | 10.536 | 74.78 | 14 | 20 |
| Simón Bolívar Airport (SBA) | SM | 11.119 | 74.23 | 4 | 0.2 |
| Jorge T. Lozano University (UJTL) | SM | 11.20 | 74.22 | 4 | 0.1 |
Automatic meteorological stations (EMA, for its acronym in Spanish) of surface are the main system for weather service at airports in Colombia. Under normal operating conditions, the air traffic controller provides the information provided by the main EMA (located in the main header of the runway) to aircrafts in the phase of take-off or landing. This information includes temperature, relative humidity, wind speed and wind direction, among other variables. Airport stations are operated by the Instituto de Hidrología, Meteorología y Estudios Ambientales (Hydrology, Meteorology, and Environmental Studies Institute, IDEAM). This office is the meteorological authority in Colombia and is responsible for meteorological information for airports and forecast in the country. Data from the three selected stations in the period 1981-2008 was obtained through the descriptive analysis of wind speed (m s-1) and wind direction (º). This data is recorded every 2 min and averaged every 30 min. The meteorological information from IDEAM is available for scientific purposes from: http://www.meteoaeronautica.gov.co/ (IDEAM, 2010).
During the analysis of the time series some anomalous values were found which were corrected using cubic spline interpolation. These atypical data are probably due to a failure of the station, but it should be noted that the amount of anomalous values is negligible with respect to the length of the time series.
On the other hand, the weather station at UJTL (Davis 6152 Wireless Vantage Pro2) consists of a console unit and an innovative integrated sensor suite that includes a rain collector with self-emptying bucket, temperature and relative humidity sensors and an anemometer. The sensor suite is housed inside a radiation shield, protecting the sensors against solar radiation and additional sources of reflected and/or radiated heat (www.scientificsales.com). This station is located 4 m above the ground and is operated by the Jorge Tadeo Lozano University.
Wind roses were obtained and the multiannual monthly variation was estimated (station scale) for each city. Wind behavior was represented through hodographs (Haurwitz, 1947; Delgado et al., 1994; Salvador and Millán, 2003). According to the hodograph shapes and their position in relation to the coast line, the presence of sea breeze can be determined, and its magnitude and position relative to the origin can be calculated. Therefore, centered hodographs are related to more defined sea breezes (Haurwitz, 1947).
The methodology used by Gustavsson et al. (1995) and Prohom (1998) was also employed to identify the presence of sea breeze, which considers the following criteria:
The sea breeze cycle begins when there is an abrupt change in wind direction, ≥ 100º, with circulations from sea to land, and an increase on wind speed not exceeding 10 m s-1, as well as a reduction in temperature.
The sea breeze cycle ends when there is an abrupt change in wind direction, ≥ 100º, with circulations from land to sea, and a reduction in speed and temperature.
Eqs. (1) and (2) were used to determine the magnitude (V) and direction (φ) of sea breeze:
 (1)
(1)
 (2)
(2)
where V is the magnitude of sea breeze, and φ is the wind direction for each data (from 1 to N), respectively.
 (3)
(3)
 (4)
(4)
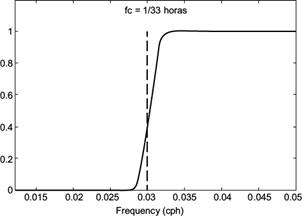
After decomposing the wind u (zonal) and v (meridional), a high pass filter was applied with a closing frequency of 33 h. This filtering process was made with the objective of extracting the components of synoptic winds from the data series (Maza and Voulgaris, 2011).
Moreover, spectral analysis by a modified periodogram was made using the Welch method, to determine energy distribution by frequency and to establish the predominant frequencies in the wind data series. The periodogram is based on fast Fourier transform (FFT) to show the frequency spectrum of a signal, but the periodogram by itself is not an estimator of the real spectral power density of a stationary process. Therefore, the modified periodogram was used to carry out the spectral analysis of wind series by using the Welch method or WOSA (weighted overlapped spectrum averaging), which is widely used in oceanography. It enables to reduce the periodogram variance (Kim, 2003; Wadhams and Doble, 2009), which is achieved by dividing the time series in segments that are overlapped and then a spectral window is applied to avoid elimination of the window´s ends; finally the TRF is performed:
 (5)
(5)
 (6)
(6)
 (7)
(7)
where m is the number of segments, K is the number of observations in each segment, and U is a normalization factor applied to eliminate the bias of the spectral estimator (Welch, 1967).
When applying the periodogram by using the Welch method to wind data of the meteorological stations studied, 20 spare degrees of freedom were used with an overlap of 50% and a Hamming window with a confidence interval of 95%.
The filter used is a high pass Finite Impulse Response (FIR) (Fig.6), with the purpose of extracting the components of synoptic winds of the analyzed data. This type of filters offer a response with a more linear phase, and are not unstable since they do not have feedback. On the other hand, these filters require a great number of terms in their equations, which makes them more costly in terms of computational calculation. The filter was used with a closing frequency of 33 h, with an order of 720, and a Hamming window was applied. Similar filters have been used by Liu et al. (2000).
4. Results
Panel (a) in Figures 7, 8, and 9 shows the wind speed time series for each airport station analyzed (ECA, SBA, APA), during the period 1981-2008, while panel (b) represents the directional distributions of the wind direction (wind rose) for each station.
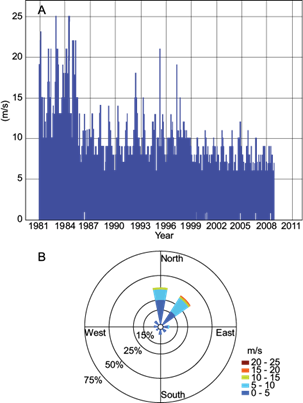
Fig. 7 (a) Time series of wind speed without filter at the ECA station for the 1981-2008 period. (b) Wind rose for the ECA station during the period 1981-2008.

Fig. 8 (a) Time series of wind speed without filter at the SBA station for the 1981-2008 period. (b) Wind rose for the SBA station during the period 1981-2008.

Fig. 9 (a) Time series of wind speed without filter at the APA station for the 1981-2008 period. (b) Wind rose for the APA station during the period 1981-2008.
According to Figs. 7, 8 and 9, the ECA station (Barranquilla) shows that winds mainly come from the north and northeast. In the SBA station there is not a predominant marked direction; although the higher percentage comes from the northeast, there are components in all directions. In the APA station, the East winds strongly set the predominant direction, and in a lower proportion there are some components of the northeast.
Figure 10 exemplifies the application of the filter to wind speed time series at the UJTL station, from July 1st to 31, 2010. Panel (a) shows the time series of wind magnitude without filter while panel (b) corresponds to the signal extracted from the original series.

Fig. 10 (a) Wind speed time series without filter at UJTL (July-August, 2010). (b) Time series of wind speed extracted from the original signal.
The hodograph of SBA station is shown in Figure 11. It is observed that it has an elliptic shape, with a clockwise rotation and a northeast-southwest orientation, with greater amplitudes between December and April. In the period June-July, it shows a decrease in amplitude, and the wind rotation has smaller eccentricity (more circular shape), but a higher approach to the origin.
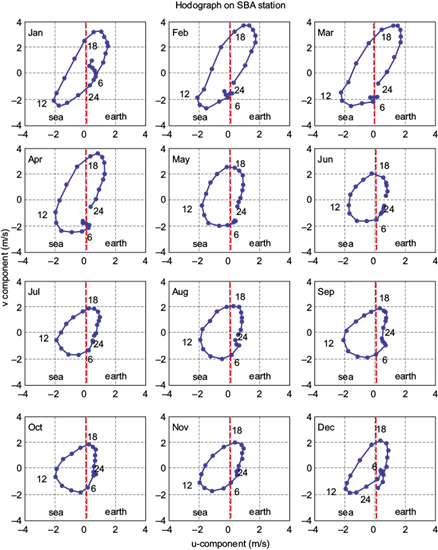
The maximum speed during the sea breeze cycle obtained by using Eq. (1) and depicted in the hodographs is observed in Figure 12a. It should be noted that the earth-sea breeze is more intense during the dry season, where the maximum speed found for sea-earth and earth-sea breeze was 3.04 and 3.9 m s-1, respectively, occurring during February. In the wet season, the magnitudes of sea-earth breeze and earth-sea breeze are 2 and 1.5 m s-1, respectively.
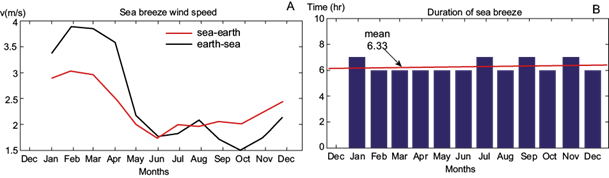
Fig. 12 (a) Maximum speed of the sea breeze cycle. (b) Average duration of the sea breeze cycle in the SBA station.
Figure 12b shows that the average duration of the sea breeze cycle was 6.33 h. This calculation was carried out by taking the starting and ending times of the sea breeze cycle. It is important to state that the variability is very low, which means that there is no difference between the dry and wet seasons.
Due to the better resolution of data from the UJTL station in Santa Marta, a detailed analysis of the sea breeze signal was completed. Figure 13a displays the hodograph corresponding to the dry season (December-March), where a change in wind direction between 11:00 and 13:00 LT can be noted, with sea-earth and earth-sea average speeds of 2.5 and 2.2 m s-1, respectively. Regarding winds, east is the main direction, even though other directions are observed less frequently due to the presence of sea breeze (Fig. 13c). By using the periodogram modified by Welch’s method, the energy was estimated based on the frequency. A higher energy in the daytime component (D) was observed, and a lower energy in the semi-daytime component (SD), as observed in Figure 13b. For the dry season (August-November), the sea breeze magnitude significantly decreases to 0.3 m s-1 (Fig. 13d), which coincides with the one obtained in the 30-yr analysis of the SBA station. The southeast wind component is more predominant and spectral energy is almost nonexistent (Fig. 13e, f).

Fig. 13 The UJTL station during the dry season (December-March): (a) hodograph, (b) Welch’s spectra (power spectrum [PS] and confidence interval [CI]), and (c) wind rose; and in the wet season (August-November): (d) hodograph; (e) Welch’s spectra, and (f) wind rose. Numbers near the ellipses correspond to time and the dotted line to the approximate location of the coastline.
With regard to the cities of Barranquilla (ECA station) and Riohacha (APA station), which are located to the west and east of Santa Marta, respectively, the hodographs displayed in Figure 14 were rebuilt ([a] and [c]). For a better comparison, the Santa Marta hodograph was also included (Fig. 14b).
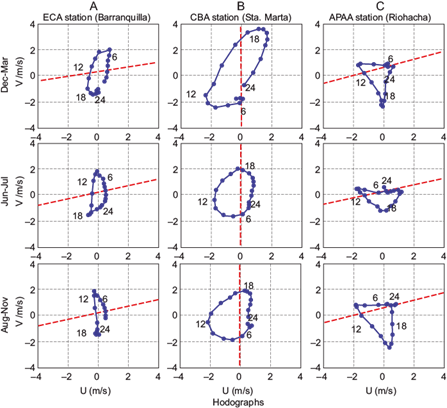
Fig. 14 Hodographs for the period 1981-2008 during all seasons for each of the weather stations analyzed. (a) ECA (Barranquilla), (b) SBA (Santa Marta), and (c) APA (Riohacha).
Hodographs corresponding to the ECA station show a more defined ellipse for the dry season (December-March), which indicates a defined sea breeze system with counterclockwise rotation that changes its direction between 8:00 and 10:00 LT, with sea-land speed of 2.3 m s-1. During the night, land-sea winds occur with a magnitude of 1.8 m s-1 (Fig. 14a). During the wet (August-November) and intermediate (June-July) seasons, it is observed that the ellipse orientation is more perpendicular to the coast, and the sea breeze magnitude is 1.7 m s-1.
In the hodographs of the APA station (Riohacha), a counterclockwise rotation of the winds is observed similarly to the ECA station, but there is not a clear formation of the ellipse as observed in the SBA and ECA stations throughout the year. The sea breeze magnitude is approximately 0.5 m s-1 all year round (Fig. 14c).
Figure 15a-c depicts the mean temperature for each station and SST sea according to Bernal et al. (2006). In this work, surface temperature series of the Comprehensive Ocean-Atmosphere Data Set (COADS) Database 277 (Reynolds and Smith, 1994) were used, with monthly 1º × 1º resolution for the period 1981- 2000 on the Colombian coast.

Fig. 15 Differences between land temperature and SST on the three stations analyzed for the period 1982-2000: (a) ECA (Barranquilla), (b) SBA (Santa Marta), and (c) APA (Riohacha).
A difference of bimodal temperature (sea-earth) can be observed in the city of Barranquilla, with two maximum values of 1.21 ºC in March and October; the minimum (0.2 ºC) is observed in August (Fig. 15a). In Santa Marta, a maximum of 3 ºC is observed in March, and a minimum of 0.1 ºC in September (Fig. 15b). In Riohacha (APA), maximum and minimum values are of 2.7 ºC and 0.2 ºC in July and September, respectively. Figure 15c shows the mean wind values for the APA station (Riohacha). The maximum value for Barranquilla and Santa Marta along the year is about 4 m s-1. Maximum values are reported in February (4.7 m s-1), and the lowest are observed during October (1.5 m s-1).
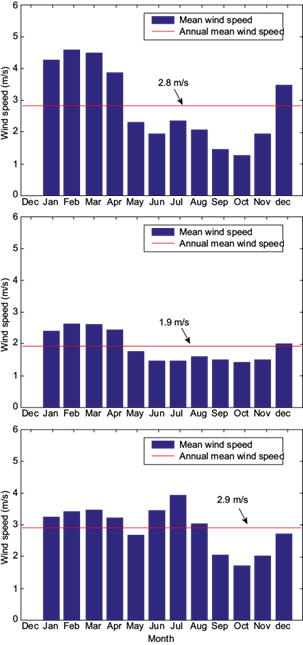
Figure 16 shows the mean wind speed for the three stations analyzed. The city of Barranquilla (ECA station) has a mean wind value of 2.8 m s-1; the highest values are reported in February (4.6 m s-1) and the lowest in October (1.3 m s-1) (Fig. 16a). The mean wind value for the SBA station (Santa Marta) is 2.0 m s-1, which is constant during the year, slightly increasing to 2.5 m s-1 in March (Fig.16b). Figure 16c shows mean wind values for the APA station (Riohacha). The maximum mean value in Barranquilla and Santa Marta during the whole year is about 4.0 m s-1, reported in February, and the lowest values are observed in October (1.7 m s-1).
5. Discussion and conclusions
According to the Bjerknes’ circulation theorem (Bjerknes, 1921), sea breeze circulation is influenced by three main mechanisms: (1) density gradients, (2) Coriolis force, and (3) friction. Based on the geographic position, near the equator in the Colombian Caribbean coast, the Coriolis acceleration has no negative effect in sea breeze. By assuming that the atmosphere is not viscous enough, it could be suggested that density gradients are the main generating sources of sea breeze in this area, as a result of the differences between sea and earth temperature. In all Caribbean areas, a sea breeze signal during the dry season was observed (December-March), which is consistent with the season in which the higher gradients occur during the whole year. This also matches the information reported by Salvador and Millán (2003) and Azorín (2004), who observed higher sea breeze occurrence during summer in the Spanish coasts.
From all the results in this study, the city of Santa Marta shows a better sea breeze signal with regard to the cities of Riohacha and Barranquilla, which matches the area with a wider land-sea temperature difference (approximately 3.6 ºC) and lowest mean winds. The most defined and origin-centered hodograph occurs in February and shows a clockwise rotation. The sea breeze begins with a change in direction at 12:00 LT, thus introducing the beginning of sea-earth breezes with a speed of 2.4 m s-1, which ends about 18:00 LT; then the land-sea breeze starts with a speed < 1.0 m s-1. The wind rose in Santa Marta is also consistent with the presence of sea breeze, since wind components from the northwest, southwest and southeast are different to the predominant direction from the northeast. The dry season spectral analysis for the UJTL station shows a daytime and semi-daytime component. The daytime component represents the sea breeze cycle; the semi-daytime component can be a harmonic pair for the daytime component, which corresponds to the non-sinusoidal nature of the sea breeze cycle (Masselink and Pattiaratchi, 2001). In the wet season spectral analysis (Fig. 10e), it is observed that the breeze system has lower energy in comparison to the dry season. It is possible that the UJTL station has been affected by the area orography, particularly by the hills surrounding the station, thus causing lower speeds during the sea breeze. Since these are mountainous lands with different slope and surface characteristics, when receiving solar radiations, they show pressure gradients which cause alterations in the sea breeze (Kusuda and Alpert, 1982).
The hodographs for mid- and wet seasons (June-July and August-November, respectively) present ellipses with lower amplitude with regard to the dry season, but with the same rotation direction. The mean sea-earth speed for both seasons is about 1.4 m s-1.
The sea breeze signal in the ECA station (Barranquilla) is not as strong as that of Santa Marta, which can be related to the presence of a lower earth-sea gradient (1.5 ºC). The lowest presence of the sea breeze cycle is observed in the city of Riohacha (APA station), where the earth-sea temperature gradient in the dry season is low (< 1.0 ºC), but during July a land-sea temperature gradient of 2.5 ºC is observed. The lack of sea breeze could be associated with the strong synoptic winds during almost the whole year, and the strong predominance of the east winds, it means in the earth-sea direction.
In this study, the sea breeze of two Colombian Caribbean coast zones was charted and characterized: northeast Caribbean (Riohacha), and central Caribbean (Santa Marta and Barranquilla). The strongest signal of sea breeze is observed during the dry season (December-March), characterized by the low precipitation rate in the area, with the highest earth-sea temperature gradients of the whole year (except in Riohacha).
The strongest signal of the three areas included in the study was found in the Santa Marta region, which coincides with the higher land-sea temperature gradient area. The maximum magnitude of sea-land breeze wind occurs around 12:00 LT. The maximum speed of the land-earth wind is 2 m s-1, while the earth-sea wind presents a speed of 4.1 m s-1. During the rainy season and the transition, the sea-land breeze speed reaches up to 2.0 m s-1, while the land-sea breeze is just 1 m s-1. Although these values are lower in comparison with the information provided by other authors (Masselink and Pattiaratchi, 2001; Delgado et. al., 1994), the sea breeze cycle is significant and is to be taken into account in the different coastal processes.
For the Barranquilla case, the magnitudes of the sea breeze signal are 2.3 m s-1 for sea-land, and land-sea winds of 1.8 m s-1 were observed during the night. This could be related to the low land-sea temperature gradient in this area (1.2 ºC). These results match those provided by Vergahen and Savov (1999) for the city of Cartagena de Indias, located to the northeast of Barranquilla where, by means of Hsu’s parameterization (1988), a sea breeze from 1.0 to 1.5 m s-1 was estimated with local climate data. In the Riohacha case, the lowest and the least defined sea breeze signal of the whole area studied was found, with earth-sea winds between 1.5 and 1.8 m s-1. The lowest values of land-sea temperature gradient (< 1.0 ºC) occurred during the dry season (December-March), and although there is a temperature gradient of 2.5 ºC during July, it is stated that the strong influence of the synoptic wind in magnitude and direction in this area of the Caribbean, during almost the whole year, affects the sea breeze cycle development.
This study constitutes the first characterization of sea breeze in the Colombian Caribbean coast. Since Santa Marta is one of the main touristic destinations and an important commercial and unloading coal port in Colombia, this study offers an important basis to analyze the relation between sea breeze and currents, sediment and pollutant transportation, and swell processes in future research.

