


 nova página do texto(beta)
 Inglês (pdf)
 Artigo em XML
 Referências do artigo
 Enviar este artigo por email
 Citado por SciELO
  Similares em
SciELO
Similares em
SciELO 
 Permalink
1. Introduction
Santiago, the capital of Chile, is one of the cities with the highest atmospheric pollution levels in Latin America and among the most polluted worldwide, similar to Mexico City, Delhi, or Beijing (Molina and Molina, 2004; WHO, 2013). The city of Santiago concentrates 40% of the country’s population, with around six million inhabitants and a population density of 450 people per km2 (INE, 2017). The increasing urban population, together with the geographic location and prevailing weather conditions (unfavorable for ventilation) account for such high levels of atmospheric pollution (Toro et al., 2014). In spite of the adoption of certain abatement measures to reduce such high atmospheric pollution levels, which included the renewal of public transport, the improvement of the chemical quality of fuels by decreasing their proportion of sulfur, benzene, olefins, and aromatic compounds, the renewal of the truck fleet, the implementation of standards for light vehicles and industry, or the adoption of mitigation actions in dust production, PM10 and PM2.5 concentrations are still above national air quality standards, especially during the autumn and winter months (www.sinca.mma.gob.cl) (Mena-Carrasco et al., 2014). Those measures have been progressively implemented since 1997.
Atmospheric particulate matter is a pollutant whose analysis can be addressed from different perspectives and/or attending to diverse characteristics, including mass concentrations, size distribution, particle shape or chemical composition. These characteristics are strongly related to the kinds and magnitudes of the effects on health (Pope and Dockery 2006; Franklin et al., 2008; Sarnat et al., 2008; Bell et al., 2009; Peng et al., 2009; Ostro et al., 2011). Particulate matter may arise from different natural and anthropogenic sources, and its chemical composition is usually well connected with its origin. A number of studies have been published on the chemical composition of particulate matter in Santiago (Prendez et al., 1984; Didyk et al., 2000; Gil et al., 2000; Jorquera 2002; Koutrakis et al., 2005; Gramsch et al., 2006, 2009), and specific ones on the elemental chemical composition of PM10 (Artaxo et al., 1999; Richter et al., 2007; Sax et al., 2007). The fine particulate matter (PM2.5) of Santiago has a predominance of secondary organic and inorganic aerosols, reaching up to 60% (Seguel et al., 2009). During the last few years, as a result of the implementation of certain measures to reduce PM levels, the elemental composition of PM in the city of Santiago has substantially changed. There has been an important decrease of sulfur and lead, due to the substantial improvement of the quality of fuels (desulfurization) and the use of unleaded gasoline. A similar pattern is seen with bromine. Inorganic substances, including trace metals, have been determined (Jorquera and Barraza, 2012). In particular, a study over an industrial district in Santiago during 1997-2003 showed that the labile or water-soluble fraction of PM10 has relatively high concentrations of copper, zinc, manganese, cadmium and arsenic, elements clearly associated to anthropogenic emissions (industry, road traffic). Overall, a decline in PM concentrations has taken place in Santiago since 2000. Toro et al. (2014) studied the variability of particulate matter from 2000 to 2012 at four locations in the metropolitan region of Santiago. While the PM10 and PM2.5 levels have declined since 2000, they still exceed the environmental quality standards. Annual average PM10 concentrations range from 52 to 76 µg m-3, with the highest concentrations in winter.
It has been shown that fine particulate matter is responsible for increased mortality and morbidity of people in Santiago. Cakmak et al. (2007, 2009, 2011) and Valdés et al. (2012) concluded that the PM2.5 mass is not enough to explain the observed incidence of mortality, and they claimed for specific studies to identify the main sources of heavy metals such as Zn, Cr or Cu.
As discussed before, the chemical composition of PM is a better proxy than PM mass concentrations to assess health impacts. Furthermore, if we could introduce another parameter, such as the partitioning of trace elements between soluble and insoluble fractions, the epidemiological effects linked to particulate matter pollution could be better constrained.
The objective of this work was to determine the total elemental composition and the water-soluble fraction of so called heavy and trace elements present in PM10 from three urban locations under different emission or source patterns in Santiago: downtown Santiago, a peripheral area, and an intermediate locations between the former. The choice of years for the study (2006, 2008, 2009 and 2010) is justified by a change in the type of public transport to one called Transantiago (Gramsch et al., 2013), which replaced old buses with new ones fitted with nonpolluting technology, reduced circulation times and the number of vehicles, and established the use of exclusive lanes. However, the pattern of combustion sources has also varied in Santiago, especially over the last five years. Important sources of emission of fine PM are residential quarters, accounting for almost 30%, together with mobile sources. (Troncoso et al., 2012; MMA, 2014; Villalobos et al., 2015).
2. Experimental
2.1 Sampling zone
This study used samples from three monitoring stations in Santiago, located in Cerrillos (CR), La Pintana (LP) and Av. Ossa (OSS). The choice of these sites was due to the following: Cerrillos (lat. -33.491, long. -70.719, 21 km2 and 83 000 inhabitants) is an industrial zone in the west side of the city; La Pintana (lat. -33.614, long. -70.635, 30.6 km2 and 287 000 inhabitants) is a peripheral urban site, and Av. Ossa (lat. -33.449, long. -70.571, 16.9 km2 and 170 000 inhabitants) is an intermediate area between the above. PM10 samples were obtained during the month of May (autumn) in 2006, 2008, 2009 and 2010. The choice of month is justified from previous studies (Jorquera, 2002; Gramsch et al., 2006), which found that May is a month with winter-like conditions (low temperatures, low wind speed and strong temperature inversions) but with little rain, so it is a time period in which environmental conditions do not change much. Figure 1 shows the location of these monitoring sites.
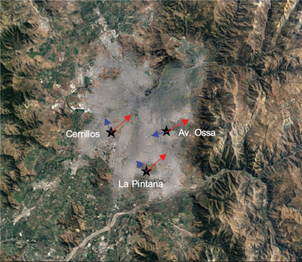
Fig.1. Map of Santiago, Chile, with the location of the three monitoring stations used for the study: Cerrillos (lat. -33.491, long. -70.719, located in the west of the city); La Pintana (lat. -33.614, long. -70.635, a peripheral urban site), and Av. Ossa. (lat. -33.449, long. -70.571, an intermediate area). The red arrows indicate the predominant wind direction during the afternoon (11-19 LT) and the blue arrows show the wind direction at night and early morning.
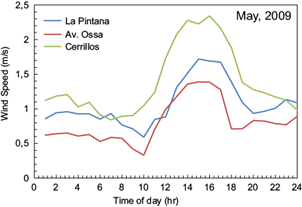
The wind pattern in Santiago de Chile has a valley-mountain behavior with generally low speeds. The predominant wind in the city occurs during the afternoon (11-19 LT) with a south-east direction, as shown in the wind roses of Figure 2. It can be seen that during the afternoon, the wind direction is the same for all stations and has little dispersion. During these hours, the speed is also higher than during the night or early morning. There is also a very clear difference between the day and night wind. Figure 3 shows the wind speed for all sites for the month of May 2009. The wind comes from the coast and enters Santiago from the south-west, therefore the highest speed is achieved in Cerrillos (see Fig. 3), and its velocity decreases as it enters the city. This wind brings clean air from the coast into the city (Gramsch et al., 2006) but it also carries pollutants from downtown Santiago towards the east. As shown in Figure 3, pollutants from La Pintana can be transported into Av. Ossa during the afternoon. At night and early morning, the wind direction reverses; however, the velocity is very low and the direction is not the opposite of the afternoon wind. Thus, there is probably no transport of pollutants from Av. Ossa towards the other sites at night.
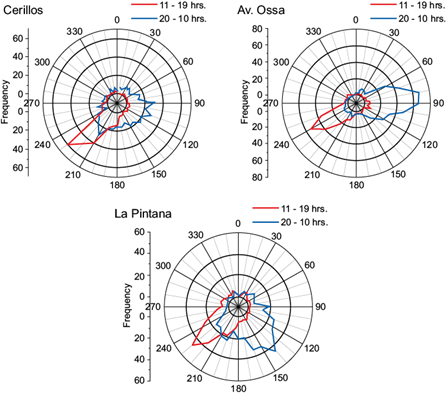
Fig. 2 Average wind roses in La Pintana, Cerrillos and Av. Ossa for May 2009. The red lines show the wind direction between 11 and 19 LT and the blue lines show the wind direction during the rest of the day.
2.2 Materials and methods
PM10 was collected on fiberglass filters (20.32 × 25.4 cm) during 24 h, using hi-vol. samplers (ECOTECH model 3000) which absorbed 1600 m3 of air in 24 h. All samples were provided and normalized by the Ministerio del Ambiente (Ministry of the Environment, www.mma.gob.cl) in collaboration with Chile’s Ministerio de Salud (Ministry of Health).
Then, circular sections of each filter (1.53 cm2) were obtained and merged to build-up a weekly composite sample. Overall, four samples were obtained per year at each urban observatory. The sampling was made in duplicate, analyzing 48 samples and 48 counter-samples.
2.3 Total metals extraction
Total metals extraction from the filters was carried out by the acid digestion in Teflon containers (EPA method). The samples were digested with 1.25 mL of nitric acid (Suprapur, Merck) and 2.5 ml of hydrochloric acid (Suprapur, Merck), and heated at 90 ºC during 12 h. Then, 1.25 mL of HClO4 was added and the mixture was heated for 3 to 6 h to dryness at 240 ºC on a hotplate. The final residue was re-dissolved with 2.5 mL of nitric acid and the volume was completed to 25.0 mL with ultra-pure water. Finally, the solution was centrifuged for 20 min at 5000 rpm and stored at 4 ºC until the chemical analysis was performed. Thereafter, the solutions were analyzed using an ICP-MS (X series II, THERMO).
In order to account for the filter contribution to individual concentrations of the elements and to ensure the analytical quality of our determinations, each set of samples was carried out together with a number of blank filters and a blank filter with 0.01 g of a fly-ash reference material with certified concentrations (NIST-1633b).
The values in micrograms per liter were expressed in nanograms per cubic meter considering the volume of air absorbed during 24 h, the impact area of the filter (513 cm2), the particular area of the filters used for the analysis (1.53 cm2), and the number of filters analyzed.
2.4 Extraction of the soluble fraction of major trace elements
A duplicate of each composite sample was leached with 30 mL of ultrapure water inside PVC containers. The containers were then immersed in an ultrasonic bath during 10 min and placed in an oven at 60 ºC for 6 h. The resultant solution was filtered through a 0.45 µm membrane filter, and finally analyzed by ionic chromatography (high performance liquid chromatography using a WATERS IC-pakTM anion column) for the determination of Cl-, NO3 - and SO4 2-, and by a specific electrode (WATERS 432 conductivity detector) to obtain NH4 + concentrations. Ten mL of the former solution were acidified with nitric acid (5%) and analyzed by ICP-AES to obtain the concentration of major and trace elements in the solution.
2.5 Statistical analysis
The number of samples was insufficient to run typical receptor models such as positive matrix factorization (PMF). Hence, in this study the statistical analysis of the results was based on cluster analysis (CA), considering the total element concentrations. Data standardization of each variable was performed prior to statistical analysis because the concentration orders among the elements and the parameters differed greatly, and statistical results would be highly biased by elements with high concentration. The furthest neighbor method was applied for grouping of the different variables, and dissimilarity was defined by the square Euclidean distance. With this method we were not able to obtain sources and/or atmospheric processes; however, the results should be indicative of possible element associations when source apportionment studies are conducted.
3. Results and discussion
3.1 PM mass concentrations
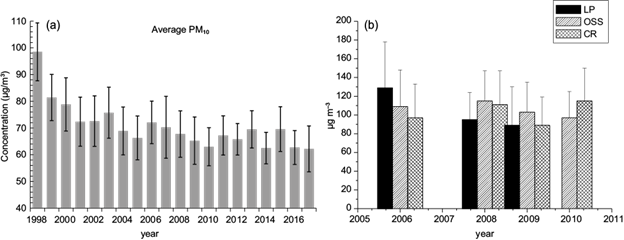
In Santiago, Chile, PM10 concentrations have decreased continuously since 1998, but the trend has slowed down since 2010. Figure 4a shows the PM10 yearly average for the nine stations belonging to the air pollution network of the Sistema de Información Nacional de Calidad del Aire (National Air Quality Information System, SINCA) inside Santiago (SINCA, 2018). This network is used by the authority to monitor several air pollutants as well as meteorological variables. PM10 is measured using TEOM monitors (Rupprecht & Patachnick, Albany, NY, and Thermo Fisher Scientific, Waltham, MA). From 2007 (70.3 µg m-3) to 2010 (63.0 µg m-3) there was a slight decrease in PM10, however this trend did not continue and PM10 has leveled since 2010, as shown in Figure 4a. In the three monitoring stations (Cerrillos [CR], La Pintana [LP] and Av. Ossa [OSS]) there has also been a slight decrease in concentrations from 2006 to 2010, as shown in Figure 4b. During these years important measures have been implemented to abate air pollution from public transport, which included the restructuring of the public transport system, the renewal of the vehicle fleet, and the shortening of circulation routes. These measures were somewhat unpopular, leading to a slight increase of private vehicles (around 6% more in 2009 with respect to 2003 [INE 2011]). This result agrees partly with the report of the Sociedad Chilena de Políticas Públicas (Chilean Society of Public Policies), which notes that “the annual evolution of PM10 between 1997 and 2010 shows a decreasing but moderate trend, indicating that air quality has improved steadily over the past 15 years”. However, as shown in Figure 4a, since 2010 the trend has decreased, and PM10 levels have been fairly constant (Moreno et al., 2010; Figuero et al., 2017).
3.2 Major and trace elements in PM10: mean concentrations and spatio-temporal variation
The application of the analytical procedures described above has resulted in the determination and quatification of major and trace elements. Among the most abundant, Fe, Al, K, Ca, and Mg prevailed, with concentrations in the range 600-8000 ng m-3 (Table I). These are mostly associated with mineral dust bot from natural and anthropogenic origins (but essentially from the latter) (Paris et al., 2010). Sources such as biomass burnig in the case of K (Cheng et al., 2013) or industrial emissions and brake abrasion in the case of Fe (Ulrich et al., 2012) may also contribute. Other abundant PM10 components are S, mostly as sulfate salts (ammonium sulfate predominantly but also forming Ca and Mg sulfate compounds), at concentrations between 2000-4000 ng m-3(Table I) and phosporus, usually with concentrations in the range of 280-1600 ng m-3 (Wang et al., 2015). As expected, lower abundances (usually under 100 ng m-3) have been found for other elements, including heavy metals (Pb, Ti, Mn, Cu, Zn, Ba, Zr, Cr, As, Sn, Sb, Ni, V, Li, Co, Cd, La, Rb). Details on year- and site-specific average concentrations can be found in Table I.
Table I Monthly average concentrations (ng m-3) of elements associated with atmospheric PM10 of Cerrillos (CR), Av. Ossa (OSS) and La Pintana (LP) in the total analysis of dissolved particulate matter.
| Element | Cerrillos | Av. Ossa | La Pintana | ||||||||||
| 2006 | 2008 | 2009 | 2010 | 2006 | 2008 | 2009 | 2010 | 2006 | 2008 | 2009 | |||
| S | 3802 ± 160 | 2422 ± 625 | 2333 ± 258 | 2840 ± 24 | 3514 ± 158 | 2029 ± 432 | 2411 ± 421 | 2024 ± 61 | 4104 ± 212 | 2115 ± 452 | 2415 ± 290 | ||
| Al | 1869 ± 540 | 2539 ± 144 | 1965 ± 135 | 3885 ± 103 | 2658 ± 647 | 3347 ± 559 | 2168 ± 570 | 1973 ± 148 | 4319 ± 1472 | 3019 ± 779 | 2275 ± 997 | ||
| Ca | 2533 ± 860 | 3122 ± 542 | 2461 ± 30 | 4457 ± 276 | 6035 ± 1200 | 7948 ± 928 | 2732 ± 565 | 3560 ± 276 | 4421 ± 1030 | 4017 ± 109 | 2787 ± 444 | ||
| Fe | 2313 ± 600 | 2339 ± 490 | 2884 ± 107 | 4456 ± 203 | 3754 ± 630 | 4784 ± 600 | 3932 ± 710 | 4505 ± 247 | 4051 ± 1400 | 2012 ± 370 | 2409 ± 498 | ||
| K | 1266 ± 405 | 1420 ± 465 | 1291 ± 30 | 1671 ± 25 | 1820 ± 334 | 1740 ± 271 | 1311 ± 302 | 1089 ± 53 | 1795 ± 570 | 1223 ± 295 | 3517 ± 1100 | ||
| Mg | 68 ± 257 | 714 ± 95 | 632 ± 47 | 860 ± 14 | 986 ± 65 | 1435 ± 247 | 747 ± 153 | 630 ± 28 | 1055 ± 300 | 846 ± 86 | 664 ± 177 | ||
| P | 358 ± 200 | 938 ± 311 | 1398 ± 143 | 277 ± 5 | 420 ± 244 | 808 ± 68 | 1607 ± 176 | 1597 ± 35 | 505 ± 70 | 953 ± 167 | 1521 ± 153 | ||
| Zn | 291 ± 105 | 432 ± 160 | 219 ± 24 | 442 ± 13 | 678 ± 40 | 302 ± 51 | 181 ± 6 | 271 ± 64 | 179 ± 130 | 895 ± 79 | 123 ± 55 | ||
| Cu | 141 ± 49 | 156 ± 26 | 104 ± 8 | 173 ± 5 | 199 ± 43 | 169 ± 42 | 133 ± 12 | 153 ± 6 | 117 ± 17 | 79 ± 10 | 66 ± 3 | ||
| Ti | 134 ± 41 | 167 ± 36 | 178 ± 5 | 294 ± 5 | 19 ± 52 | 190 ± 73 | 208 ± 30 | 205 ± 0.2 | 289 ± 90 | 186 ± 40 | 199 ± 40 | ||
| Pb | 125 ± 27 | 84 ± 18 | 70 ± 3 | 123 ± 0.9 | 87 ± 43 | 50 ± 17 | 46 ± 1 | 48 ± 2 | 67 ± 16 | 43 ± 3 | 42 ± 4 | ||
| Mn | 86 ± 27 | 94 ± 12 | 90 ± 9 | 121 ± 0.8 | 108±25 | 123 ± 32 | 100 ± 10 | 88 ± 1 | 113 ± 39 | 80 ± 10 | 78 ± 9 | ||
| Ba | 83 ± 20 | 100 ± 13 | 59 ± 7 | 109 ± 3 | 178 ± 28 | 155 ± 29 | 88 ± 4 | 132 ± 6 | 63 ± 17 | 62 ± 4 | 55 ± 0.3 | ||
| As | 28 ± 10 | 17 ± 4 | 19 ± 4 | 27 ± 0.4 | 24 ± 11 | 12 ± 5 | 17 ± 0.9 | 18 ± 0.5 | 43 ± 22 | 22 ± 6 | 27 ± 1 | ||
| Sb | 19 ± 6 | 16 ± 4 | 11 ± 0.8 | 23 ± 0.5 | 20 ± 8 | 16 ± 4 | 19 ± 0.2 | 17 ± 0.2 | 15 ± 3 | 10 ± 1 | 9 ± 2 | ||
| Zr | 19 ± 10 | 10 ± 3 | 10 ± 3 | 44 ± 2 | 23 ± 13 | 9 ± 3 | 9 ± 4 | 11 ± 2 | 25 ± 8 | 11 ± 1 | 3 ± 0.4 | ||
| Sn | 25 ± 5 | 21 ± 5 | 17 ±2 | 29 ± 0.04 | 20 ± 7 | 18 ± 5 | 16 ± 4 | 17 ± 0.7 | 9 ± 2 | 8 ± 0.6 | 5 ± 0.8 | ||
| Cr | 14 ± 6 | 13 ± 2 | 13 ± 1 | 17 ± 5 | 18 ± 4 | 19 ± 4 | 14 ± 0.6 | 17 ± 0.7 | 9±3 | 9 ± 0.4 | 10 ± 0.2 | ||
| V | 8 ± 3 | 14 ± 3 | 7 ± 0.2 | 9 ± 0.7 | 9 ± 3 | 11 ± 2 | 6 ± 1 | 6 ± 0.5 | 14 ± 5 | 19 ± 6 | 7 ± 0.1 | ||
| Ni | 8 ± 1 | 6 ± 2 | 14 ± 0.9 | 6 ± 0.4 | 8 ± 2 | 11 ± 1 | 1 ± 1 | 12 ± 0.02 | 8 ± 3 | 8 ± 4 | 13 ± 0.8 | ||
| Se | 5 ± 0.8 | 6 ± 0.6 | 4 ± 0.4 | 8 ± 0.4 | 3 ± 0.1 | 3 ± 0.1 | 3 ± 0.05 | 4 ± 0.03 | 4 ± 2 | 3 ± 0.4 | 3 ± 0.9 | ||
| Rb | 3 ± 0.9 | 4 ± 0.9 | 2 ± 0.1 | 5 ± 0.05 | 3 ± 0.9 | 3 ± 0.7 | 2 ± 0.7 | 2 ± 0.003 | 5 ± 2 | 3 ± 1 | 3 ± 0.2 | ||
| Co | 1 ± 0.5 | 1 ± 0.2 | 1 ± 0.05 | 2 ± 0.02 | 1 ± 0.3 | 1 ± 0.3 | 1 ± 0.5 | 1 ± 0.02 | 2 ± 0.4 | 2 ± 0.6 | 1 ± 0.4 | ||
| Cd | 2 ± 0.4 | 1 ± 0.2 | 1 ± 0.4 | 2 ± 0.03 | 1 ± 0.1 | 1 ± 0.2 | 1 ± 0.09 | 1 ± 0.04 | 1 ± 0.2 | 1 ± 0.2 | 1 ± 0.3 | ||
| Li | 1 ± 0.6 | 1 ± 0.3 | 1 ± 0.03 | 2 ± 0.02 | 1 ± 0.5 | 1 ± 0.2 | 1 ± 0.2 | 1 ± 0.08 | 1 ± 0.7 | 1 ± 0.5 | 1 ± 0.3 | ||
Regarding water-soluble PM10 components (sulfate, nitrate, ammonium and chloride), Table II shows that the most abundant is ammonium, with concentrations between 0.42 and 0.21 µEq m-3. Nitrate is the second compound in abundance, in the range of 0.38 to 0.19 µEq m-3; followed by chloride, showing concentrations in the range of 0.12 to 0.08 µEq m-3, and finally sulfate in the range of 0.10 to 0.05 µEq m-3. These results are not surprising: urban pollution episodes are generally characterized by huge quantities of secondary inorganic and organic components. Amongst the inorganic ones, ammonium nitrate is the foremost abundant component, mostly derived from the transformation in the atmosphere of combustion exhausts (NOx to nitrates) from industry and vehicles.
Table II Concentrations of sulfate, nitrate, chloride and metallic cations; ammonium (µEq m-3), and cation to anion ratios in the water soluble fraction of PM10.
| Year | Area of Santiago |
Sulfate | Chloride | Nitrate | Ammonium | Total anions |
Total metallic cations |
Total cations |
Cation to anion ratio |
| 2006 | Cerrillos | 0.10 ± 0.047 | 0.12 ± 0.031 | 0.28 ± 0.099 | 0.42 ± 0.197 | 0.5 | 0.145 ± 0.042 | 0.564 | 1.13 |
| 2008 | 0.06 ± 0.016 | 0.09 ± 0.020 | 0.28 ± 0.12 | 0.29 ± 0.116 | 0.43 | 0.184 ± 0.049 | 0.474 | 1.10 | |
| 2009 | 0.06 ± 0.008 | 0.13 ± 0.014 | 0.23 ± 0.035 | 0.24 ± 0.038 | 0.42 | 0.156 ± 0.013 | 0.396 | 0.94 | |
| 2010 | 0.07 ± 0.001 | 0.12 ± 0.014 | 0.29 ± 0.015 | 0.27 ± 0.0001 | 0.48 | 0.229 ± 0.003 | 0.499 | 1.04 | |
| 2006 | Av. Ossa | 0.09 ± 0.048 | 0.09 ± 0.028 | 0.32 ± 0.124 | 0.39 ± 0.203 | 0.5 | 0.172 ± 0.054 | 0.562 | 1.12 |
| 2008 | 0.05 ± 0.010 | 0.08 ± 0.012 | 0.38 ± 0.029 | 0.36 ± 0.116 | 0.51 | 0.160 ± 0.033 | 0.520 | 1.02 | |
| 2009 | 0.06 ± 0.012 | 0.09 ± 0.015 | 0.32 ± 0.005 | 0.29 ± 0.018 | 0.47 | 0.169 ± 0.018 | 0.459 | 0.98 | |
| 2010 | 0.05 ± 0.032 | 0.09 ± 0.013 | 0.27 ± 0.088 | 0.21 ± 0.001 | 0.41 | 0.165 ± 0.001 | 0.375 | 0.91 | |
| 2006 | La Pintana | 0.10 ± 0.050 | 0.09 ± 0.010 | 0.22 ± 0.060 | 0.35 ± 0.179 | 0.41 | 0.213 ± 0.061 | 0.563 | 1.37 |
| 2008 | 0.05 ± 0.024 | 0.10 ± 0.008 | 0.20 ± 0.078 | 0.24 ± 0.054 | 0.35 | 0.178 ± 0.052 | 0.418 | 1.19 | |
| 2009 | 0.05 ± 0.005 | 0.09 ± 0.006 | 0.19 ± 0.049 | 0.24 ± 0.026 | 0.33 | 0.173 ± 0.034 | 0.413 | 1.25 |
Overall, the amount of major anions and cations, namely sulfate, nitrate, ammonium and chloride (Table II), accounts for 40-50% of PM10 mass concentrations. A good linear correlation between nitrates and ammonium was observed (A = 0.0395 ± 0.057; B =1.015 ± 0.199; R = 0.68707 ± 0.10006; N = 31; p < 0.0001). If we take into account the soluble metallic cations, the cation to anion ratio is close to 1, ensuring the neutrality of the particles.
In order to deal with the main characteristics of each monitoring site in terms of PM10 composition, in Figure 5 we have summarized some of the typical tracers for different sources. As seen in Figure 5a, a typical PM component such as sulfur was found to be homogeneously distributed among the sites during the specific annual campaigns, showing almost double concentrations in 2006 with respect to the period 2008-2010. Figure 5b displays year- and site-dependent concentrations of calcium, a typical mineral dust element. In this case, the highest concentrations were recurrently observed in Av. Ossa during the first two years, probably due to local influences such as construction activities. Thereafter, Ca concentrations remained comparable in all sites. Figure 5c shows year- and site-dependent concentrations of vanadium and nickel, as traces of fuel-oil combustion. This particular PM source seems to be of a regional nature, with a slight enrichment towards La Pintana in the first two years, probably due to the location of some industries in which heavy oil combustion occurs. A common brake-wearing trace component, antimony, is presented in Figure 5d. Concentrations of this element were clearly shifted towards urban sites (CR and OSS) rather than the surburban area (LP), with rather stable values from 2006 to 2010, maybe slightly increasing in paralell to the vehicle fleet increase. In Figure 5e we plotted Zn concentrations as an abudant trace element with multiple origins. Industrial and non-exhaust traffic emissions contribute to ambient air concentrations of this trace metal. As seen in the graph, the highest concentrations occurred alternatively in La Pintana in 2008, probably connected to industrial pollution plumes, in Av. Ossa in 2006, or in Cerrillos in 2008 and 2010, mostly related to vehicular emissions. To conclude this section, Figure 5f displays arsenic concentrations, selected as a tracer of industrial emissions. In all sites, but especially in the suburban-industrial site of La Pintana, arsenic concentrations were high (11-43 ng m-3), and considering the European standard for this element (6 ng m-3), control measures should be urgently adopted.
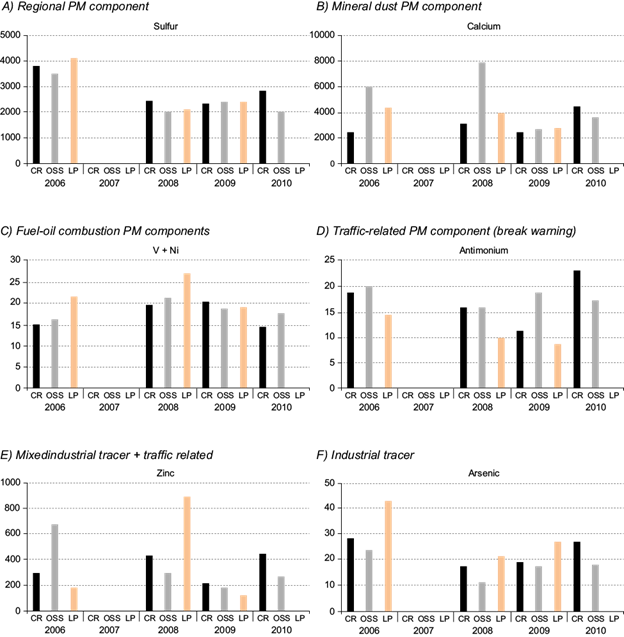
Fig. 5 Temporal and spatial variation of PM10 components associated to important emission sources present in Santiago during May in the years 2006-2010: (a) regional PM component, (b) mineral dust PM component, (c) fuel-oil combustion PM components, (d) traffic-realted PM component (brake wearing), (e) mixed industrial tracer + traffic related component, and (f) industrial tracer.
3.3 Cluster analysis: main associations of major and trace PM components
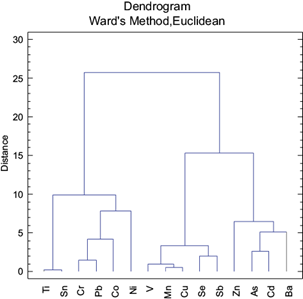
Our database was not large enough to perform a classical source apportionment analysis. However, alternative statistical treatments such as a cluster analysis may allow us to know the main associations among the elements determined in this study. To this end, we merged all data in a single database and a dendrogram was obtained. The results are shown in Figure 6, where two big groups of elements are separated. The first one, subdivided into two groups, contains Ti and Sn on one hand, and Cr, Pb, Co and Ni on the other. These associations are related to anthropogenic activities, probably fuel-oil combustion emissions (Ni, Co, Pb, Cr, as seen by Pey et al., 2013) and certain industrial processes (Ti and Sn). The second group of elements is, at the same time, subdivided into two other associations, being the first one characterized by V, Mn, Cu, Se and Sb, which are rather coincident with non-exhaust vehicular emissions from brake and tire abrasion (Pacyna, 1998; Amato et al., 2009; Pey et al., 2010), and the second one by the presence of Zn, As, Ba, and Cd, which are mostly linked to industrial processes (Querol et al., 2007); however Ba, and to a lesser extent Zn, are also related to vehicular non-exhaust emissions (Amato et al., 2011). Overall, the dendrogram analysis revealed different anthropogenic emission sources in the Santiago metropolitan area, separating two main groups of particles: one from industrial-related processes and another one more related to vehicular emissions, but somewhat mixed with industrial influences. According to the 2014 emissions inventory, 20% of the PM10 in Santiago is due to industrial sources, 30% to wood burning, 3% to agricultural burning, and 44% to mobile sources (MMA, 2014). An extended study covering all seasons and incorporating other chemical determinations would be desirable to fully investigate the real sources and their contributions, which is absolutely necessary to develop and implement adequate mitigation strategies.
3.4 Soluble elements
PM10 samples were subjected to water extraction to determine the degree of solubility of major and trace metals in order to determine its lability in Santiago’s atmosphere.
Table III shows monthly average concentrations for each site and year of major and trace elements. By combining the information presented in Tables I and III we were able to prepare Figure 5, in which the soluble/insoluble partitioning mass concentration of each of the elements determined in this study is shown. After sulfur, clearly shifted towards the soluble fraction (> 90% of the total mass was found as soluble compounds), specific trace elements such as Ba, Sb, Cd, As, and Zn displayed a significant water-soluble content, with 50% to 73%. Keeping in mind that some of these elements are considered toxic and/or carcinogenic (As, Cd and Zn) to human beings (Hughes, 2002; Lafuente, 2013), our results are even more relevant. It has been found that the urban atmosphere of Santiago is highly enriched in trace elements, some of them highly soluble and therefore with a higher toxicological potential with respect to other less soluble or practically insoluble. On the other hand, Al, Mg, Zr, Ti, Sn, Cr, and Pb showed a preference for the non-soluble fraction, with relative abundances of 75-99%.
Table III Monthly average of water soluble elements concentrations (ng m-3)in atmospheric PM10 of Santiago.
| Cerrillos | Av. Ossa | La Pintana | |||||||||||
| 2006 | 2008 | 2009 | 2010 | 2006 | 2008 | 2009 | 2010 | 2006 | 2008 | 2009 | |||
| S | 3760 ± 1698 | 2240 ± 522 | 2299 ± 278 | 2536 ± 8 | 3273 ± 1542 | 1847 ± 404 | 2315 ± 475 | 1823 ± 15 | 3048 ± 1469 | 2036 ± 464 | 2279 ± 243 | ||
| Ca | 1338 ± 397 | 1923 ± 470 | 1773 ± 146 | 2747 ± 33 | 1887 ± 662 | 1851 ± 424 | 1989 ± 283 | 1901 ± 7 | 2608 ± 682 | 2225 ± 852 | 1898 ± 467 | ||
| K | 763 ± 236 | 785 ± 239 | 521 ± 56 | 767 ± 11 | 687 ± 173 | 567 ± 127 | 507 ± 0 | 425 ± 3 | 889 ± 259 | 654 ± 53 | 684 ± 0 | ||
| P | 233 ± 72 | 354 ± 24 | 991 ± 126 | 179 ± 5 | 241 ± 102 | 326 ± 22 | 1108 ± 103 | 1088 ± 22 | 272 ± 38 | 351 ± 22 | 1019 ± 104 | ||
| Zn | 312 ± 101 | 338 ± 123 | 138 ± 3 | 344 ± 1 | 190 ± 93 | 134 ± 26 | 119 ± 3 | 140 ± 4 | 136 ± 47 | 103 ± 24 | 108 ± 50 | ||
| Fe | 151 ± 41 | 160 ± 52 | 170 ± 11 | 134 ± 2 | 163 ± 70 | 153 ± 24 | 243 ± 26 | 256 ± 5 | 102 ± 32 | 97 ± 35 | 146 ± 34 | ||
| Mg | 110 ± 22 | 147 ± 27 | 163 ± 3 | 218 ± 2 | 132 ± 40 | 130 ± 25 | 171 ± 24 | 168 ± 1 | 178 ± 51 | 135 ± 35 | 149 ± 35 | ||
| Al | 97 ± 15 | 107 ± 33 | 99 ± 11 | 92 ± 1 | 102 ± 7 | 103 ± 0 | 114 ± 9 | 107.5 ± 0.2 | 107 ± 43 | 96 ± 0 | 106 ± 26 | ||
| Ba | 61 ± 16 | 54 ± 10 | 35 ± 11 | 73.1 ± 0.7 | 102 ± 31 | 63 ± 13 | 58 ± 2 | 61.2 ± 0.2 | 31 ± 7 | 22 ± 6 | 20 ± 3 | ||
| Cu | 59 ± 12 | 71 ± 13 | 33.0 ± 0,1 | 73 ± 1 | 62 ± 16 | 56 ± 12 | 44 ± 2 | 52.2 ± 0.2 | 41 ± 9 | 29 ± 10 | 18.7 ± 0.5 | ||
| Mn | 43 ± 13 | 50 ± 8 | 39 ± 5 | 57.4 ± 0.6 | 46 ± 16 | 47 ± 11 | 43 ± 3 | 38.0 ± 0.3 | 51 ± 17 | 36 ± 7.0 | 35 ± 6 | ||
| As | 21 ± 8 | 12 ± 3 | 14 ± 3 | 18.75 ± 0.08 | 17 ± 8 | 9 ± 4 | 12.5 ± 0.4 | 13.0 ± 0.2 | 33.0 ± 17.0 | 1.0 ± 5 | 19.8 ± 0.9 | ||
| Pb | 28 ± 5 | 13 ± 6 | 7 ± 1 | 15.4 ± 0,4 | 12 ± 6 | 5 ± 1 | 2.82 ± 0.04 | 2.53 ± 0 .06 | 7.0 ± 3.0 | 6.0 ± 1 | 4.1 ± 0.4 | ||
| Sb | 10 ± 3 | 8 ± 2 | 6.6 ± 0.5 | 10.6 ± 0.1 | 9.0 ± 3.0 | 7.0 ± 2.0 | 8.7 ± 0.7 | 8.32 ± 0.06 | 0.07 ± 1.0 | 5.6 ± 0.7 | 5.0 ± 1.0 | ||
| V | 3.7 ± 1.0 | 7.0 ± 2.0 | 2.6 ± 0.4 | 2.055 ± 0.007 | 3.0 ± .01 | 4.9 ± 1.0 | 1.9 ± 0.5 | 1.41 ± 0.01 | 4.8 ± 1.7 | 11.0 ± 3 | 2.0 ± 0.4 | ||
| Cr | 1.7 ± 0.4 | 1.7 ± 0.5 | 2.4 ± 0.7 | 1.61 ± 0.06 | 2.0 ± 1 | 2.0 ± 0.2 | 2.2 ± 0.4 | 2.3 ± 0.5 | 0.4 ± 0.4 | 0.6 ± 0.3 | 1.44 ± 0.03 | ||
| Ni | 1.5 ± 0.4 | 2.1 ± 0.6 | 1.0 ± 0.2 | 1.17 ± 0.01 | 1.5 ± 0.5 | 1.5 ± 0.2 | 0.8 ± 0.1 | 0.82 ± 0.01 | 2.0 ± 1 | 2.4 ± 0.8 | 0.6 ± 0.1 | ||
| Se | 2.0 ± 0.3 | 2.2 ± 0.3 | 1.9 ± 0.2 | 3.33 ± 0.04 | 1.4 ± 0.3 | 1.6 ± 0.3 | 1.5 ± 0.3 | 1.8 ± 0.1 | 1.5 ± 0.5 | 1.2 ± 0.1 | 1.2 ± 0.3 | ||
| Rb | 1.4 ± 0.4 | 1.7 ± 0.4 | 0.9 ± 0.1 | 1.50 ± 0 | 1.1 ± 0.4 | 1.2 ± 0.2 | 0.84 ± 0.06 | 0.79 ± 0.007 | 1.3 ± 0.4 | 1.1 ± 0.4 | 1.0 ± 0.2 | ||
| Cd | 1.2 ± 0.2 | 1.0 ± 0.2 | 0.7 ± 0.2 | 0.995 ± 0.007 | 0.8 ± 0.4 | 0.44 ± 0.09 | 0.48 ± 0.03 | 0.41 ± 0.03 | 0.9 ± 0.2 | 0.66 ± 0.08 | 0.7 ± 0.2 | ||
| Ti | 0.8 ± 0.3 | 0.8 ± 0.3 | 1.3 ± 0.1 | 0.76 ± 0.06 | 0.8 ± 0.3 | 0.9 ± 0.1 | 2.0 ± 0.1 | 1.64 ± 0.01 | 1.2 ± 0.4 | 1.0 ± 0.3 | 1.0 ± 0.2 | ||
| Sn | 0.9 ± 0.3 | 0.6 ± 0.3 | 1.17 ± 0.03 | 0.39 ± 0.04 | 0.6 ± 0.3 | 0.7 ± 0.2 | 0.90 ± 0.07 | 0.91 ± 0.04 | 0.31 ± 0.09 | 0.5 ± 0.2 | 0.36 ± 0.05 | ||
| Co | 0.4 ± 0.2 | 0.33 ± 0.08 | 0.31 ± 0.01 | 0.56 ± 0.01 | 0.3 ± 0.1 | 0.31 ± 0.06 | 0.31 ± 0.04 | 0.33 ± 0.01 | 0.42 ± 0.08 | 0.31 ± 0.06 | 0.26 ± 0.04 | ||
Comparing our results from the Cerrillos station with those obtained by Richter et al. (2007), the solubility percentages are quite comparable (As, 70% soluble in our study against 60% in the aforementioned article; Pb, about 15% in our work against 40% in the previous decade).
The results on solubility, besides providing information on the lability in the respiratory system, may give some indications about possible chemical states of the species, i.e., the kinds of salts present in PM. For example, water-soluble Zn is usually found in the form of zinc sulfate, while in the residual fraction it is commonly found as zinc oxide, frequently joined with Fe and Mn, carbonates, or aluminates (Dos Santos et al., 2009). Likewise, water-soluble Cu is usually encountered as copper sulfate, while the residual fraction is mostly linked to sulfides or silicates.
Overall, the atmosphere of Santiago is rich in soluble and insoluble major and trace metals. Most of them are associated with industrial and road-traffic emissions, especially non-exhaust emissions from brake and tire wearing and pavement abrasion. Santiago’s inhabitants are exposed to high heavy metal concentrations, at least during the cold season.
The amount of soluble major and trace elements together with the amount of typical anions and cations (Tables II and III) is near 50% of the PM10 mass.
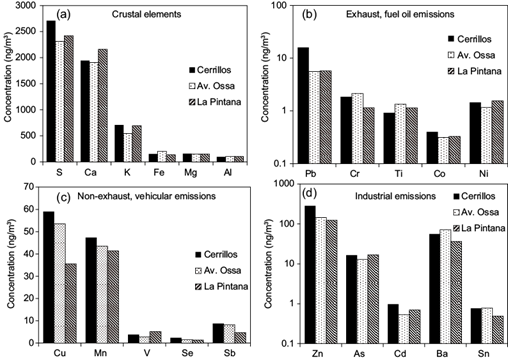
The results from the cluster analysis in Figure 6 give an approximate composition of the sources responsible for the measured PM. Figure 8 gives the concentration of soluble elements according to these sources separated according to the sites. It is found in Figure 8a that La Pintana has a higher concentration of crustal elements (Ca, K, Mg and Al), which is due to the fact that this site is located towards the south of Santiago (see Fig. 1), far from downtown, thus it receives more influence from rural environments. Exhaust and fuel oil emissions do not show a preferred trend and all stations have similar concentrations from this source. This figure indicates that exhaust emissions are well distributed over the city, which can be explained because mobile sources are spread out. Non-exhaust vehicular emissions seem to be higher in Cerrillos although Cu and Mn could also be generated in industrial processes. Industrial emissions are shown in Figure 8d, which also seem to be higher in Cerrillos. This can be explained because in this sector there are several large industries and many small auto repair and paint shops.

4. Conclusions
The inhabitants of Santiago are exposed to high PM10 pollution, which ranged from 71 µg m-3 (Cerrillos) to 128 µg m-3 (La Pintana), associated mainly with the vehicular traffic present in the city. In Santiago the central and peripheral urban zones are subjected to the same levels of PM10 and its heavy metal load.
The levels of As and Cd, which are reported to be toxic to human health, had high solubility in PM10, showing that breathable PM10 is very noxious to the inhabitants of Santiago. The As levels exceed the environmental quality standard. One of the sites (Cerrillos) was clearly influenced from industrial sources because it had higher levels of Zn, As and Cd.
The soluble or labile fraction, which is the really important one regarding breathable pollution, had high levels of the species in the form of nitrates, chlorides, and sulfates of Cd, Zn, Ba, As, and Sb. The soluble fraction of Ba, Sb, Cd, As, and Zn, which are generated mainly from industrial sources, ranged from 50% to 73%. The chemical species associated with Zn and with NO3 - were the most soluble.
These results call for a long-term study of PM composition and sources in Santiago which will serve a double purpose: (1) surveillance of the government air quality mitigation plan and its effectiveness, and (2) creation of a database for further epidemiological studies including sources and/or chemical species and their contributions.

