


 text new page (beta)
 English (pdf)
 Article in xml format
 Article references
 Send this article by e-mail
 Cited by SciELO
  Similars in
SciELO
Similars in
SciELO 
 Permalink
1. Introduction
Land use/land cover change (LULCC) reflects a complex interplay between socio-economic and environmental factors (Bajocco et al., 2012), often entailing land degradation processes due to unsustainable land use (Romm, 2011). LULCC is a key driver of global change, with major impacts on ecosystems and the human sphere (Foley et al., 2005). Changes in land surface also affect regional atmospheric circulation and large scale moisture fluxes, which in turn alters land exposure to the effects of climate variability (Sivakumar, 2007). The synergy between LULCC and climate has become of increasing importance under the context of global climate change, which projects increases in both the frequency and intensity of extreme climate events (ECE), such as droughts, floods, tropical storms, frosts, and heatwaves (Easterling et al., 2007; IPCC, 2013). The feedbacks between LULCC and climate change have the potential to disrupt established land use systems and ecological services, and amplify negative impacts of both land degradation and ECE on the adaptive capacity of human populations and ecosystems (Clarke and Rendell, 2007; Mantyka-Pringle et al., 2015; Barros et al., 2016; Findell et al., 2017). Although all regions are sensitive to the joint effects of LULCC and climate change, perhaps none more so than arid and semi-arid regions, where high temperatures and limited rainfall heighten the risk of desertification (IPCC, 2007). In addition, these regions sustain approximately 40% of the worldwide population, and are currently facing land degradation processes due to intensive LULCC (Reynolds et al., 2007; Bestelmeyer et al., 2015). Therefore, it is of increasing interest to consider LULCC and the impacts of ECE in arid and semi-arid regions, where changes in the frequency and intensity of extreme events will enhance land degradation processes like landslides, soil erosion and soil salinization (Berg et al., 2016; Huang et al., 2017). In Mexico, approximately 60% of its territory falls in arid and semi-arid regions (Montaño et al., 2016) classified into five distinct ecoregions due to their differences in ecological and climate patterns (Olson et al., 2001): the Sonoran (SO) and the Chihuahuan (CH) arid ecoregions; the Tamaulipan (TA), the Mexican High Plateau (HP) and the Tehuacán-Cuicatlán valley (TC) semi-arid ecoregions. Together they encompass 639 881 km2 from the central portion of the territory to the north, along the border of the United States. Although ecosystems in arid and semi-arid ecoregions occupy the largest extent of the Mexican territory, they are relatively understudied, both in terms of their biotic and abiotic processes (Flores-Olvera, 2011). Land cover in these ecoregions continues to undergo profound changes due to the development of crop and livestock farming: a quarter of the national agricultural products are cultivated in these ecoregions, while one out of three kilograms of meat is produced here (SAGARPA, 2014). Official cartography generated by the Instituto Nacional de Estadística y Geografía (National Institute of Statistics and Geography, INEGI) of Mexico has been essential in monitoring LULCC in Mexico through the years, as reflected by recent efforts to characterize human impacts at the ecoregion level in the country (González-Abraham et al., 2015). In turn, exposure to ECE is monitored by the Centro Nacional de Prevención de Desastres (National Centre for Disaster Prevention, CENAPRED), which generates publicly available geographic information that maps differences in exposure to diverse ECE throughout the territory (CENAPRED, 2012, 2016). However, few studies have researched how LULCC map onto ECE, and the role of climatic variability as another driving force of land degradation and a potential amplifier of its effects in arid and semi-arid ecoregions (although, see Englehart and Douglas, 2004; CONAFOR-UACh, 2013; Mateos et al., 2016).
In this study, we characterize LULCC from 2002 to 2011 (the most recent data publicly available) in the arid and semi-arid ecoregions of Mexico, to determine differences in the spatial extent of human land use during this period. In addition, we describe the current state of exposure to ECE in these ecoregions: drought, tropical cyclones, low temperatures and flooding. Finally, we synthesize the findings of diverse studies regarding observed trends in temperature and precipitation in the arid and semi-arid ecoregions of Mexico. With these, we aim to identify possible synergies between these drivers and contribute to generate information that enhances policy-making processes in the arid and semi-arid ecoregions in Mexico.
2. Methods
2.1 Study site: arid and semi-arid ecoregions of Mexico
The arid and semi-arid ecoregions were defined according to the regionalization proposed by the Comisión Nacional para el Conocimiento y Uso de la Biodiversidad (National Commission for Biodiversity Knowledge and Management, CONABIO), which is in turn based on the classification used by the Commission for Environmental Cooperation (CEC). As a spatial unit, ecoregions are a useful departure point to inform management policies, as they are both environmentally and ecologically distinct (Olson and Dinerstein, 2002). The polygons defining these ecoregions were obtained in shapefile format from CONABIO (2008) and are presented in Figure 1. Each ecoregion is characterized by differences in temperature and precipitation, and distinct vegetation types. Table I presents a summary of these differences.
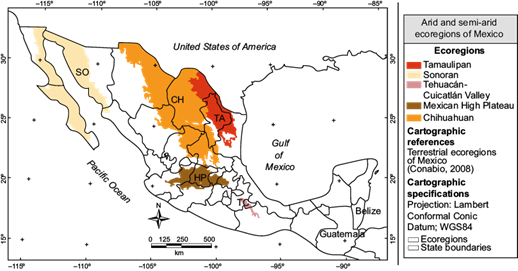
Fig. 1 Map of the arid and semi-arid ecoregions defined by CONABIO: the Sonoran (SO) and the Chihuahuan desert (CH) arid ecoregions; and the Tamaulipan (TA), the Mexican High Plateau (HP) and the Tehuacán-Cuicatlán valley (TC) semi-arid ecoregions.
Table I Description of current climate in each arid and semi-arid ecoregion of Mexico (area, precipitation regime, mean annual precipitation and temperature, and vegetation).
| Sonoran | Chihuahuan | Tamaulipan | Mexican High Plateau | Tehuacán-Cuicatlán valley | |
| Area (km2) | 231 635 | 326 000 | 10 425 | 66 921 | 4900 |
| Precipitation regime | Bi-modal (summer and winter rains) | Summer rains | Spring and to a lesser extent autumn rains | Summer rains | Summer rains with midsummer drought |
| Mean annual precipitation (mm yr-1) | 383 | 474 | 700 | 685 | 881 |
| Mean annual temperature (°C) | 22 | 19 | 20 | 17 | 23 |
| Vegetation | Cacti, succulents and arborescent woody species are common. Bimodal precipitation regime allows for two flowering seasons each year. | Vegetation is dominated by grasslands and shrubs. Plant bloom occurs following the summer rains. | Thorny bushes dominate as vegetation type, with oak and oak-pine forests in high elevations. | Tropical deciduous forests, grasslands and mesquite forests are present in this ecoregion; however, little remains of the original vegetation types. | Tropical deciduous forests and scrublands dominate in this ecoregion. Endemic species are notable in this area, especially of the Cactacea and Agavacea family. |
2.2 LULCC from 2002 to 2011
To analyze LULCC processes we focused on two of the land use and vegetation maps generated by INEGI. INEGI provides maps of land use and land cover (named Series) which are geospatial databases in vector format, generated from Landsat image classification and validated in the field. The accuracy of these maps is determined by their scale (1:250 000) and resolution (1 m) (INEGI, 2011). The Series contain information on natural vegetation types and land use. At present, five Series have been elaborated. In this study we used the maps corresponding to the 2002 (Series III) and 2011 (Series V) sampling periods, which we obtained in shapefile format from INEGI’s website. To analyze LULCC over the selected period in arid and semi-arid Mexican ecoregions, we first clipped the Series layers (Series III [INEGI, 2002], Series V [INEGI, 2011]) with the ecoregion layer (CONABIO, 2008); then we performed a geographical intersection between the series layers to obtain the change in land cover polygons and estimate vegetation loss. All geospatial processing was performed using ArcGis (v.10.3; ESRI, 2014).
2.3 Extreme climatic events (ECE)
To characterize exposure to ECE in the ecoregions of interest we used hazard indices to flood, drought, tropical cyclones and low temperatures generated by CENAPRED (2012, 2016). These indices measure the exposure to different ECE, expressed in terms of their frequency and intensity during a defined period. The latter information is aggregated at the municipal level, to generate an overall score for the municipality. Score categories range from “very low” (ECE have historically occurred at a low frequency and intensity) to “very high” (ECE have historically occurred at a high frequency and intensity), with intermediate categories (low, medium, high) representing combinations of increasing intensity and frequency. Briefly, the index for tropical cyclones estimates the exposure to these events in terms of both their frequency and intensity (according to the Saffir-Simpson scale) for the period 1949-2010. Exposure to low temperatures is given in terms of extreme minimum temperatures, number of days with freezes, and number of climate disaster declarations due to freezing temperatures, accounting for events from 1970 to 2010. The drought index expresses the duration of periods with precipitation deficits (ranging from 0-40% precipitation deficit and durations in the range of an average between 1-4 yrs) relative to mean annual precipitation (calculated for the period 1940-2000). Finally, exposure to flooding is expressed in terms of the proportion of the territory of the municipality that falls in flood-prone areas. For a more detailed account of how each index was constructed, refer to the original source (CENAPRED, 2012, 2016).
Exposure indices to each of the aforementioned ECE were obtained as shapefiles from CENAPRED and processed with ArcGis (v.10.3, ESRI, 2014) to extract only the municipalities that fell within the limits of the ecoregions of interest. Using these indices, we constructed exposure profiles to drought, tropical cyclones, floods and low temperature for each ecoregion. To explore the extent in which each ecoregion is affected by ECE of high intensity and frequency (i.e., the high and very high scores of CENAPRED’s indices) we calculated the area percentage of the ecoregion occupied by municipalities with these scores (adjusting for municipalities whose polygon did not fall entirely within the ecoregion).
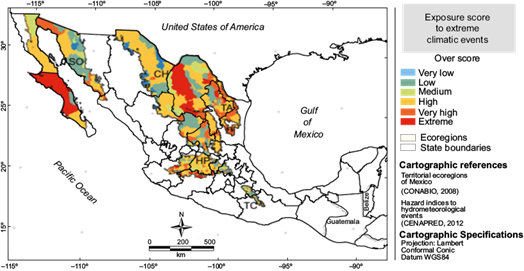
We present a map of the overall current exposure to ECE for municipalities that belong to the studied ecoregions. Thus, the spatial unit of analysis for our study is the municipality. To produce this result, we assigned a score to each of the municipalities within the ecoregions of interest, based on their exposure to each separate ECE according to CENAPRED indices. Depending on their exposure category and the number of events with a given exposure category, we generated five possible overall exposure scores: extreme, very high, high, medium, low and very low, and assigned a score to each municipality. Criteria for each score are summarized in Table II.
Table II Criteria for overall exposure to extreme climatic events score
| Score | Criteria |
| Extreme | Exposure to drought, tropical cyclones, floods and freezes is either high or very high for at least three of the events. |
| Very high | Exposure to drought, tropical cyclones, floods and freezes is either high or very high for two of the events, with a medium exposure to at least one of the events. |
| High | Exposure to drought, tropical cyclones, floods and freezes is medium, high or very high for at least two of the events. |
| Medium | Exposure to drought, tropical cyclones, floods and freezes is medium or high for only one of the events. |
| Low | Exposure to drought, tropical cyclones, floods and freezes ranks from very low to medium. |
| Very low | Exposure to drought, tropical cyclones, floods and freezes ranks from very low to low |
2.3 Literature review of climate trends in arid and semi-arid ecoregions of Mexico
Changes in frequency, duration or intensity in events or climatic variables that alter the precipitation regime or temperature will affect water availability in arid and semi-arid ecoregions. Documenting the current trends in these events and variables is essential to determine climate stressors in these environments. To this purpose, we reviewed the current knowledge on temperature, precipitation, tropical cyclones, heat waves, freeze, and droughts trends for each of the ecoregions of interest. We searched the Web of Knowledge, SciELO, official reports and dissertation documents archived in the Universidad Nacional Autónoma de México (National Autonomous University of Mexico, UNAM) repository using the following keywords: climate AND variability AND trends, as well as precipitation, temperature, extreme climatic/climate events, droughts, freezes, heat waves and tropical cyclones. The search was conducted both in Spanish and in English. We combined the aforementioned keywords with the following, to narrow down the location to our regions of interest: semidesert AND desert AND arid AND semi-arid AND Mexican, as well as the following keywords for location: Sonoran, Chihuahuan, Tamaulipan, Mexican High Plateau and Tehuacán-Cuicatlán valley, and their equivalents in Spanish. We also used filters on our searches to limit results to the country of interest (Mexico and the USA, given the trans boundary extent of the arid northern ecoregions). We focused on studies that analyzed trends in the recent past (500-30 yrs), and excluded those that dealt with projected trends.
3. Results
3.1 LULCC from 2002 to 2011
In 2011, land uses in the arid and semi-arid ecoregions consisted mainly of agricultural activities, particularly in the HP and TC semi-arid ecoregions (Fig. 2). Another dominant land use was livestock production for the TA semi-arid ecoregion, and to a lesser extent for the SO arid ecoregion. Although the five ecoregions presented urban areas and human settlements, in the HP and the TC, settlements occupy a larger extent of the land (Fig. 2).
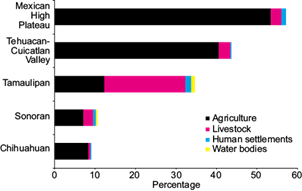
Fig. 2 Percentage of land use in each ecoregion divided in four categories. The x axis only shows the percentages of land cover occupied by human activities and settlement. Natural vegetation cover is not shown, since we wanted to emphasize the extent of land use (Series V; INEGI, 2011).
From 2002 to 2011, arid and semi-arid ecoregions lost 22 930 km2 of their natural vegetation to agriculture, livestock production and the development of human settlements. The HP was the ecoregion with the highest percentage of LULCC, followed by TA, TC, SO and finally CH (Fig. 3). The spatial distribution of land uses in 2011 and changes in vegetation cover from 2002 to 2011 differs between ecoregions (Fig. 4):
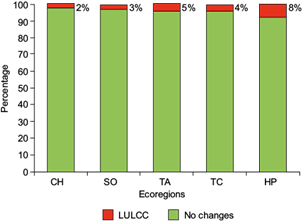
Fig. 3 Percentage of areas of change during the period 2002-2011 (marked in red), and percentage of areas with no change (shown in green).
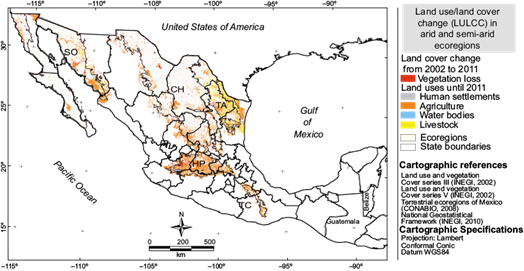
Fig. 4 Map of land use within the five arid and semi-arid ecoregions of Mexico, showing the main anthropic activities until 2011 and changes in vegetation from 2002 to 2011.
In the SO arid ecoregion, agricultural activities mainly develop in the north and south of the Baja California peninsula, as well as the center and south of Sonora. In the same ecoregion, our analysis shows vegetation losses in the south and center of Sonora (Fig. 4).
In the CH arid ecoregion, we observed patches of agricultural activity in the southern part of the ecoregion, as well as in the central and northwestern zones; these same areas lost vegetation to agricultural activities, which increased during the period from 2002 to 2011 (Fig. 4).
The TA semi-arid ecoregion stands out mainly because of its high livestock production in the central and southern areas. Vegetation losses and land use change have occurred mainly in the north (Fig. 4).
The HP semi-arid ecorregion is characterized by a dominance of agricultural systems, and large areas occupied by human settlements (both rural and urban) throughout the ecoregion. LULCC were mainly located in the northwest area, but it is important to highlight that these changes are observed throughout all region (Fig. 4).
The TC semi-arid ecoregion is also strongly impacted by agricultural systems, mainly in the northern and in the southern zones; the vegetation loss and land use changes in this ecoregion occurred mainly in the northwest (Fig. 4).
3.2 Exposure to extreme climatic events (ECE) in arid and semi-arid ecoregions
Each ecoregion has a characteristic exposure profile in terms of the aggregated exposure score of municipalities that fall within the territory of each ecoregion (Fig. 5). It is important to remember that this score does not consider variability in exposure to ECE within the territory of the municipality or the ecoregion, but assigns an overall exposure score to each municipality, based on frequency and intensity of ECE. In this sense, we consider exposure to ECE in the ecoregion in terms of the exposure scores assigned to the municipalities that fall within each ecoregion. Thus, if a particular ecoregion has a high proportion of municipalities with a high exposure score to a particular ECE, we will refer to the ecoregion as having a large proportion of its territory exposed to the ECE in question; however, variability in exposure at a fine scale is not considered.
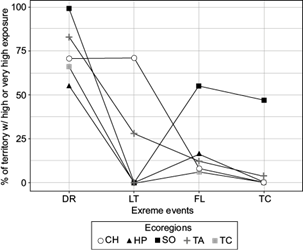
Fig. 5 Exposure profiles to extreme events by ecoregion. DR: droughts, FL: floods, LT: low temperatures, TC: tropical cyclones. Only two exposure categories, “high” and “very high”, were considered for this analysis. Note that the proportion of territory exposed was calculated in terms of the aggregated exposure scores generated at a municipal level by CENAPRED.
Droughts affect over 50% of the territory of all the ecoregions of interest, thus they are the predominant ECE in arid and semi-arid ecoregions of Mexico. Furthermore, they occur with both long duration and high precipitation deficits. In the SO ecoregion, 99% of its extent is exposed to these conditions. Only the ecoregions that are close the coast are directly exposed to the passage of tropical cyclones, and thus high exposure to them, as is the case of the SO and TA ecoregions (Fig. 5). However, the heavy rainfall associated with these events can produce extensive flooding and indirectly affect more remote areas. All the arid and semi-arid ecoregions have some percentage of their territory (under 20%) exposed to intense flooding, with the exception of the SO ecoregion, where 55% of the territory has high or very high exposure to intense floods. Extreme low temperatures affect over 70% of the CH ecoregion, and 28% of the TA. The rest of the ecoregions have very low proportions of their territory exposed to severe low temperatures. Thus, in the SO ecoregion, droughts, severe floods and tropical cyclones are the events that affect approximately half of its territory. For the CH ecoregion, low temperatures and floods are the main climate stressors. In turn, floods and droughts are the dominating extreme events in both the HP and TC semi-arid ecoregions. The TA ecoregion shows high exposure in varying proportion of its territory to all four extreme events.
In terms of overall exposure to extreme climate events, most of the territory in all of the ecoregions falls under the high exposure category, which means that they show medium to very high exposure to two of the events. All of the ecoregions, except for the TC, present high to extreme levels of overall exposure in over 65% of their territory, with the HP ecoregion presenting the largest proportion exposed (75%), followed by the TA (71%), the CH (67%) and finally the SO (66%). The SO ecoregion presents the highest proportion of territory under the extreme exposure category (23%), while the TA has the same proportion of territory under very high exposure. These two ecoregions have the highest proportion of territory under the very high to extreme scores (32 and 27%, respectively). In the case of the TC ecoregion, high exposure to extreme events occurs in 38% of its territory, concentrated towards the northern portion (Fig. 6).
3.3 Climate trends in arid and semi-arid ecoregions
There is a general trend towards increase in both mean maximum and mean minimum temperatures, as well as an increment in the duration and intensity of drought events (Table III). Trends in mean annual precipitation are not as generalizable, although a decreasing trend is observed in some portions of the central semi-arid ecoregions (HP and TC) and the northern portion of the TA ecoregion (Table III).
Table III Observed climate trends for mean, maximum, and minimum temperatures, heat waves, mean annual precipitation and drought events.
| Mean maximum temperature | Mean minimum temperature | Heat waves | Mean annual precipitation | Drought events | |
| Sonoran | ⇑ Reported data covers the extent of the ecoregion2, 3, 4, 6, 8 | ⇑ Reported data covers the extent of the ecoregion2, 3, 4, 8 | ⇑ Reported data covers the extent of the ecoregion3, 5, 6 | * Results for this trend differ between studies3, 8 | ⇑ Reported data cover the extent of the ecoregion1, 7, 15, 30 |
| Chihuahuan | ⇑ Reported data covers the extent of the ecoregion9, 10, 11, 12, 14, 16, but ⇓ in S portion9 | ⇑ Reported data covers the extent of the ecoregion9, 11, 12, 13, 14 | ⇑ Reported data covers the extent of the ecoregion11, 17 | NT | ⇑ Reported data cover the extent of the ecoregion7, 15, 16, 30 |
| Tamaulipan | ⇑ In the W portion19, but no clear trend for E18, 19, 20, 21, 22 | ⇑ In the W portion, but no clear trend for E18, 19, 20, 21, 22 | ⇑ Reported data covers the N portion of the ecoregion20 | ⇓ In the N portion, no information for trends on the rest of the ecoregion20, 21, 23 | ⇑ Reported data cover the extent of the ecoregion23 |
| Mexican High Plateau | ⇑ Reported data covers the extent of the ecoregion24, 25, 26 | ⇑ Reported data covers the extent of the ecoregion24, 25, 26. No clear trend for E portion26 | NI | ⇓ Results for this trend differ between studies , but decreases in E portion24, 25, 26, 29 | ⇑ Reported data covers the extent of the ecoregion30 |
| Tehuacán- Cuicatlán Valley | ⇓ In the N portion, positive trend observed in the rest of the ecoregion32 | ⇓ In the N portion, no information found for S portion32 | NI | ⇓ Decreasing in the S/SE portion, but increasing trend observed in the NE31, 32 | NI |
Note: the direction of the arrow indicates direction of the trend.
*Results differed between studies; NT: no trend detected at the ecoregion level for a given variable; NI: no found for the ecoregion.
1Cayan et al., 2010; 2García Cueto et al., 2014, 3Gutiérrez-Ruacho et al., 2010; 4Martínez Austria et al., 2014; 5Bandala and Austria, 2016; 6Martínez-Austria et al., 2016; 7Stahle et al., 2016; 8Weiss and Overpeck, 2005; 9Brito-Castillo et al., 2009; 10Campos-Aranda, 2015; 11Englehart and Douglas, 2004; 12Blanco et al., 2014; 13Medina-García et al., 2011; 14Santillán-Espinoza et al., 2011; 15Seager and Vecchi, 2010; 16Petrie et al., 2014; 17Westerling et al., 2006; 18Cruz Rico et al., 2015; 19Herrera-Salcedo, 2011; 20Hoerling et al., 2013; 21Salinas-Castillo and Treviño-Garza, 2002; 22Sánchez-Santillán et al., 2012; 23Seager et al., 2014; 24Velasco-Hernández et al., 2015; 25Barret and Longoria, 2013; 26Orozco et al., 2016; 27Herrera-Pantoja and Hiscock, 2015; 28Magallanes-Quintanar et al., 2015; 29Méndez-González et al., 2008; 30Seager et al., 2009; 31Peralta-Hernández et al., 2009; 32Secretaría de Sustentabilidad Ambiental y Ordenamiento Territorial, 2011.
Availability of information was highly variable between ecoregions; the northern ecoregions (SO, CH, TA) had more information available regarding climate trends. Many of these studies were developed close to the border between the USA and Mexico, given both the political and ecological importance of this area. In contrast, information for the central semi-arid ecoregions (HP and TC) was scant, particularly regarding trends in precipitation and drought, despite both the ecological and agricultural importance of these ecoregions.
4. Discussion
Climatic stressors degrade the condition and viability of an ecosystem through excessive or insufficient regimes of temperature, moisture, solar radiation or a combination of these (EPA, 2008). Warmer temperatures and more variable rainfall regimes linked to climate change threaten the balance of ecological processes in arid and semi-arid ecosystems. In turn, human exploitation results in rapid land use change, while indiscriminate use of resources accelerates the degradation rate. Mexican arid and semi-arid regions face both intense human exploitation and are subject to climate stress; this combination could, in a short period of time, impact productive systems, and eliminate many micro-habitats and endemic species. In this study we found that the degree of degradation and land use differs for each ecoregion, and all of them (except for Tehuacán-Cuicatlán valley) have a high overall exposure to ECE. For each ecoregion we are going to highlight the dominant stressor (LULCC or ECE) and discuss how observed climatic trends could enhance these effects.
4.1 Sonoran (SO) arid ecoregion
The SO ecoregion is the hottest of the Mexican arid ecoregions. Although water availability and soil humidity limit the distribution of productive activities (Archer and Predick, 2016), agricultural activities are the dominant land use in this ecoregion. This activities occupy less than 10% of the total ecoregion’s area and are developed on the southern continental portion, which is in turn one of the most humid areas in the SO ecoregion (CONAGUA, 2010). Thus, anthropogenic impacts derived from agricultural activities are localized to certain portions of this ecoregion (Fig. 4). In contrast, the municipalities encompassed in this ecoregion are widely impacted by extreme events (Fig. 6). The literature for this ecoregion points towards an increase in warming (Table III), which is reflected as a rise in the frequency, duration and intensity of heatwaves (Martínez-Austria et al., 2016), and an increase in both maximum and minimum temperatures over the past 50 yrs (although this warming trend has not been observed in cities in coastal areas, possibly due to temperature modulation by the cold California current, see García-Cueto et al., 2014). In terms of precipitation, although some studies report a decline in mean annual rainfall, others present contrasting results (see Weiss and Overpeck, 2005; Gutiérrez-Ruacho et al., 2010). However, a decreasing trend has been described for winter precipitation as a result of poleward shifts of stormtracks (McAffee and Russell, 2008). Additionally, increased precipitation variability of the North-American monsoon has also been reported for the ecoregion (Polley et al., 2013). Thus, this ecoregion has a high overall exposure to climate stressors. Ecosystem dynamics in this ecoregion are critically influenced by climatic variability, given the dependence of rainfall pulses for plant growth and the extent of the territory affected by extreme events. Precipitation events in this ecoregion have bottom-up effects, where increased primary productivity causes subsequent increases up the trophic chain; in contrast, dry periods are dominated by top-down effects (although these effects are not necessarily lineal, see Holmgren et al., 2006). Climate change projections for this ecoregion point towards warmer and drier conditions in the future (Seager et al., 2009; García-Cueto et al., 2014; Polley et al., 2013). Thus, this is an ecoregion where the effects of increased climate variability, as projected by climate change models, could be more pronounced than in the other ecoregions, where human intervention of the landscape is the main stressor. Additionally, additive or synergistic effects of climate change are likely to aggravate the impacts of livestock and agriculture, the main activities in this ecoregion. These impacts will be more pronounced in areas where these activities develop, thus adaptive strategies should move towards more sustainable agricultural techniques and use of water resources.
4.2 Chihuahuan (CH) arid ecoregion
Unsustainable land use practices in this region have accelerated environmental degradation processes, such as soil erosion and loss of habitat; moreover, the increasing water demands from growing urban and rural communities have put pressure on this decreasing resource, by diverting it from its course through the ecosystems in this ecoregion to municipal water supplies or irrigation (Dinerstein et al., 2000). In addition, there is only one intense rainy season in the summer, with precipitation averaging 474 mm yr-1 (CONAGUA, 2010); therefore, the agricultural and livestock sector, which together account for approximately 10% of the total land use according to our analysis, depend heavily on irrigation (Dinerstein et al., 2000). These activities develop mainly towards the western boundary of the ecoregion, and are heavily concentrated in the central and southern portions (Fig. 4). We found that the municipalities encompassed within the territory of this ecoregion are largely affected by low temperatures and droughts (Fig. 5), events which occur with high intensity and frequency. Although a recent (post 1970s) warming trend for both the minimum and maximum temperatures has been reported in the northern portion (Table III), there are also observations of decreasing trends, particularly for maximum temperatures in the southern portion, notably for the state of Zacatecas (Brito-Castillo et al., 2009). No clear regional trends have been detected for mean annual precipitation (Table III), but a study by Petrie et al. (2014) mentions an observed increase in the frequency of rainfall events, accompanied by a decrease in their magnitude. In conjunction with climate projections (Seager and Vecchi, 2010; Mendoza-Hernández et al., 2013 ), this ecoregion is likely to transit to more arid conditions with increased drought likelihood (Magaña et al., 2012). Combined with the current and projected trends, this ecoregion is mainly at risk due to the combined effects of habitat degradation and climate on water availability.
4.3 Tamaulipan (TA) semi-arid ecoregion
Mexican arid and semi-arid ecosystems have been historically modified by humans (Challenger et al., 1998; García and Jurado, 2008; González-Abraham et al., 2015). The TA ecoregion is not exempt from this, as observed in the results section (Fig. 4). Návar-Cháidez (2008) investigated the impacts on carbon stock by land use changes in this ecoregion. He estimated that for the period 1980-1996, the TA presented an annual deforestation rate of 2.27%, indicating that approximately 600 km2 of thorny bush community were lost every year and that 60% of the original vegetation has been lost since the 1950’s. Intensive agriculture, including introduction of grasslands for livestock, increased from 32 to 42% of the total studied area, largely at the expense of the Tamaulipan thorn bushes. Under a climate change context, this author indicates that native vegetation loss in this ecoregion could contribute 2.2 Tg to current annual carbon emissions (Návar-Cháidez, 2008). We found a change in land cover of 10% in this ecoregion for the period 2002-2011 (Fig. 3). Some authors (e.g., Pequeño-Ledezma, 2013) and governmental reports (SAGARPA, 2009) described an intensive use of the region, particularly in Nuevo León state where livestock occupation is 5.5 million hectares (86% of the state surface). Pequeño-Ledezma (2013) found that many areas in Nuevo León used for livestock are abandoned when productivity decreases and it takes long periods (around 20-30 yrs) for natural restoration to happen. Hence, the TA ecoregion is mainly affected by human impacts, and poses a risk due to the potential release of considerable amounts of carbon to the atmosphere as a consequence of LULCC. In terms of exposure to ECE, the TA ecoregion fell on the high to extreme spectrum (Fig. 6). Droughts are the events that affect a larger extent of this ecoregion (Fig. 5). Increased duration and severity of these phenomena have been reported, accompanied by an increasing trend in heat waves, and in minimum and maximum temperatures (this trend has been confirmed in the western portion, see Westerling et al., 2006). For the mean annual precipitation trend there is no clear pattern, although a decrease in precipitation has been reported in the northern portion of the ecoregion (Table III). Even though other extreme climatic events are affecting the ecoregion, droughts are the events that affect its largest extent (Fig. 5). Neri and Magaña (2016) identified that meteorological droughts in arid and semi-arid regions have resulted in significant losses in the livestock sectors. Reports indicate drought-affected cattle ranching sectors, with a 1.3 million livestock heads (CENAPRED, 2012). These are important issues to address, as the main economic activity (livestock farming) of the ecoregion is at risk by changes in frequency of ECE, a potential scenario under climate change (IPCC, 2007, 2013).
4.4 Mexican High Plateau (HP) semi-arid ecoregion
The current landscape in the HP is mostly shaped by agricultural activities but also by the development of human settlements (Figs. 2, 4). HP is the ecoregion with the highest percentage of land change (Fig. 3). Natural vegetation in the HP ecoregion is restricted to the surrounding mountains and field margins, including irrigation channels. In this ecoregion, native vegetation has been removed to facilitate mechanization (Zuria and Gates, 2006). Land use in the HP has a long history that goes back to pre-Hispanic times, where polyculture systems with annual and perennial species dominated the landscape (Rojas-Rabiela, 1991); nevertheless, diverse agriculture techniques coexisted since many cultures had settled in the territory encompassed by this ecoregion (Kelly, 1933). Some of those techniques degraded the land, and together with climatic stressors, caused adverse conditions and many human groups emigrated (O’Hara et al., 1994). Some years later, Spaniards restructured agriculture through the introduction of European technologies, using the existing channels and dikes and constructing new ones, boosting new ways to prepare and cultivate the land, using iron tools like the plow, hoe, and shovel, planting new crops (wheat, citrus, peach, etc.), and establishing livestock (cattle, horses, donkeys, mules, sheep and goats) ranches (Romero-Frizzi, 1991; Whitmore and Turner, 1992).
Later, during the Mexican revolution (1910), a division of land property, the “latifundios” (large areas with one or few owners) were fragmented into small parcels and distributed among farmers as either private or social property (“ejidos” and “comunidades”) (Martínez-Saldaña, 1991). This fragmentation strongly impacted the intensity of land use for agricultural development in the HP ecoregion, due to the presence of El Bajío, a very fertile area irrigated by Rio Lerma (one of the most important rivers in Mexico). Since the 18th century, El Bajío has been recognized as the main grain-producing district of Mexico (Rodríguez-Gómez, 1984). Mine discoveries in sites close to the HP ecoregion in the 16th century accelerated the development of El Bajío as the food provider to mine workers, and to people who founded new settlements in this area. With the green revolution, a highly mechanized agriculture spread to all of the HP ecoregion (Gómez-Aíza et al., 2017).
Thus, in this ecoregion, LULCC drives degradation and desertification processes more than the climatic component. In addition, we found that most of the municipalities in the HP ecoregion are mainly exposed to droughts (Fig. 5). Climate trends reflect these patterns: an increasing trend for maximum temperatures in HP has been detected in recent decades (see Table III). A similar trend has also been reported for minimum temperatures, but only for some portions of the ecoregion (Orozco et al., 2016). An increase in the severity and duration of droughts has also been found in this ecoregion, as well as a significant trend in the increase of evaporation (Barret and Longoria, 2013). Trends reported for mean annual precipitation differ between studies, although a decreasing trend has been detected in the eastern portion (Orozco et al., 2016).
4.5 Tehuacán-Cuicatlán valley (TC) semi-arid ecoregion
The TC is a semi-arid region of central Mexico, recognized as a major reservoir of biological diversity (Dávila et al., 2002). The dominant land use in this ecoregion is agriculture (Figs. 2, 4). Our findings in the TC agree with a study published by Valiente-Banuet et al. (2006), who found an intensification in forest exploitation and agricultural and livestock production occurring along the TC, resulting in overexploitation of specific resources and progressive degradation of vegetation and agricultural lands, as well as the quality of life in rural communities. Also Moreno-Calles (2010) concludes in a research on agroforestry systems in the TC that both ecosystems and productive activities are at risk because of intensification of agriculture resulting in a loss of both vegetation cover and plant diversity, as well as soil and economic migration influencing cultural and land use changes. In comparison with the rest of arid and semi-arid ecoregions, municipalities in the TC ecoregion have the lowest exposure to ECE (Fig. 6), but decreasing trends in mean maximum and minimum temperatures have been detected in the northern portion of the ecoregion, accompanied by decreases in precipitation in the south/southeastern portion but increases in the north, which in turn has translated into a cooler and wetter northern portion (Table III). Trends in temperature and precipitation are not clear for the southern portion of this ecoregion, although there is mention of an increase in both the frequency and intensity of extreme rainfalls events in southern Mexico, where this ecoregion is located (Peralta-Hernández et al., 2009). Considering that this area is mainly dedicated to agriculture, precipitation parameters should be monitored closely due to its importance for this activity. Surprisingly, there are several gaps of information for this ecoregion regardless of its closeness to the country’s capital, and its status as a natural protected area (ANP).
5. Conclusions
LULCC processes have different origins in the five arid and semi-arid ecoregions in Mexico. Each ecoregion is facing a series of degradation processes that can be traced to pre-Hispanic times, like the HP; others have only recently begun to be intensively exploited, like the TA ecoregion. Although LULCC may seem small when shown in the context of the whole territory (Fig. 3), we must consider several aspects: (a) the assessed period was from 2002 to 2011 (only nine years of change), and (b) the scale of analysis was 1:250 000. Other scales like 1:50 000 would be more appropriate to identify more detailed changes driven by LULCC and ECE. A historical evaluation of the rate of LULCC would be valuable but the methodologies used to generate land use maps in previous editions of the Series are not comparable.
In this work we used public information and a deep literature review to summarize climatic trends in the arid and semi-arid ecoregions of Mexico, and how they could potentially be affected by ECE. Although more analysis at a finer scale are needed, this work presents the most recent information available in a spatially explicit form to understand which areas are the ones which have undergone most LULCC processes, and what are the ECE that are affecting specific arid and semi-arid ecoregions. This could help in planning for management and decision making in highly sensitive ecosystems that have been and will continue to be exposed to ECE.
Finally, it is well known that LULCC plays an important role in the climate system (Foley et al., 2003; Zhang and Schilling, 2006; Mahmood et al., 2014). Research over recent decades highlights the impacts of these changes on atmospheric temperature, humidity, and precipitation. These impacts range from the local and regional scale to continental and global scale. As we can appreciate this is a vicious circle where changes in one system affect the other. Therefore, conservation of arid and semi-arid ecosystems, rehabilitation of degraded areas and recovery of abandoned agricultural areas could be good alternatives to fight the negative effects associated to LULCC.
There is strong evidence that climate change will modify the intensity and frequency of ECE. Using data on droughts, floods, low temperatures and tropical cyclones as well as degradation in arid and semi-arid Mexican ecoregions, we: (a) defined overall exposure to ECEs and (b) pinpointed areas where LULCC overlap with high scores of ECEs impact. Although an ecoregions’ risk of negative impacts due to extreme climatic events depends not only on its exposure but also on its adaptive capacity and intrinsic sensitivity, identifying regions with high climatic exposure can help to identify areas where this synergy is happening and could have future impacts, and provide a more informed evaluation of current degradation status, to better guide management for a changing environment.

