


 text new page (beta)
 English (pdf)
 Article in xml format
 Article references
 Send this article by e-mail
 Cited by SciELO
  Similars in
SciELO
Similars in
SciELO 
 Permalink
1. Introduction
Stratospheric ozone is a gaseous atmospheric layer that protects humans and a wide diversity of living species from a specific range of ultraviolet radiation coming from the Sun. Years of investigation, since the middle 1970’s, have permitted to conclude that a large significant number of industrial processes that destroy the ozone shield is related to the production and release of chlorofluorocarbons (CFCs); this anthropogenic activity was suggested as a major agent affecting the ozone shield by Paul J. Crutzen, Mario J. Molina and Frank S. Rowland, who were awarded the Nobel Prize in Chemistry 1995 “for their work in atmospheric chemistry, particularly concerning the formation and decomposition of ozone” (Christie, 2001).
This paper shows that over all the ozone layer maintains the same behavior during the 37-yrs of satellite total ozone measurements, despite pollution and aerosol production from a vast variety of industrial installations in the city of Bogotá, which is an industrial center and the most populated city of Colombia, located very close to the equator and with a population of about eight million (DANE, 2016). In 2014 it was declared the 10th most contaminated city in Latin-America by the World Health Organization (WHO, 2016), reaching an overwhelming concentration of particles in air (52 and 24 µg m-3 of PM10 and PM2.5, respectively).
Stolarski and Frith (2006) warned about the lack of models to predict O3 after a huge range of total column ozone (TCO) measurements around the globe. Soukharev and Hood (2006) and Randel and Wu (2007), among others, have suggested that there is a close relationship between solar activity and stratospheric O3. If such a relationship is found, it would be possible to establish TCO tendencies and their possible causes to study the true effect of anthropogenic activity and establish the impact on humans and living species, as well as the after-effects on forest and agriculture practices. It could be a guide to verify experimental data, and assess the incidence of O3 on climatic changes.
The aim of this paper is to suggest a direct relationship between solar activity by means of sunspot cycles and TCO, based on the physical and statistical study of a data set of sunspot cycles dating back to 1818 (Hathaway, 2010) and 37-yrs of TCO measurements over Bogotá by the NASA satellite missions (McPeters, 2017) Nimbus 7, Meteor 3, Earth Probe and AURA (with the TOMS, SBUV/SBUV2, and OMI instrumentations). Also, to propose a physical-mathematical model to predict TCO over Bogotá relying on an 11-yr record of sunspot cycles.
2. Observational data
2.1. Total column ozone measurements
Bogotá belongs to the Intertropical Convergence Zone (ITCZ), where northeast and southeast winds merge. It is located within 4º39’ N, 74º09’ W, at an altitude of 2630 masl.
The measurement unit for TCO is the Dobson unit (DU), which corresponds to a columnar density of a gas in the Earth’s atmosphere. Under standard pressure and temperature (Schwartz and Warneck, 1995), a column of 300 DU of total ozone placed at the Earth’s surface represents a layer of 3 mm thickness with 8.07 × 10²² molecules m−2.
Data series are available from 1979 through August 2016. The longest data series was provided by the Nimbus 7 mission (1979-1993), with the best continuity on daily data for Bogotá. Since the Nimbus mission came to an end in 1993, only 30% of the daily data were recorded during that year. Data from the Meteor 3 mission had a huge gap from 1991 through 1994, its contribution for 1994 data was taken into account in this study. No satellite data were reported for 1995. Data sets from 1996 through 2007 were provided by the Earth Probe mission, in which only 30% of the 1996 data were recorded. The AURA/OMI mission, launched in 2004, has afforded data from 2004 to the present. Data from 2005 through August 2016 were taken into account in this study; despite its low continuity, it is acceptable for the purposes of this study.
2.2. Sunspot experimental data
Research groups around the world are relying on data to study the Sun cycles and, in general, to describe the Sun as a physical entity. This work depends on sunspot data records given by the World Data Center (SILSO, 2017) for the production, preservation and dissemination of the international sunspot number from 1818 to the present.
Figure 1 shows that behavior of the daily sunspot number from 1818 to the present exhibits a certain cycle. A study published by Hathaway (2010) on Sun cycles gave an estimated value of 11 yrs ±14 months for the sunspot cycle.

3. Relationship between the sunspot cycle and TCO
As shown in Figure 2, temporal data series of TCO for Bogotá seem to present a seasonal cycle, at least for 37 yrs, starting from 1979. All annual data series present cyclic behavior beginning with a minimum around January, rising up to a maximum in September and finally decreasing in December.
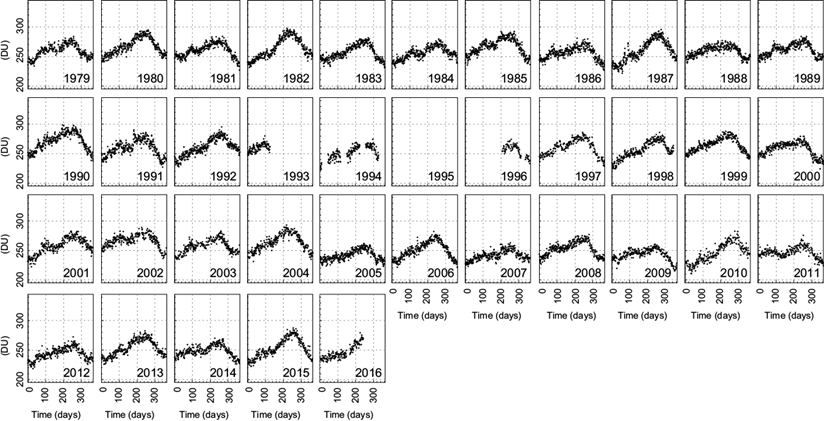
Fig. 2 Satellite daily total ozone (O3,sat) (DU) data from 1979 through August 2016 for Bogotá city.
The observed repetitive monthly evolution of total ozone leads to a correlation between seasonal and climatic behaviors. Seasons around the world are related to the Earth’s position with respect to the Sun. In order to correlate sunspot cycles and total ozone satellite measurements (O3,sat) for Bogotá city, a parametric plot of O3,sat vs. sunspot number (S n ), as a function of day of the year, is shown in Figure 3 (top panel).
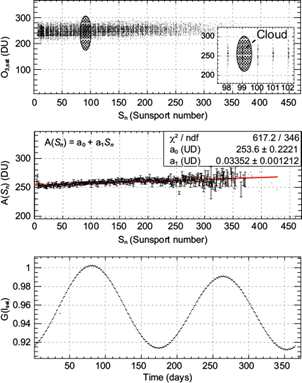
Fig. 3 Correlation of sunspot cycles and total ozone satellite measurements (O3,sat) for Bogotá city. Top: O3,sat vs. S n as a function of the day; box enlargement: O3,sat vs. S n . Middle: TCO average A(S n ) and sunspot relationship for a 37-yr data series. Bottom: Dimensionless G(I sei ) as a function of day of the year. The two yearly cycles are quasi-symmetric given that Bogotá is close to the equator.
Data in Figure 3 show an homogenous band that exhibits a linear trend between O3,sat and S n . In the enlargement (box in the top panel), it can be seen that every sunspot value has a corresponding total ozone data cloud with a finite population. Taking its mean, represented by A(S n ), and computing its associate standard error, Figure 3 (middle panel) illustrates a well-defined linear relationship with a chi-squared test divided by the number of degrees of freedom (χ2/ndf) value of 1.78. This leads to establish, from data in this study, a direct linear relation between A(S n ) and S n .
On the basis of the statistical analysis presented here, the linear relationship between the O3 average per sunspot number A(S n ), and S n can be written as
A[S n (n)] = 253.6 DU + 0.034S n (n) (1)
where the slope has Dobson units per sunspot number, and n is the time parameter that represents the day of the year.
4. Total ozone adaptive model (O 3,teo )
A mathematical expression for predicting daily total ozone trends at Bogotá’s location can be derived from the A[S n (n)] observation. The O3,teo trend prediction will depend on three terms: the A[S n (n)] parametric relationship, a G(I sei ) function that represents solar extraterrestrial irradiance (I sei ) at a specific location, which is directly related to solar activity, and a monthly form factor due to the seasonal behavior of TCO over Bogotá’s stratospheric region. The form factor is thought as a monthly function (because of seasonal patterns) for a specific year related to the sunspot cycle; that is, if a total ozone trend is needed for a year in the future, data from the previous 11 years is needed, since that is the length of the observed sunspot cycle period (see Fig. 1).
As stated above, in this context the form factor F can be written as F(m, YY - T), where m is the month of a period of time T (in years) previous to the month of the chosen year YY from which total ozone is predicted. An adaptive physical-mathematical model with at least a period T = 11 years of historical data can be expressed as
O3,teo(n, YY ) = A[S n (n)]G(I sei )F(m, YY - T) (2)
where the A[S n (n)] relationship has to be updated yearly (hence the meaning of adaptive).
4.1 The G(I sei ) function
The main solar spectral radiation interactions with the terrestrial ozone layer occur in the range of 280-340 nm of solar ultraviolet radiation. In the literature, this range is denoted by B (UV-B) which encloses wavelengths from 280 to around 315 nm. The range from 315 to around 400 nm is denoted by A (UV-A).
In the upper atmosphere, solar extraterrestrial radiation (I sei ) varies, because the Sun-Earth distance is not the same during the year, having an accepted mean value of I sc = (1360.8 ± 0.5) Wm−2, which is named as solar constant (Kopp and Lean, 2011). An analytic expression cited by Duffie and Beckman (2013) states that I sei corresponds to an I sc fractional variation:
I sei (n)/I sc = [1 + 0.033 cos(360ºn/365)] (3)
as a function of day of the year (n) starting from n = 1 on January 1, and ending with n = 365 on December 31. The largest annual fractional variation range of I sei (n)/I sc is close to ±3.4%, being greater than the annual variation range of total irradiance emerging from the Sun, which according to Tekaekara and Drummond (1971) is probably less than ±1.5% and is strictly related to solar activity.
In the inner atmosphere, starting 100 km from the Earth’s surface, direct solar extraterrestrial radiation arriving on a horizontal surface is not the same all over the Earth because of its axial rotation, translation along the orbit around the Sun, and the location’s latitude. A wide known mathematical expression to modulate I sei at any location around the globe corresponds to
cos(θz) = cos(φ)cos(δ)cos(ω s ) + sin(φ)sin(δ) (4)
where θ z is the solar zenith angle, φ is the local geographic latitude in degrees, and δ is the angular position of the Sun at the solar noon with respect to the equatorial plane (Sun’s declination). Cooper equation defines δ as
δ = 23.45ºsin [(360/365)(284 + n)] (5)
The hour angle, ω s , is defined as
ωs = 15º(12 − TST) (6)
where TST is the true solar time, also called apparent local time (Iqbal, 2012). As a convention, measurements of TCO are made at the noon’s location true solar time.
Considering the fractional variation between daily extraterrestrial radiation and solar constant (Eq. 3), combined with daily noon solar zenith angle (Eq. 4), modulation of solar ultraviolet radiation arriving at any particular extraterrestrial location along the year is expressed by
G(I sei /I sc , n) = I sei /I sc cosθ z (7)
At Bogotá, the G(I sei ) function has the form illustrated in Figure 3 (bottom).
4.2 F(m, YY-T) form factor
The annual total ozone profile at Bogotá is not symmetrical, as can be seen in Figure 2. Symmetry is broken by terrestrial factors; one of them depends on daily atmospheric conditions, which determine its seasonal or monthly behavior. For Bogotá’s location, there is a total ozone maximum around September.
The relative optical path length that radiation experiments passing through the ozone layer (Iqbal, 2012) is related to the ozone spectral absorption of UV radiation (Bernhard et al., 2005) and the molecular scattering effects of the same radiation in the atmosphere (González-Navarrete and Salamanca, 2011). Most theoretical equations for relative optical mass-but not for radiation beams of narrow spectral bands as UV-A and UV-B radiations-refer to global spectral irradiance. Annual data series suggest, at least for Bogotá, that total ozone has on average the same profile over the 37-yr period, but a dynamical behavior that changes day to day due to atmospheric fluctuations, including absorption and scattering effects.
By considering seasonal behavior and discontinuities in daily total ozone measurements, it is possible to construct an empirical and adaptive global function: the form factor F (m, YY - T), which depends on the related months at a specific sunspot cycle back in time (T = 11 yrs), and all the physical matter- radiation interaction effects, intrinsically included in historical data series.
In order to estimate F(m, YY - T) for Bogotá, it is required to extract monthly and yearly total ozone averages. The fractional change in the monthly total ozone average (Amm) with respect to the annual total ozone average (AYY), will be weighted by the modulated monthly average of fractional change in extraterrestrial solar radiation G[I sei (m)]; thus, F(m, YY - T), written as
F(m, YY - T) = Amm/AYY G[I sei (m)] (8)
represents monthly values of empiric form factor F(m) for 37 yrs of historical data at Bogotá’s location (see Fig. 4).

5. Results and discussion
Consolidated TCO predictions in the adaptive model O3,teo(n, YY), for a specific year YY, starting from YY = 1990, using data from the previous 11 yrs, are shown in Figure 5.
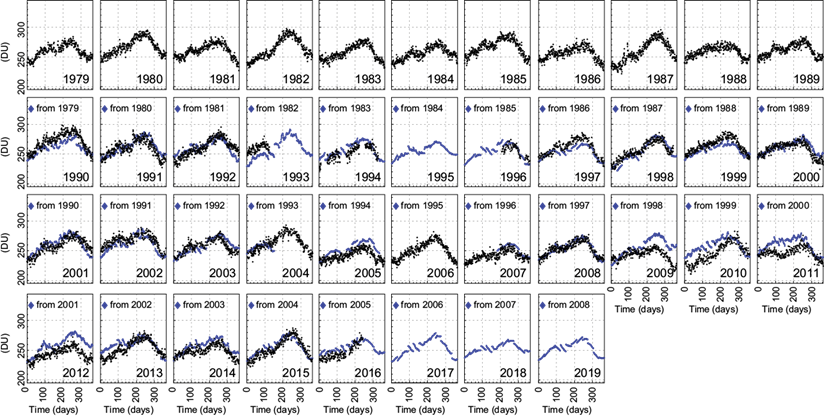
Fig. 5 Comparison of 37-yrs total ozone data series for Bogotá (black points), among satellite records, and daily total ozone predicted values from O3,teo(n,YY) adaptive model (blue points).
From 1990 through 1992, a very good day-to-day agreement between O3,teo adaptive model and satellite data is found. Predicted data for 1993, 1994 and 1996 exhibit, again, a good agreement with observed data, even though only 30% of the daily data were recorded during those years.
In the period from 1997 through 2008, the O3,teo model shows a considerable uniformity with respect to satellite data. Predicted data for years 2009, 2010, 2011 and 2012 exhibit slightly discrepancies with satellite data. The model for 2016 presents an illustrative similarity with the expected satellite data. Discrepancies from the O3,teo model and experimental satellite data oscillate between 1.8 to 6.4% giving a suitable consistency to predicted/experimental data, as shown in Figure 6.
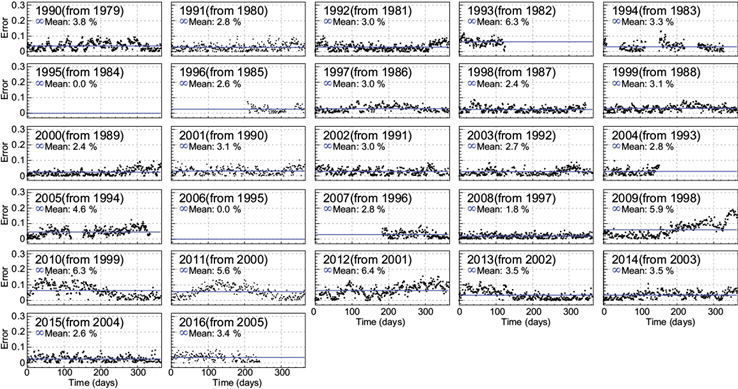
Fig. 6 Comparison between satellite experimental data sets and O3,teo model predictions of TCO for Bogotá city, from a T = 11 yrs sunspot cycle period.
Nevertheless, the O3,teo model is sensitive to the sunspot cycle period. The 11-yr period, with a reported uncertainty of ±14 months, contributes to the error propagation in this study. Furthermore, since data series are collected from different satellite missions with different instrumentation and calibration procedures (Stolarski and Frith, 2006), factors as data homogeneity are not considered in this study, as well as natural phenomena like volcanic activity, which has an important influence in the dynamics of stratospheric ozone due to the emission of SO2 (Zerefos, 1997).
The O3,teo model outlines predictions from 1990 through 2016 in a day-to-day basis, taking a sunspot cycle period of 11 years. The blue line in Figure 6 represents the computed average of the percentage relative errors between predictions and satellite data.
6. Conclusions
Figures 2, 4, 5 and 6, illustrate no satellite data for 1995, and show 30% of the annual satellite data for the years 1993, 1994 and 1996, which serves as data analysis validation for this study. In 2006 no prediction was computed since there were no reported satellite data in 1995 (11 yrs back). And Figure 5 shows that O3,teo predicts TCO for 1993, 1994, and 1996, when only 30% of the daily data were reported. Here, the O3,teo model could serve as tool for reconstructing the missing 70% of the data.
It is important to recall that O3,teo relies on the sunspot solar cycle period that oscillates by ±14 months on each 11-yr cycle, as reported by Hathaway (2010). Future studies could take into consideration a comparison between periods of 10 to 12 yrs, in order to determine how sunspot solar cycles change.
Conclusively, O3,teo shows a suitable match with satellite experimental data from a 37-yr dataset over Bogotá. The adaptive model (Eq. 2) depends on historical data, which has to be updated to recalculate the O3,teo parameters from its linear and form factor elements, A(S n [n]) and F(m, YY - T), that physically and chemically represent all absorption, scattering and matter-ultraviolet radiation interactions. Explicitly, the O3,teo adaptive model can be written as
O3,teo (n, YY) = [a 0 + a 1 S n (n)]F(m, YY - T) [1 + 0.033cos(360°n/365)] [cos(φ)cos(δ)cos(ω s ) + sin(φ)sin(δ)] (9)
where parameters a 0 and a 1 depend upon historical data series at the specific location. Further studies from other locations can validate this expression.
For the city of Bogotá, located at the very core of the Andes-Colombian region, the results presented here exhibit a linear relationship between solar activity by means of sunspot cycle and TCO, which suggests that the ozone layer can be used as a natural device for detecting and monitoring solar activity.

