


 text new page (beta)
 English (pdf)
 Article in xml format
 Article references
 Send this article by e-mail
 Cited by SciELO
  Similars in
SciELO
Similars in
SciELO 
 Permalink
1. Introduction
Multiple outbreaks of Saharan dust in the Mediterranean have been reported in the existing literature: Moroni et al. (2015) identified 22 dust intrusions in Monte Martano (central Italy) in 2009, and estimated the impact of dust on PM10 (particulate matter with aerodynamic diameter less than 10 μm) at 22 μg m-3 per intrusion, whereas the results of Kabatas et al. (2014) suggest a significant contribution of dust to high levels of PM10 in Turkey. The increased composition of crustal elements such as Ca, Si, Ti, Mg and Fe in surface PM concentrations is indicative of the Saharan dust influence (Sprovieri et al., 2011; Marconi et al., 2014; Dimitriou et al., 2015; Malaguti et al., 2015), whereas the exact potential source areas of dust aerosol loadings are usually isolated with an analysis of backward air mass trajectories (Bouchlaghem et al., 2009; Kopanakis et al., 2012; Dimitriou, 2015). The occurrence of African dust outbreaks in the Mediterranean is mainly during spring, summer and early autumn (Papayannis et al., 2009; de Meij and Lelieveld, 2011; Sprovieri et al., 2011; Ciardini et al., 2012; Varga et al., 2014) when the thermal convective activity forces the injection of particles to higher atmospheric levels (Varga et al., 2014).
Only a few former studies have evaluated the associations of airborne desert dust with adverse health effects, however possible impacts were emerged. On Saharan dust days, the findings of Jiménez et al. (2010) and Sajani et al. (2011) suggest increased mortality among the elderly (over 75 yrs. old) in Madrid (Spain) and Emiglia-Romagna (Italy), respectively. Another analysis conducted in Madrid during desert dust outbreaks (Tobías et al., 2011) indicated stronger adverse health effects attributed to PMCOARSE (particulate matter with aerodynamic diameter from 2.5 to 10 μm), a PM size fraction dominated by particles of natural origin (e.g., dust, sea spray, pollen, etc.) (Koçak et al., 2007; Minguillon et al., 2014). The findings of Pérez et al. (2012) showed that the effects of short-term exposure to PM during Saharan dust days are associated with both cardiovascular and respiratory mortality in Barcelona (Spain), whereas Malone et al. (2011) found evidence of effects of PMCOARSE and PM10 on cardiac mortality in Rome (Italy). Finally, in cases of dust episodes in Athens (Greece), the amounts of mineral dust deposited along the human lung are comparable to those received during exposure to heavily polluted urban or smoking areas (Mitsakou et al., 2008), while emergency hospital admissions for pediatric asthma are expected (Samoli et al., 2011).
The atmosphere of the urban area of Athens (Greece) is affected by a mixture of particles emitted from natural and anthropogenic sources (Papayannis et al., 2012). Nevertheless, the impact of Saharan dust has been clearly identified in various previous publications (Kaskaoutis et al., 2008; Papayannis et al., 2009, 2012; Remoundaki et al., 2011; Dimitriou et al., 2015). Dust episodes in Athens are mainly provoked by air masses arriving from South West directions (Papayannis et al., 2005; Remoundaki et al., 2011; Kaskaoutis et al., 2012; Kassomenos et al., 2012), having absorbed significant amounts of dust from North Africa. This atmospheric circulation is usually triggered by low pressure systems approaching from the west, thus bringing desert air masses from the south (Kaskaoutis et al., 2012; Nastos, 2012). Under the desert dust influence, PM10 in Athens are mostly constituted by the coarse aerosol fraction (Kassomenos et al., 2012; Pateraki et al., 2013).
This paper conducts a day-by-day analysis (Lee et al., 2013) of an intense Saharan dust storm, which struck Athens during April 2008, consisted from two main dust waves. The time intervals before and after each dust wave were also studied, in order to determine the types of atmospheric circulation which caused this intense dust episode and also the processes which removed the dust aerosol from the Athenian atmosphere, based on air mass trajectories and synoptic charts. Satellite observations of aerosol optical depth (AOD) were used in order to identify the generation of dust plumes and follow their course across Greece. The AOD values were also combined with ground based measurements of PM and meteorological parameters, aiming to evaluate the impact of the incoming North African air parcels to air quality and thermal comfort conditions.
2. Data and methodology
2.1 Data
2.1.1 Ground based air pollution data
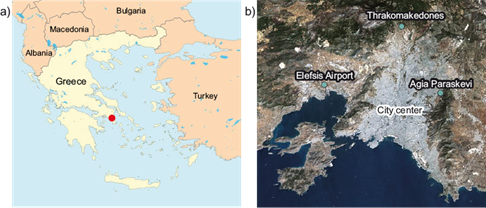
Athens is the capital city of Greece with approximately 5000 000 inhabitants and thus incorporates almost 50% of the country’s total population. The city’s public air quality monitoring network is supervised by the Greek Ministry of Environment and Energy and includes 22 urban and suburban stations with traffic, background and industrial characteristics. For this paper, ground based measurements of PM10, PM2.5 (particulate matter with aerodynamic diameter less than 2.5 μm) and NO2 daily average concentrations were obtained from the suburban background monitoring station of Agia Paraskevi (AGP), located in the northeast (NE) boundaries of the Athens basin (lat. 38.00, long. 23.82, alt. 290 m) (Fig. 1a). The available hourly concentrations of NO2 were also used. Due to the absence of direct combustion emissions (e.g., traffic, industrial, etc.) in the vicinity of AGP station, the selected sampling site was considered as ideal for the identification of atmospheric long-range transport influences, in contrast with central heavily trafficked sites. This study is focused on the AGP station, where PM2.5 measurements are performed, yet PM10 daily concentrations from the suburban background monitoring station in Thrakomakedones (THR) (lat. 38.14, long. 23.76, alt. 550 m) (Fig. 1a) were also used in order to verify our findings and also to provide additional information concerning the spatial distribution of exogenous material over Athens. All data were downloaded from the website (http://www.eea.europa.eu) of the European Environment Agency (station codes: GR0039A [AGP], GR0037A [THR]). PM measurements were performed with Thermo Andersen ESM FH 62 I-R beta ray attenuation scanning devices, whereas NO2 monitoring was carried out with a chemiluminescence analyzer (Horiba model APNA 360).
2.1.2 Satellite AOD data
For the detection of possible aerosol intrusions in Athens, Greece from transboundary sources, daily AOD (dimensionless) values at 550 nm were also used. These AOD measurements are included in the product Collection 5.1 (level 3) of the Moderate Resolution Imaging Spectroradiometer (MODIS) system, carried aboard the Terra satellite of the National Aeronautics and Space Administration (NASA). During the studied period (06/04/2008-26/04/2008), Terra satellite overpassed the Eastern Mediterranean around 09:30 and 20:30 UTC. Daily AOD data are derived on a 1º × 1º resolution grid and were downloaded from NASA’s portal Giovanni (http://giovanni.sci.gsfc.nasa.gov).
2.1.3 Meteorological data
For the needs of this work, average daily values of wind speed (knots), air temperature (F), dew point temperature (F) and visibility (miles) were obtained from a meteorological station situated 20 km away from the city center to the west (lat. 38.06, long. 23.93, alt. 43.6 m), in the airport of Elefsis (Fig. 1a). All the meteorological parameters were acquired from the website (https://www.ncdc.noaa.gov/isd/data-access) of the National Centers for Environmental Information (NCEI) of the National Oceanic and Atmospheric Administration (NOAA). Air temperature and dew point temperature were used in order to calculate relative humidity (RH) values (%) based on (1), where vapor pressure (E) and saturation vapor pressure (Es) were calculated according to an approximation of the Clausius-Clapeyron equation reflected in (2) and (3) (https://iridl.ldeo.columbia.edu/dochelp/QA/Basic/dewpoint.html).
 (1)
(1)
 (2)
(2)
 (3)
(3)
The included parameters in (2) and (3) are E 0 = 0.611 kPa; (L/RV) = 5423 K, and T 0 = 273 K. T is air temperature (K) and Td is dew point temperature (K). Finally, for the presentation of this paper, the units of wind speed, air temperature, and visibility were changed to m sec-1, C, and km, respectively.
2.2 Methodology
2.2.1 Day by day analysis of an intense dust storm
Firstly, for the identification of possible Saharan dust intrusions in Athens, Greece, daily PM10 concentrations recorded at AGP were studied for the detection of consecutive (at least three days) exceedances of the daily PM10 limit (50 μg m-3) determined by EU regulations. Dust particles are mainly categorized in the PMCOARSE size fraction (Chen et al., 2013; Dimitriou, 2015; Masmoudi et al., 2015), thus PMCOARSE levels were particularly considered. NO2 concentrations were used as a marker of local combustion emissions. Daily PM10 concentrations in THR were also studied, aiming to indicate the non-local characteristics of the aerosol episodes.
In order to achieve dust aerosol event, a day-by-day observation of a severe two wave (the first from 10/04/2008 to 14/04/2008 and the second from 19/04/2008 to 22/04/2008) which struck Athens during April 2008, daily AOD values from MODIS were plotted. The R software was used for visualization purposes. The area of interest for this work extends within 27.0-47.0 N and 10.0-47.0 E. Aiming to fully analyze the evolution of this vigorous dust episode, the four-day time intervals which elapsed among the two dust waves, and also before the first and after the second dust wave, were also studied. Thus, a 21-day period (06/04/2008-26/04/2008) was finally taken under consideration. The Hybrid Single-Particle Lagrangian Integrated Trajectory (HYSPLIT) model (http://www.arl.noaa.gov/HYSPLIT.php) of NOAA, based on NCEP/NCAR global reanalysis meteorological data, was used in order to produce backward air mass trajectories with duration of four days, in order to identify the origin of the air masses carrying the exogenous particles in Athens. Three air mass arrival heights above ground level (AGL) were selected: near ground (500 m AGL), upper boundary layer (1500 m AGL), and free atmosphere (3000 m AGL), whereas the arrival time was set at 12:00 UTC. In addition, maps presenting the geopotential height (tens of meters) of the 500 hPa pressure level along with surface barometric pressure (hPa) were also created by NCEP/NCAR reanalysis data, through the website http://www.wetterzentrale.de/topkarten/fsreaeur.html of the German weather service.
2.2.2 Thermal stress and air quality indices
Due to the additional crustal aerosol burden transported into the Athenian atmosphere from North Africa, air quality degradation was expected. In order to evaluate potential health risks for the population due to the increased PM10 concentrations, a daily pollution index (PI) was applied in AGP (Murena, 2004; Kyrkilis et al., 2007; Buchholz et al., 2010; Dimitriou et al., 2013; Li et al., 2014). The PI defines five distinct air quality classes and matches a reference concentration (C p ) of the studied individual pollutant (PM10, NO2, SO2, CO or O3) to one of the five categories (Table I). For PM10, C p is the daily average concentration. The PI is expressed by (4):
 (4)
(4)
where BP hi and BP lo are the upper and lower concentration breakpoints respectively of the PI category in which C p corresponds, and PIhi and PI lo are the upper and lower PI breakpoints of the same category respectively (Table I). Daily PI was also applied for NO2, for which C p is the maximum hourly concentration of the studied day.
Table I C p concentration breakpoints (μg m-3) and corresponding pollution index (PI) values, for each PI air quality categorya (Murena, 2004).
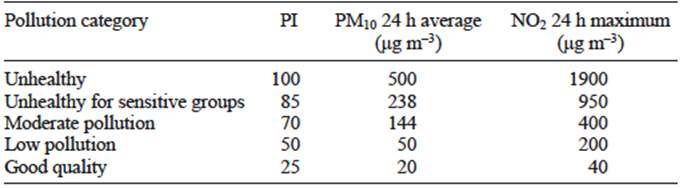
a For the good quality category, BPlo (μg m-3) and PI lo (dimensionless) values are equal to zero.
The incoming air masses of North African origin, besides the transfer of particulates, may also provoke radical variations in temperature and RH levels, inducing thermal stress. For that reason, a simple discomfort index (DI) (Thom, 1959) was implemented in order to estimate the environmental heat stress and the correlated thermal sensation, according to the DI classes described in Table II. The DI was calculated according to (5) (Giles et al., 1990; Mavrakis et al., 2012):

 (5)
(5)
in which T is the average daily air temperature (C) and RH is the average daily relative humidity (%).
3. Results
3.1 Variations of PM concentrations
Intense variations of PM concentrations were recorded at AGP during the studied 21-day time interval (Fig. 2). Daily average PM10 levels exceeded the daily limit of 50 μg m-3 from 10/04/2008-14/04/2008 and also from 19/04/2008-22/04/2008, however extreme concentrations of PM10 were particularly indicated during 12 (114 μg m-3), 13 (124 μg m-3), 14 (127 μg m-3), 21 (110 μg m-3), and 22/04/2008 (109 μg m-3). These highly increased concentrations were primarily attributed to the increment of PMCOARSE levels (e.g., dust, pollen), as it was clearly deduced from a drop of PM2.5/PM10 (%) fraction (Fig. 2). In addition, PM2.5 levels were only slightly enhanced during the episodic days. Similar variations of PM10 levels and extreme PM10 concentrations, were also detected in THR during the same period (Fig. 2), hence long range transport impacts were suggested. NO2 was considered as a marker of local combustion emissions and thus, weak variations of NO2 levels, observed during the whole studied period (Fig. 2), strongly disconnected the extreme aerosol loadings from local anthropogenic PM sources.

3.2 Day by day observation of AOD values and atmospheric circulation
3.2.1 Time interval before the first dust wave (06/04/2008-09/04/2008)
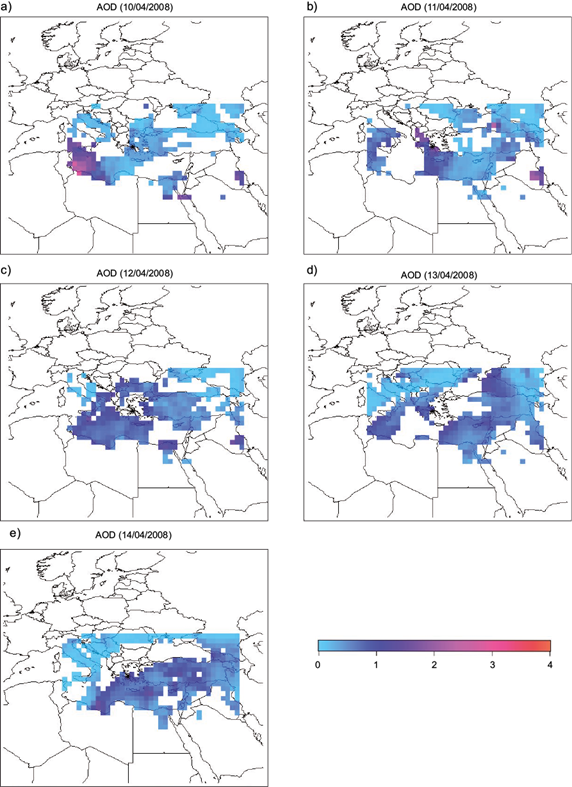
Air mass trajectories ending in Athens at 06/04/2008 and 07/04/08 indicate the city was affected by a north-west (NW) airflow (Fig. 3a) attributed to a deep depression located at the North Sea area (Fig. 3b). However, during 08/4/2008 and primarily 09/04/08, due to the advent of a low pressure system from the mid-Atlantic to West Europe, air parcels possibly enriched with dust aerosols approached Athens from south west (SW) directions (Fig. 3a). This hypothesis was verified by AOD observations of MODIS (Fig. 4) indicating a dust plume from Libya and Tunisia moving towards Greece (Fig. 4c, d, e). The initial effect of incoming dust was recorded at AGP during 09/04/2008, when the average daily PM10 concentration was 46 μg m-3 (Fig. 2).
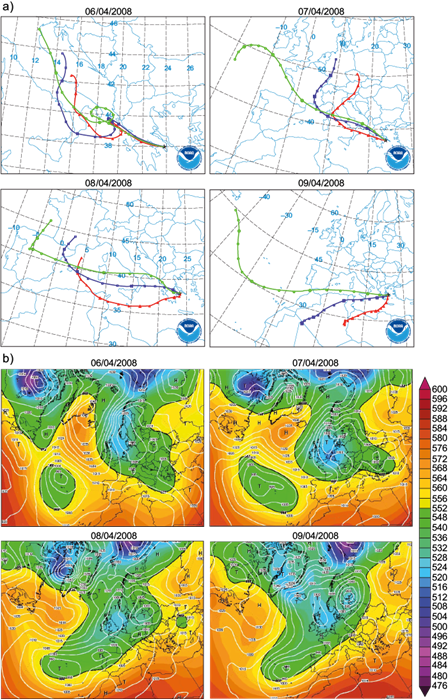
Fig. 3 (a) Air mass trajectories arriving over Athens at 500 m AGL (red), 1500 m AGL (blue) and 3000 m AGL (green). (b) Geopotential height (tens of meters) of the 500 hPa pressure level along with surface barometric pressure (hPa). All maps refer to the time interval 06/04/2008-09/04/2008.

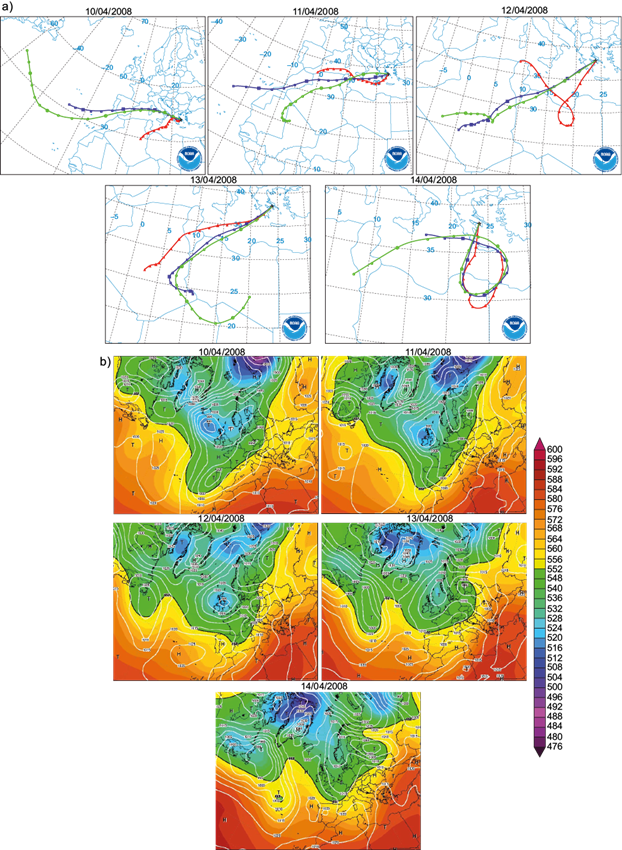
3.2.2 First dust wave (10/04/2008-14/04/2008)
During the time interval 10/04/2008-14/04/2008, the eastward movement of the barometric depression, crossing the Iberian Peninsula and the western Mediterranean (Fig. 5b), progressively generated a south-southwest (S-SW) airflow (Fig. 5a), influencing the city of Athens (Nastos, 2012). The transport of dust aerosols from Libya and Tunisia to Athens (Marconi et al., 2014) through the Mediterranean, was successfully identified by MODIS observations showing a gradual increase of AOD in the Greek region (Fig. 6). Throughout this first five-day dust wave, PM10 concentrations in AGP were over the EU daily standards, however the effect of dust was particularly indicated in AGP and THR from 12/04/2008-14/04/2008 (Figs. 2, 6), when the air mass trajectories reached Athens from more southern directions, overflying above Tunisia and Libya (Fig. 5a). Despite the highly elevated AOD values and PM10 concentrations during 14/04/2008 in the area of Athens, a removal of dust to the east was detected from MODIS measurements, towards Turkey and the Middle East (Fig. 6e).
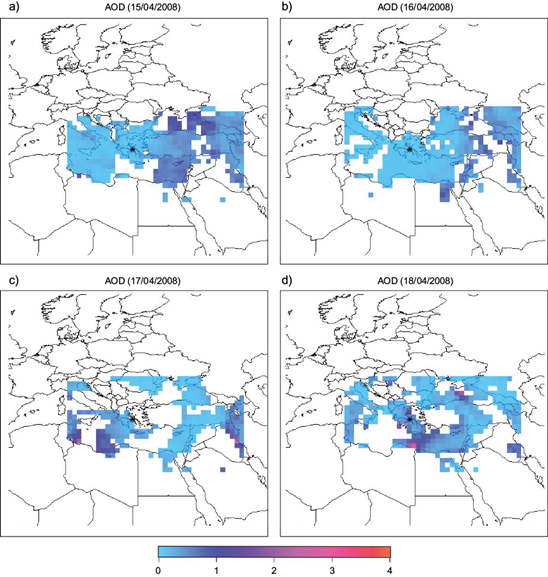
3.2.3 Time interval between the two dust waves (15/04/2008 - 18/04/2008)
After the passing of the first large low-pressure system over SW Europe (Fig. 7b), Athens was affected by NW long-range atmospheric trajectories (Fig. 7a). This NW airstream transfers the Saharan dust to the east, mainly through Turkey and Cyprus where increased AOD levels were observed from 15/04/2008 to 16/04/2008 (Fig. 8a, b). However, a new deep depression (980 hPa low pressure center), initially located to the south of Greenland (15/04/2008) (Fig. 7b), progressively approaches the NW coast of the Iberian Peninsula (Fig. 7b). Thus, the air parcels are gradually arriving in Athens from SW directions (mainly on 18/04/2008) (Fig. 7a) and the atmospheric mechanism that provoked the first dust wave tends to be repeated. Moreover, the strongly enhanced AOD values recorded over coastal Libya and Tunisia during 17/04/2008 and 18/04/2008 (Fig. 8c, d) suggest the outbreak of a new dust plume.

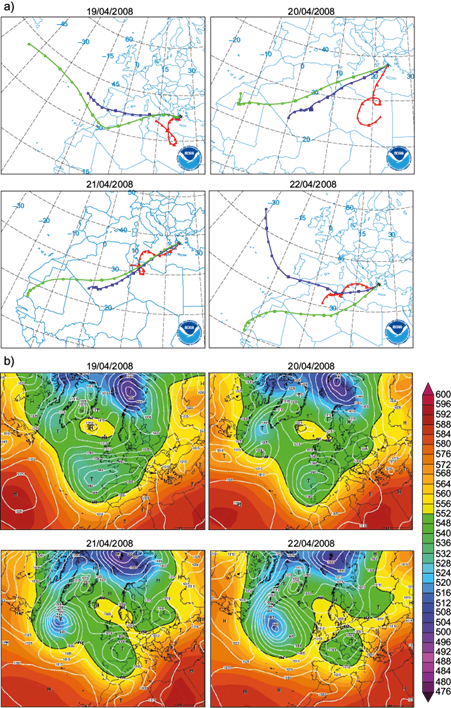
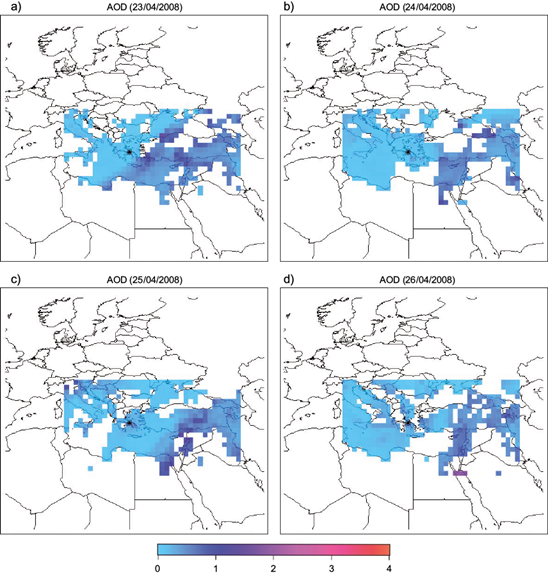
3.2.4 Second dust wave (19/04/2008-22/04/2008)
From 19/04/2008 to 22/04/2008, due to the eastward movement of the second barometric depression (Fig. 9b) overpassing the Iberian Peninsula and the western Mediterranean, air mass trajectories are reaching Athens from SW directions through NW Africa (Fig. 9a). As with the previous dust wave, this specific type of atmospheric circulation was also associated with the inflow of a second dust intrusion in Athens, responsible of highly raised concentrations of PM10 in AGP and THR (Fig. 2). The advent of dust was verified by MODIS observations, indicating increased AOD levels in the Greek region (Fig. 10).

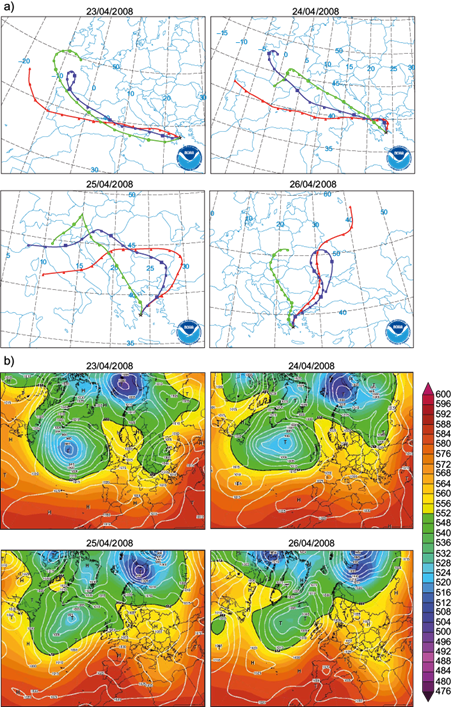
3.2.5 Time interval after the second dust wave (23/04/2008-26/04/2008)
After inducing the last dust wave, the second low-pressure system travelled across Europe to the northeast (Fig. 11b), affecting Athens during 23/04/2008 and 24/04/2008 (Fig. 11a). This air stream gradually clears the Athenian atmosphere by transferring the Saharan dust to the southeast (SE), reducing PM10 concentrations in AGP and THR (Fig. 2). A distinguishable dust zone was detected by AOD measurements of MODIS shifting towards Turkey, Egypt and the Middle East (Fig 12a, b). The large high-pressure system, located over central Europe from 25/04/2008 to 26/04/2008 (Fig. 11b) produced a northern airflow (Fig. 11a), which enhanced further the transportation of dust from Greece to southern areas (Fig. 12c, d). In addition, this anticyclonic system blocked the pathway of a new depression approaching from the North Atlantic (Fig. 11b), preventing a possible third dust wave in Athens.
3.3 Variations of meteorological parameters - Air quality and thermal discomfort assessment.
Throughout the two studied dust waves, warm and dry air of North African origin was conveyed to the Greek region. Thus, air temperature at the Elefsis station was increased, whereas RH was strongly reduced (Fig. 13a). The decrease of wind speed, recorded during both dust aerosol events (Fig. 13b) favors the accumulation of particles possibly related with the observed drop in visibility (Fig. 13b). In addition, elevated wind speed levels, monitored after the two dust invasions, are coherent with the corresponding long-range fast moving trajectories (Figs. 7a, 11a), indicating dust dispersion.
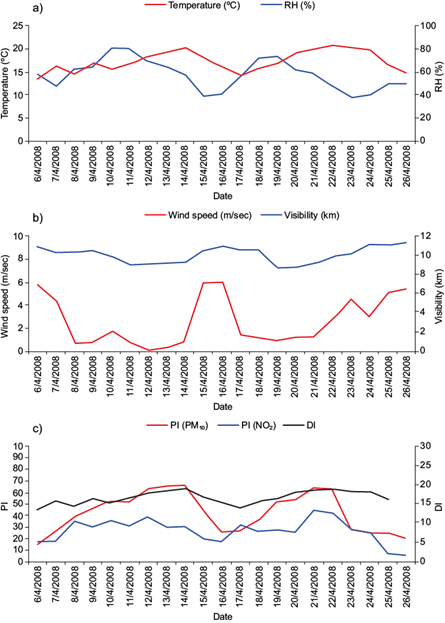
Fig. 13 (a) Daily average values of temperature (C) and RH (%) at Elefsis. (b) Daily average values of wind speed (m sec-1) and visibility (km) at Elefsis. (c) Daily PI values (for PM10 and NO2) at AGP and daily DI values at Elefsis.
Daily average PM10 concentrations were strongly amplified during the two dust events, thus PI values for PM10 were classified in the upper boundaries of the moderate pollution category (Fig. 13c) according to Table I. After the passing of each dust wave, PI values for PM10 returned to the low pollution category (PI < 50). On the contrary, PI values for NO2 remained in the low pollution category (PI <5 0) or in the good quality category (PI < 25) during the whole studied period (Fig. 13c), thus low combustion emissions were suggested. Finally, despite the increase in temperature levels, DI stayed in the thermal comfort category (< 21) throughout the two dust events (Fig. 13c), thus no thermal stress for the population was indicated (Table II).
4. Conclusions
In this paper, a day-by-day analysis of a two-wave Saharan dust event affecting Athens, Greece was attempted. Satellite daily AOD measurements were used, in order to follow the course of two dust plumes originated in North Africa and travelling through the eastern Mediterranean. The time intervals before and after each dust wave were also taken under consideration, aiming to identify the atmospheric circulation that generated the dust storm and also the clearing mechanisms that removed the African dust from the Athenian atmosphere. For this purpose, the AOD observations were combined with air mass trajectories and synoptic charts.
The source of the two dust plumes was isolated over Libya and Tunisia, where extreme daily AOD values were recorded. The transportation of dust in the Greek region, during both dust waves, was attributed to the advent of low-pressure systems from the Atlantic. The eastward movement of these barometric depressions across the Iberian Peninsula and western Mediterranean, induced S-SW airflows which transferred the dust aerosols from North Africa to Greece. The impact of both dust waves in Athens was interrupted by the prevalence of a strong NW air stream, which carried the particles eastwards through Turkey, Cyprus and the Middle East. After the second dust wave, the domination of an anticyclonic high-pressure system over central Europe ended the dust storm by blocking the pathway of a new depression incoming from the North Atlantic. During this dust event, air quality in Athens was downgraded, but no thermal discomfort occurred, according to the estimation of PI and DI indicators, respectively.
Satellite AOD observations clearly indicated the evolution and decline of this event and were coherent with ground based measurements of PM concentrations and meteorological parameters. In addition, the dust pathway was sufficiently explained based on the prevailing atmospheric circulation conditions. Nevertheless, this study could have been supplemented by an analysis of the chemical species included in the exogenous aerosol mass, providing valuable details on particle origin. Finally, the use of precipitation data, not available for this study, could have given information concerning the depletion of airborne aerosols due to wet deposition.

