


 text new page (beta)
 English (pdf)
 Article in xml format
 Article references
 Send this article by e-mail
 Cited by SciELO
  Similars in
SciELO
Similars in
SciELO 
 Permalink
1. Introduction
Scientists have predicted that the frequency and magnitude of heavy precipitation events will increase as a result of global warming due to the increase in atmospheric energy (Fowler and Hennessy, 1995; Goswami et al., 2006; Wentz et al., 2007). While Saudi Arabia (SA) is considered as an extremely dry location, it has experienced heavy precipitation events, including several flash floods during the wet period (November to April) in the last two decades (Almazroui et al., 2012).
Several studies have been conducted to categorize and classify the synoptic patterns (SPs) responsible for the development of heavy precipitation events, in order to provide a deeper understanding of the environment and climate variability worldwide (Lamb, 1950; Lund, 1963; Chen, 2000; Huth, 2000; Jiang et al., 2004; Weng et al., 2004; Raziei et al., 2012). Yarnal (1993) presented multiple examples of synoptic classification techniques, and indicated that researchers often used correlation-based analysis methods to establish a synoptic classification of atmospheric patterns. The bulk of previous studies concentrated more on the classification of large-scale atmospheric circulations related to specific regions, and long periods were considered to investigate the climatic variability of different meteorological variables, including precipitation.
Kidson (1994a) classified nine years of daily 1000 hPa fields into 13 synoptic groups to investigate the predominant wind directions in New Zealand. In a following work, the author tested the synoptic groups’ relationship with daily and monthly variation in temperature, precipitation, sunshine, and daily wind and found that the classification is likely helpful in estimating values for some meteorological variables (Kidson, 1994b). Romero et al. (1999) derived 19 synoptic patterns for the Spanish Mediterranean area using correlation-based and cluster analyses of 925 hPa and 500 hPa levels for the period 1984-1993. They were able to find a clear association between the derived SPs and a small number of rainfall patterns. Bischoff and Vargas (2003) derived eight circulation types from 500 hPa circulation anomaly maps for southern South America, also by using correlation-based classification.
In the Middle East area, weather type classifications have been limited to the eastern Mediterranean region (Alpert et al., 2004; Tsvieli and Zangvil, 2005), which is influenced by frequent cyclones forming over the Mediterranean. This influence on the region emerges mostly in winter, when the cyclones often are centered over Cyprus (Alpert et al., 1990). Another well-known frequent synoptic pattern in the Middle East is the Red Sea Trough (RST), which is considered a northeastern extension of the Sudan Monsoon Low, centered over Sudan, and first described by Ashbel (1938) and El-Fandi (1948). The RST influences the eastern Mediterranean region in October, November, and April, while the frequency of its occurrence is slight from June through August (Tsvieli and Zangvil, 2005). The RST shifts westward from September to January and eastward from February to May due to the seasonal movement and perturbation of the Sudan Low. Several studies have analyzed the synoptic patterns and the dynamics of some individual flooding and heavy precipitation events in this region (Zangvil and Izacson, 1995; Krichak and Alpert, 1998; Dayan et al., 2001; Ziv et al., 2005; Al-Khalaf and Abdel Basset, 2013).
Since the beginning of the 21st century, interest in the study of climate variability and climatology has increased, particularly as it relates to global warming (Alpert et al., 2004). Recent meteorological studies in SA are following this trend (Almazroui et al., 2012, 2013, 2014). Most works have concentrated on atmospheric circulation, synoptic patterns, and precipitation climatology. Much less research, however, has classified the patterns and investigated the short-range forecasting of severe weather, particularly heavy precipitation. Thus, the present work will provide new insight related to dynamical heavy precipitation forecasting in SA on the synoptic scale. It will offer a reference to the synoptic patterns and the nature of the flow responsible for heavy precipitation in most regions of SA as well as a guide for local forecasters to predict flood disasters, reducing losses.
2. Data and methodology
Twenty-seven weather stations spanning the country, except the southeastern part where the Empty Quarter is located, were used to select the heavy rainfall events (Table I). For the period 2000-2014 (on which the present study is focused), major meteorological variables such as surface pressure, temperature, relative humidity, wind speed, wind direction, and daily rainfall were examined. Gao et al. (2014) presented several methods to identify extreme precipitation and suggested using the 90th and the 95th percentiles of precipitation distribution as a threshold to indicate heavy and very heavy precipitation events, respectively. Therefore, for the purpose of the present study, the 90th percentile of the observed rainfall for each station (excluding the zero values) for the period of the study was calculated. The minimum among all of the 90th percentiles at all stations was 7 mm, excluding Wadi Aldwaser (WD), which receives the lowest rainfall due to its location west of the Empty Quarter and east of the southwestern mountains. Therefore, 7 mm was used as the threshold for the selection of heavy rainfall cases. To verify that a heavy precipitation event was taking place in the region, the threshold value must have been observed from at least two stations. This process resulted in 186 heavy rainfall events.
Table I Information for the stations in SA for the northern, western, central, eastern, and southern regions.
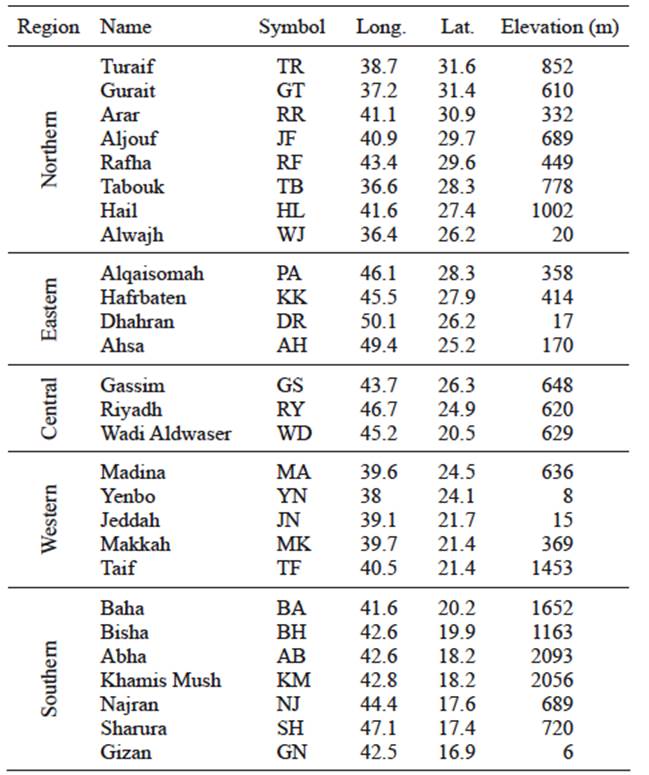
For the purpose of this study, the country was divided into five regions: northern, western, central, eastern, and southern (Fig. 1). This regionalization was performed for two reasons. First, due to the extended area and variable topography of SA as well as its latitudinal location (16-32º N), different weather systems propagate into the region and affect the weather in different ways. For example, winter precipitation in the north of the country is influenced by mid-latitude cyclones. Summer precipitation occurs only in the southwest, which has high elevation terrain. The west is influenced by the RST that propagates from the southwest, and the east is influenced by low-pressure systems centered over SA. Thus, regions were chosen based on similar weather systems and topographic characteristics. Second, the areas examined in some previous studies, such as the Iberian Peninsula and New Zealand, were smaller than SA, and thus it was felt that subregions with comparable areas to those used in previous studies should be defined.
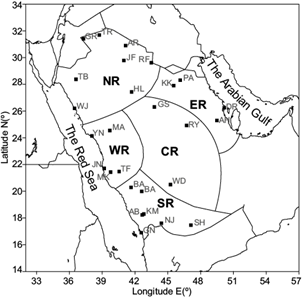
Fig. 1 The five regions defined in this study, (NR) northern, (WR) western, (CR) central, (ER) eastern, and (SR) southern, with the 27 stations in each region identified (see Table I for the station names corresponding to the two-letter codes).
The Lund correlation-based classification was adopted for the SP classification (Lund, 1963). This method was chosen for the present study to retain simplicity in the classification procedure, since the sample size used is relatively small (186 cases). According to Bischoff and Vargas (2003), the Lund’s classification technique reveals the most common types of atmospheric circulation over a region and is notable for its preservation of full type structures as well as its simplicity.
The large-scale gridded meteorological data used to derive the SPs came from the National Center for Environmental Prediction-National Center for Atmospheric Research (NCEP/NCAR) reanalysis (Kalnay et al., 1996). These data have a resolution of 2.5º × 2.5º latitude/longitude and are available globally every 6 h at 00Z, 06Z, 12Z, and 18Z. The data are composed of 17 pressure levels, and include three-dimensional variables such as the U and V wind components, geopotential heights, temperature, omega, specific and relative humidity. The calculation was made for each region using the gridded data within the domains shown in Figure 2.
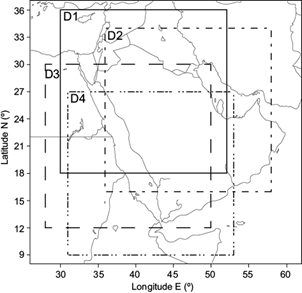
Fig. 2 The geographic windows used for the pattern classification, labeled at the upper left corners: D1 for the northern region, D2 for the central and eastern regions, D3 for the western region, and D4 for the southern region.
After the heavy rainfall events were selected, satellite infrared images were utilized to verify the presence of clouds in the region as well as to select the time of the initial synoptic map that was used to derive the synoptic classification. The satellite images were obtained from the satellite inventory of the Space Science and Engineering Center at the University of Wisconsin- Madison (http://inventory.ssec.wisc.edu/inventory/) and the University of Dundee, UK (http://www.sat.dundee.ac.uk/auth.html). The times used for the synoptic pattern analyses were chosen based on the beginning time of cloud formation in the study region. For example, if clouds started to appear at 09:00 UTC, the synoptic analysis map of 06:00 UTC was considered to represent the synoptic pattern prior to the precipitation event.
A cluster of 1000 hPa geopotential height maps for each region was created and each map was correlated with every other map to identify the frequency of the repeated SPs. Most attention was given to the surface fields as these exhibited substantial differences, while the upper level features (represented by 500 hPa geopotential heights) were relatively similar in all events. A correlation matrix was generated and the cluster of maps that had a correlation value greater than 0.7 was grouped as one SP of the classification. Composites of maps with high correlation (i.e., greater than 0.9) were created to represent different SPs for each region. The SPs were given names based on the main synoptic feature that was present and its geographic location in the 1000 hPa geopotential field (assumed to represent surface conditions). Each SP name starts with an abbreviation of the region followed by a dash, and then an abbreviation of the main synoptic features represented in the SP followed by another dash, and finally a letter if the main synoptic feature is repeated with minor differences in the characteristic, location or orientation. For example, one of the classified SPs for the northern region is N-RST-A. The N represent the northern region, RST represents the main synoptic feature that is present (Red Sea Trough), and A indicates that this pattern represents the first orientation or location of the main synoptic feature. This letter is not used four SPs that do not have relatively similar or repeated main synoptic features. The plots of the SPs were created using the Grid Analysis and Display System (GrADS).
3. Synoptic pattern classification
Studies have shown that there is a significant relationship between the lower level vertical motion and the mid-level vorticity advection associated with a mid-level trough axis in the synoptic scale (e.g., Holton and Hakim, 1992). In the majority of the cases examined in the present study, a 500 hPa trough was positioned over eastern Africa or the Red Sea area, providing 500 hPa divergence over the region of interest and hence upward motion. The mid-level upward motion was also influenced by the Sub Tropical Jet (STJ), which exists during fall, winter, and spring at 200 hPa in the subtropics. Two areas of divergence associated with the wind speed maxima within the jet stream (jet streak), which are favorable for ascending motion, were present in most of the cases (right entrance and left exit). It is known that the STJ reaches its maximum speed at 200 hPa (> 65 ms-1) over northern and northeastern Africa in winter, which influences the weather of these regions as well as in SA (Ziv et al., 2005; Al-Khalaf and Abdel Basset, 2013).
Analyses of different storms that occurred over the SA regions showed that most of the moisture transport comes from the Arabian Sea, the Red Sea (RS), and tropical African areas (Dayan and Abramaski, 1983; Zangvil and Izacson, 1995; Krichak and Albert, 1998; Ziv et al., 2005; Al-Khalaf and Abdel Basset, 2013). On the other hand, the present study found that some of the events that occurred in the eastern and central regions were influenced by some moisture transport from the Arabian Gulf. In addition, some of the southern region cases were influenced by moisture provided only from the Red Sea. In general, a close relationship exists between the SPs and rainfall in each region, with significant dynamics (large-scale ascending motion) aiding in the production of precipitation.
Regarding the total number of events in the period of study and the number of selected events per season, the northern and the southern regions have the most cases with 24% and 25% of the total, respectively (Table II). The western region had 21% and the combined central and eastern regions had 20%, while the lowest number of cases occurred in the eastern (6%) and central (3%) regions. In the northern, western, eastern, and the combined central and eastern regions, the majority of cases occurred in winter. Winter precipitation, however, was the lowest in the southern region. Precipitation was more favorable during the fall in the western, the combined central and eastern, and the eastern regions, and in the spring in the central and the southern regions. The southern region on the other hand was the only one that received heavy precipitation during the summer (Fig. 3).
Table II Total number of the heavy rain events, number per season, and number of classified SPs for each region.
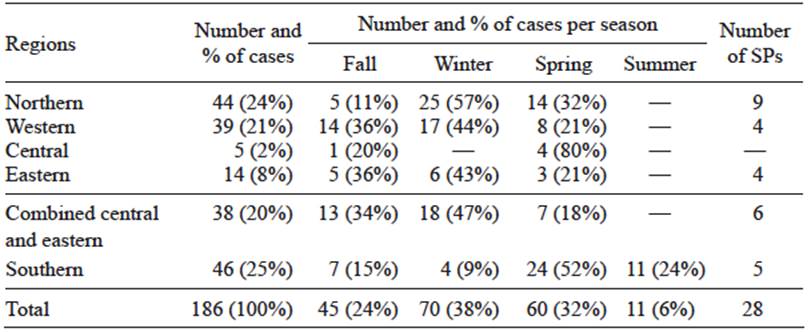
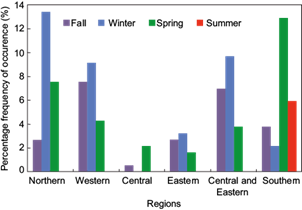
Fig. 3 Frequency of occurrence of heavy rain events in each region (percentage of the total number) as a function of season (see color bar).
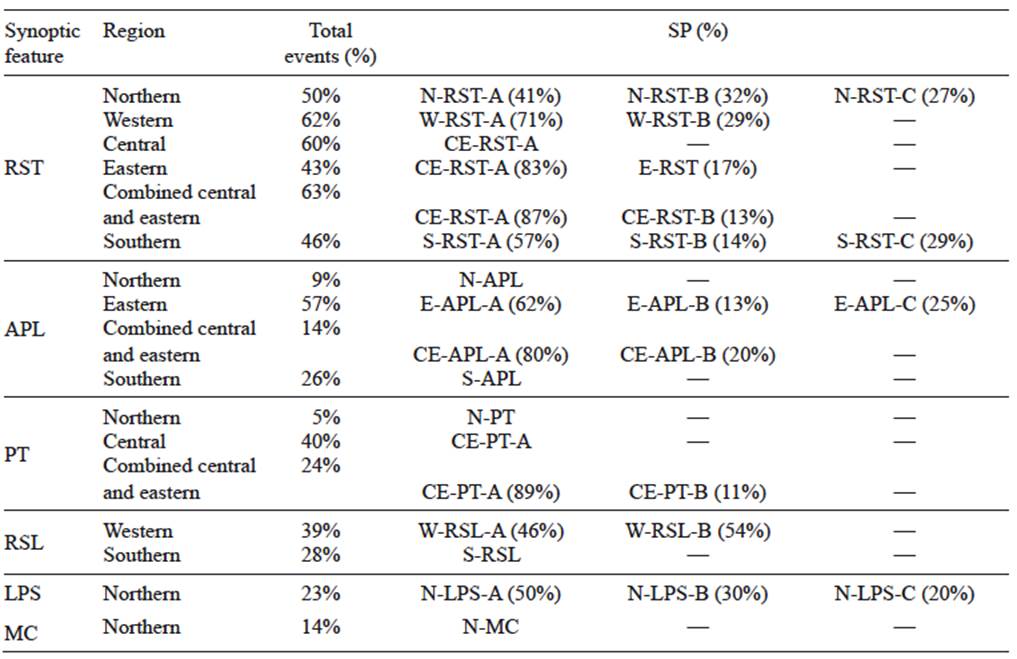
The present study found six general synoptic features, namely (1) the Red Sea Trough (RST), (2) the Arabian Peninsula Low (APL), (3) the Persian trough (PT), (4) the Red Sea Low (RSL), (5) vertically-tilted lows at lower levels associated with deep troughs at the 500 hPa level (LPS), and (6) the Mediterranean cyclogenesis (MC). The RST feature, which influenced the precipitation everywhere, is much more common than the other features except in the eastern region where the APL and the PT are more common. The RSL effect is limited to the western and southern regions, while the effect of the LPS and the MC features are limited to the northern region (Table III). In general, a total of 28 SPs were found to influence precipitation in SA. The heavy precipitation was produced from nine SPs in the northern region, four SPs in each of the western and eastern regions, and five SPs in the southern region, while six SPs produced precipitation in the combined central and eastern regions and two influenced only the central region. Detailed descriptions of each SP for these regions are presented in the next subsections. However, the primary focus of the discussion will be on the main synoptic features present in this classification.
3.1 The Red Sea Trough (RST)
The RST was found to substantially influence the precipitation in the country through the fall, winter and spring seasons by advecting moisture from the Red Sea and the Arabian Sea towards the north ahead of it. The RST is associated with an upper level trough at 500 hPa and a jet streak at 200 hPa within a westerly STJ. The location, as well as the magnitude of the upper level features, contributed to the location and the orientation of the RST and its influence on precipitation in each region. The RST was related to 50% of the events in the northern region, 62% in the western region, 63% in the combined central and eastern regions, 43% in the eastern region, and 46% in the southern region (Table III). Three RST SPs were categorized that influence the precipitation for each of the northern and southern regions (N-RST-A, N-RST- B, N-RST-C, S-RST-A, S-RST-B, and S-RST-C), two for both the western region and the combined central and eastern regions (W- RST-A, W-RST-B, CE-RST-A, and CE-RST-B), and one for the eastern region (E-RST). These SPs are shown in Figures 4, 5, and 6, and their main features and influence zones are summarized in Table IV.
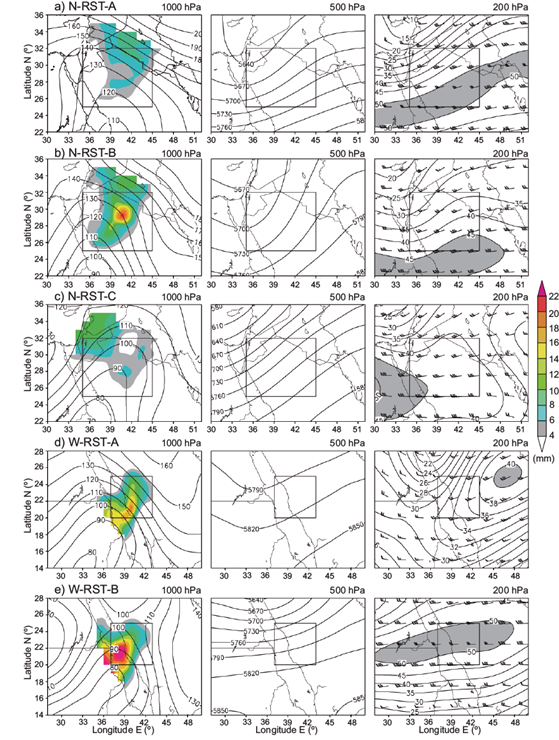
Fig. 4 Composites of the SPs of the RST SP. The square indicates the region that is influenced by the SP. Each row represents one SP, with the left panel showing 1000 hPa geopotential height (10 m contours) and average rainfall in mm (colored), the middle 500 hPa geopotential height (30 m contours), and the right 200 hPa wind speed in ms-1 (5 ms-1 contours) with the shaded area representing the maximum speed, and the wind barbs showing the wind direction and speed in knots for (a) N-RST-A, (b) N-RST-B, (c) N-RST-C, (d) W-RST-A, and (e) W-RST-B.
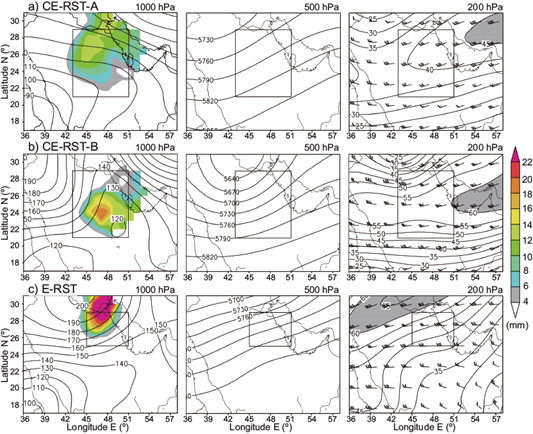
Table IV Summary of the major synoptic features of each RST SP and their influence zones (including cities).
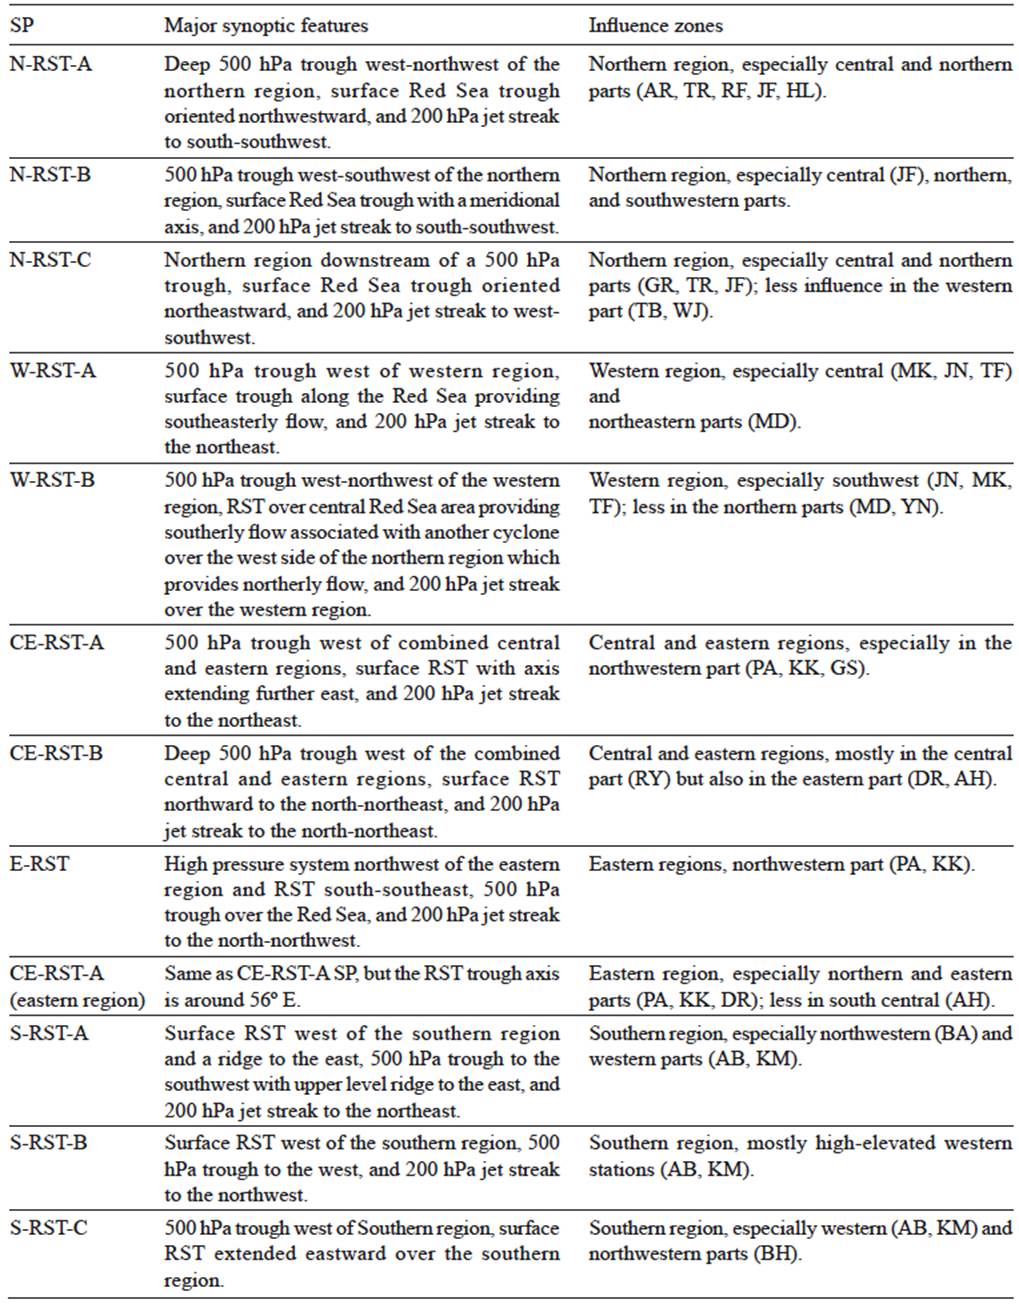
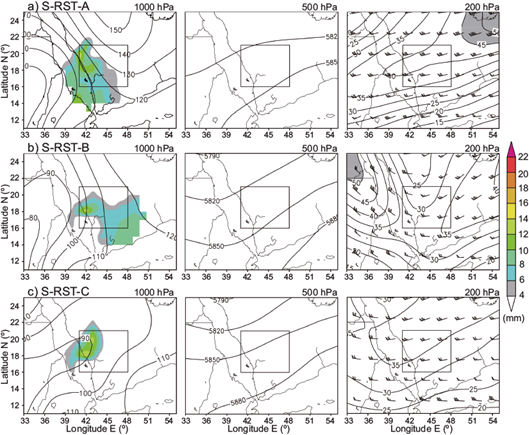
In 41% of the RST events in the north, 71% in the west, and 13% in the combined central and east regions, the orientation of the trough was northwest-southeast (N-RST-A, W-RST-A, and CE- RST-B) (Figs. 4a, d, and 5b). The orientation was north-south in 32% of the events in the north (N-RST-B), 29% in the west (W- RST-B), and 57% in the south (S-RST-A) (Figs. 4b, e, and 6a), while in 27% of the events in the north (N-RST-C) and 14% in the south (S-RST-B), the orientation was northeast-southwest (Figs. 4c and 6b). In most of the events in the central and eastern regions (CE-RST-A and E-RST), and in 29% of the events in the southern region (S-RST-C), the orientation of the RST was west-east (Figs. 5a, c, and 6c). In addition, a ridge was present east of the RST over the Arabian Peninsula, enhancing the speed of the flow over the influenced regions in the W-RST-A and S-RST-A SPs. In the W-RST-B SP, the RST was associated with a low pressure system over the west side of the northern region bringing a north-northwesterly cold flow and providing a convergence zone over the central Red Sea and the western region areas. In the CE-RST-A SP, the trough propagated eastward between 20-26º N and 42-52º E and influenced the combined central and eastern regions, and it did not extend east of 48º E for the central region’s few cases. However, for the eastern region cases, the trough propagated further east to 56º E. The RST in the CE-RST-B SP was pulled northward as a result of the strong upper level dynamics (deep trough) west of the combined central and eastern regions, which changed the direction of the flow at the surface, influencing the zone most strongly with this pattern.
The orientation and location of the RST depend significantly on the upper level pattern. It was found that the axis of the upper level trough at 500 hPa is west of the influenced region and usually shifts eastward between 30-36º E in the events of the northern, western, and southern regions, while the axis moves to between 37-42º E in the events of the central and eastern regions. The location of the 500 hPa trough provides an area of divergence downstream controlling the location of the RST at the surface and causing a rising motion to produce precipitation. The deeper 500 hPa trough assists the RST propagation further northward and eastward to influence the precipitation in the events of the northern region and in the combined central and eastern regions in the CE-RST-B SP due to the stronger divergence downwind of the trough. The lift at the lower levels is also influenced by the location of the jet streak at 200 hPa south-southwest of the northern region in the N-RST-A, N-RST- B, and N-RST-C SPs, which is consistent with the idea that the left exit region enhances the lift for the events in the northern region (Fig. 4 a, b, c). In the W-RST-A SP in the west, CE-RST-A SP in the combined central and eastern regions, as well as in the S- RST-A SP, the jet streak is northeast of the influenced regions where the lift is enhanced beneath the right entrance area of the jet streak (Figs. 4d, 5a, and 6a).
The surface flow associated with the N-RST-A, N-RST-B, W-RST-A, W-RST-B, and CE-RST-B SPs is south-southeasterly, transporting moisture from the south and moving it towards the RST trough axis. For the N-RST-C SP in the northern region, the CE-RST-A and E-RST SPs in the central and eastern regions, and the S-RST-B SP in the southern region, the flow is south-southwesterly. However, the mountains significantly influence the flow in the southern region where an upslope flow assists the synoptic forcing to produce precipitation. The flow of the S-RST- A SP is east-southeasterly converging with a southerly flow over the western part of the region. The associated flow with the S-RST-C SP is south-southwesterly over the southern part colliding with an easterly flow over the northern and western parts of the region.
The differences in orientation of the RST with each SP are important to determine the direction of the flow and thus where the strongest forcing and the heaviest precipitation exist. In the north, the average precipitation produced from N-RST-A, N- RST-B, and N-RST-C is greater around the trough axis in the northern, central, and northwestern areas, respectively (Fig. 4 a, b, c). In the west, the average precipitation produced from both RST SPs has relatively similar patterns, higher in the south and southwestern parts of the region, and decreasing gradually northeastward, except in the W-RST-B SP where precipitation is greater due to the convergence zone between the north-northwesterly cold flow and the south-southeasterly warm flow over the region (Fig. 4 d, e). The average precipitation associated with the CE-RST- A SP is greater in the northwestern part of the combined central and eastern regions, while for the CE-RST-B SP, it is greater around RY and decreases gradually around it (Fig. 5 a, b). When the CE-RST-A SP influences only the eastern region, the precipitation is greater in its western part and less in its northern part (not shown), while it is lower in the southeastern part. For the E-RST SP, a high is present to the northwest of the eastern region and the north-northwesterly wind from the high results in a convergence zone as the air meets with moister southerly-southeasterly flow and produces heavy precipitation in the northwestern part of the eastern region with a decrease gradually southeastward (Fig. 5c). Finally, for the southern region, where precipitation is influenced by topography in addition to the synoptic forcing, the three RST SPs (S-RST-A, S-RST-B, and S-RST-C) produce the heaviest amounts primarily at high elevation stations in the western part of this region (Fig. 6 a, b, c).
3.2 Arabian Peninsula Low (APL)
A low pressure over the Arabian Peninsula, usually in the area between 23-26º N and 24-50º E, characterizes this synoptic feature, which produces precipitation in the northern, combined central and eastern, and eastern regions in the fall, winter and spring. During summer, however, the APL is a thermal low and does not produce heavy precipitation except in the south due to the lack of moisture and the dry conditions over the country. This low influenced the precipitation in 9% of the events in the northern region, 14% in the combined central and eastern regions, 57% in the eastern region, and the summer cases (26% of total events) in the southern region, where it has an indirect effect on precipitation (via an upslope into the southwestern mountains exposed to the resulting flow) (Table III). For the northern and southern regions, one SP was found for each region (N-APL and S-APL) (Figs. 7a, 8b), and three and two SPs for the eastern (E-APL-A, E-APL-B, and E-APL-C) and the combined central and eastern (CE-HAPL-A and CE-APL-B) regions, respectively (Figs. 7b, c, d, e, and 8a). However, this low does not produce heavy precipitation in the western region. The main features of this mechanism and their influence zones are summarized in Table V.
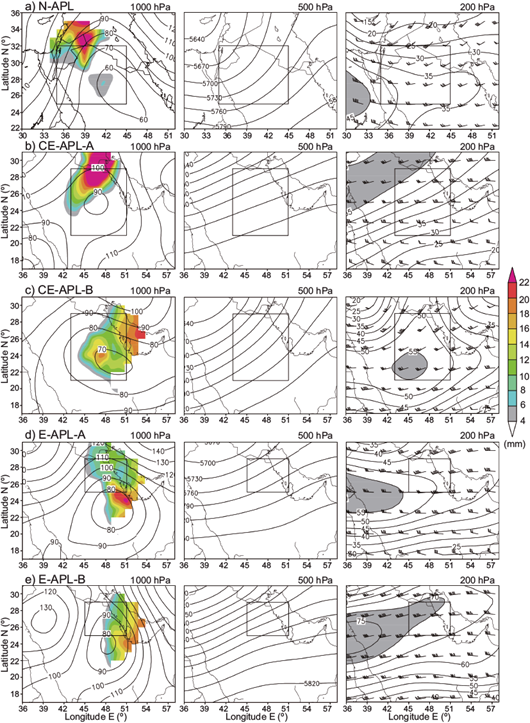
Fig. 7 Same as in Figure 4, but for the APL SPs: (a) N-APL, (b) CE-APL-A, (c) CE-APL-B, (d) E-APL-A, and (e) E-APL-B.
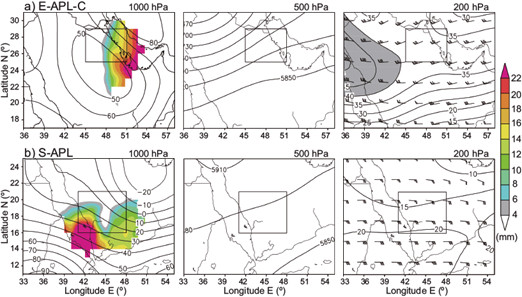
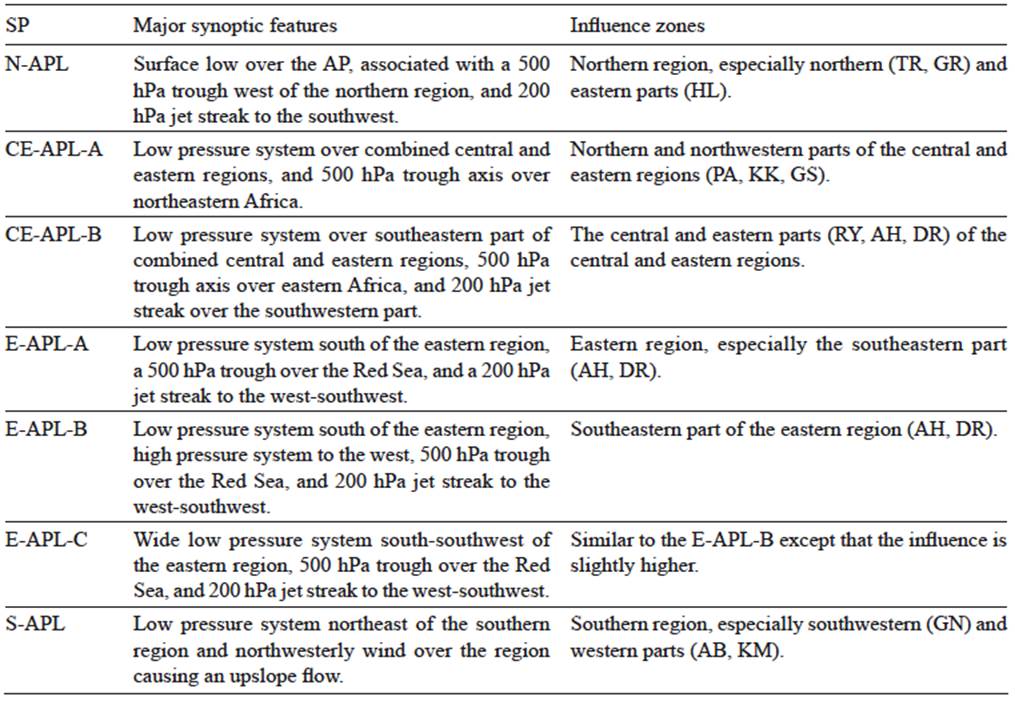
For all regions except the southern, an upper level trough is present at 500 hPa over the Red Sea around 35º E with a relatively fast flow downstream of its axis, enhancing the rising of the air in the influenced regions. In addition, the left exit region of the jet streak at 200 hPa, which is southwest of the influenced region, enhances the lift associated with this low. On the other hand, the position of the thermal APL in the summer (S-APL) influences the flow over the southern region, which is west-northwesterly in the western part of this area and contributes to precipitation there, as the flow is forced to rise over the terrain, producing heavy precipitation. The precipitation is also influenced by the convergence of the westerly flow and the south-southwesterly flow that moves toward the center of the APL in the southeastern part of the southern region (Fig. 8b).
The nature of the flow in the synoptic scale associated with the APL differs from one SP to another although the flow is mostly southeasterly. The strongest forcing associated with the APL is located at the northern side of the APL and influences the precipitation there as in the N-APL SP for the northern region and E-APL-A, E-APL-B, and E-APL-C for the eastern region. In the north, the humid flow over the Arabian Peninsula is mostly southerly and the APL SP (N-APL) produces more rainfall west of the trough axis in the northern and eastern parts of the region (Fig. 7a). In the east, the prominent flow in the E-APL-A and E-APL-B is southerly south of the eastern region and north-northwesterly west of the region. The precipitation produced from the E-APL-A SP occurs in the whole eastern region with greater amounts on average in the east, while in the E-APL-B, the presence of a high pressure system over the northwest of the country allows for a west- northwesterly cold flow in the western part of the eastern region and limits the precipitation to the eastern part (Fig. 7 d, e).
The pattern of the average precipitation produced from the E-APL- C, on the other hand, is similar to the E-APL-B except that it is greater and the flow is mostly northerly west of the region and east-southeasterly east and southeast of the region, where it is influenced by the presence of a high-pressure system to the northeast (Fig. 8a). The flow that influences the combined central and eastern region in the CE-APL-A SP is south-southwesterly, converging at the north central part of the regions to concentrate precipitation in the north and northwestern parts, while an easterly and a southerly flow prevail over the northern and southern parts of the regions, respectively, in the CE-APL-B SP, resulting in precipitation in the central and eastern parts (Fig. 7 b, c).
3.3 Persian trough (PT)
This synoptic feature consists of a short wave trough at 1000 hPa over the Arabian Gulf, which can propagate northwestward to influence the northern, central and eastern regions. The main synoptic features and the influence zones of the SPs associated with this mechanism are summarized in Table VI. This trough produced precipitation in 24% of the events in the combined central and eastern region, 40% in the central region, and only 5% in the northern region (Table III). The trough influenced the northern and central regions in the spring. In fall and winter, it influenced the combined central and eastern regions in 89% of the events, while in the other 11% it influenced the precipitation during the spring. One SP was classified for the northern region (N-PT) and two SPs for the combined central and eastern regions (CE-PT-A and CE-PT-B) (Fig. 9 a, b, c). The CE-PT-A SP influenced the combined central and eastern regions 80% of the time (four cases), and the central region alone 20% of the time (one case). The infrequent CE- PT-B SP influenced the combined region in 9% of the PT events.
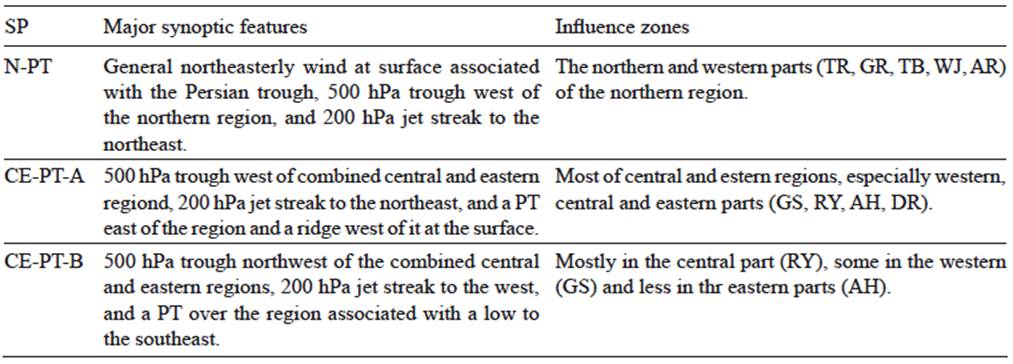
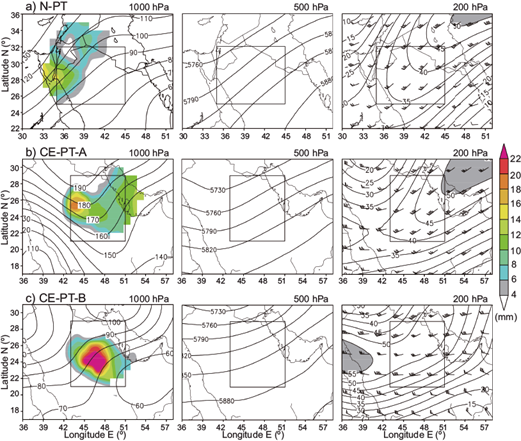
The PT is associated with a 500 hPa trough positioned west of the influenced region in the N-PT SP for the northern region and CE-PT-A and CE-PT-B SPs in the combined central and eastern regions. The 200 hPa STJ is oriented northeast-southwest placing the influenced regions east of a trough and southwest of the jet streak where the lift is enhanced (right entrance) in the N- PT and CE-PT-A SPs. In the CE-PT-B SP, on the other hand, the jet streak was positioned to the west-southwest of the combined central and eastern region where the lift is enhanced beneath the lift exit region.
At the surface, the flow is mostly northeasterly in the influenced regions. However, as was the case in the previous features, the influence zones are different for each of the SPs due to the location of the PT and the upper level features. In the north, the trough axis was located northeast of the region and the average precipitation was greater west of the axis in the western and northern parts (Fig. 9a). In the combined central and eastern regions, the CE-PT-A SP consists of the PT east and northeast of the regions with a ridge west of the regions and the RST west of the Red Sea (Fig. 9b). The associated precipitation with this SP occurred between the PT and the ridge and is greater in the western, central and eastern parts of the combined central and eastern regions and lesser in the northern and southern parts (Fig. 9b). The CE-PT-B SP consists of a shortwave over the combined central and eastern regions with a low-pressure system and a high- pressure system to the southeast and northeast of the regions, respectively (Fig. 9c). This results in a rising motion west of the trough with the associated precipitation concentrated in the center of the regions, decreasing gradually outward.
3.4 Red Sea Low (RSL)
The RSL is a low-pressure system that forms at the surface over the central and southern Red Sea areas, and influences the western and southern regions, respectively. It is associated with a 500 hPa trough over northeastern Africa between 30-36º E and a westerly STJ over the regions, with the jet streak located over the northeastern part of the influenced regions enhancing the lift. This synoptic feature was associated with 39 and 28% of the events in the western and southern regions, respectively (Table III). The present study classified two SPs for the western region (W-RSL-A and W-RSL-B) where the RSL was located to the southwest, and one SP for the southern region (S-RSL) where the RSL was located westward (Fig. 10 a, b, c). A summary of the main synoptic features of the RSL SPs and their influence zones in all regions is given in Table VII.
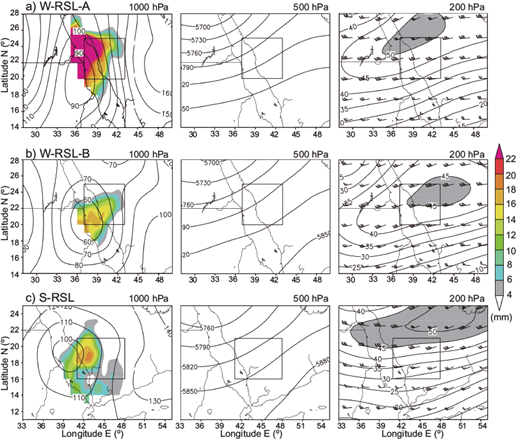
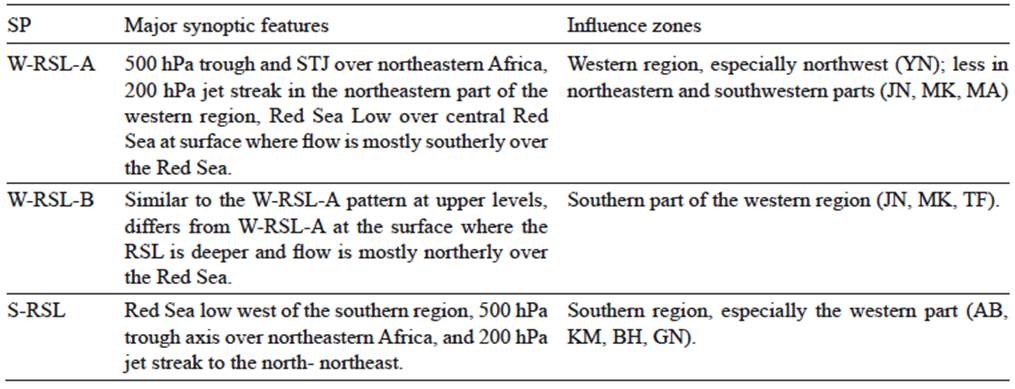
The associated flow with the RSL at the surface relative to each of the western and southern regions is southerly and southwesterly. In the west, 46% of the RSL events were associated with the W-RSL-A SP, where the prominent flow over the southern part of the Red Sea is southerly allowing for plentiful moisture transport (Fig. 10a). The flow curves toward the west and converges over the region around the low-pressure area, producing heavy precipitation over the northwestern part and moderate precipitation in the northeastern and southern parts (Fig. 10a). The W-RSL-B SP, on the other hand, was associated with 54% of the RSL events; it is different from the W-RSL-A in that the flow is mostly northerly over the Red Sea, limiting the moisture transport to the region from the south compared with the previous SP (Fig. 10b). The average precipitation associated with this SP has the same pattern as the W- RST-B but is slightly lesser in magnitude (Fig. 10b). In the southern region, the flow in this SP is south-southwesterly, and the precipitation produced over the mountains and the western part of the region is greater than the precipitation east and south of it (Fig. 10c).
3.5 Low pressure systems (LPS)
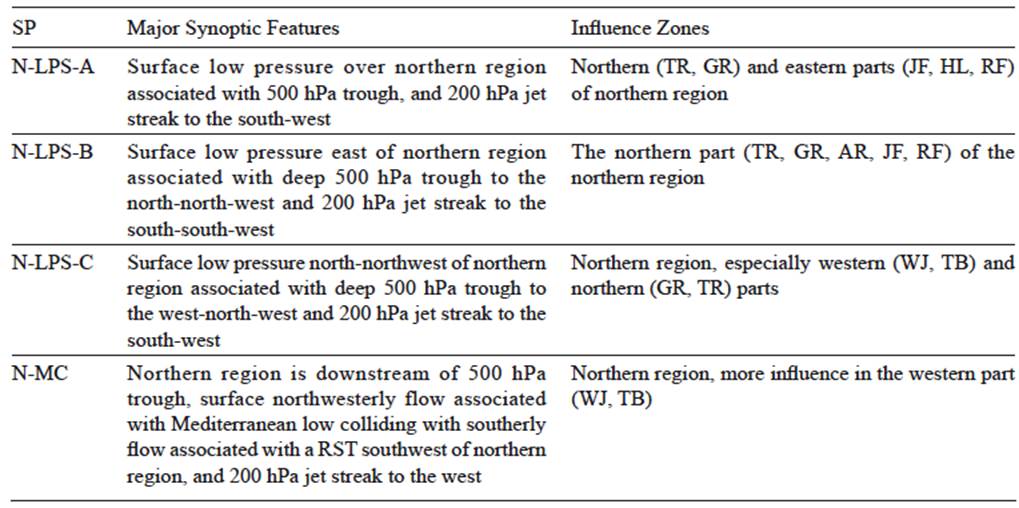
In the northern region, low-pressure systems with their associated warm and cold fronts, accompanied by strong upper- level forcing, were one of the synoptic features that produced heavy precipitation. These LPSs are associated with deep upper level troughs at 500 and 200 hPa, with a jet streak located at the trough axis at the 200 hPa level. LPSs were associated with 23% of the events in the northern region and were frequent in the winter and the spring (Table III).
The present study classified three SPs for this synoptic feature, which are N-LPS-A, N-LPS-B, and N-LPS-C (Figs. 11a, 11b, and 11c). The three SPs were relatively similar in the surface and the upper levels fields. However, the LPS in the N-LPS-A and N-LPS-C SPs are centered at (31 ºN, 40ºE) and (33ºN, 38ºE), respectively, and they are associated with deep upper level troughs located to the west of the region around 34ºE (Figs. 11a and 11c). The N-LPS-B SP, on the other hand, features a low pressure centered around (31 ºN, 45ºE) and the axis of the upper level troughs over the west of the northern region around 36ºE (Fig. 11b). The flow is mostly southerly in the N-LPS-A SP and produces greater precipitation in the northern and eastern sectors (Fig. 11a). The N-LPS-B SP results in surface northeasterly relatively warm flow colliding with westerly flow over the region, producing precipitation mostly in the northern part with less precipitation in the other parts (Fig. 11b) of the region. The LPS in the N-LPS-C SP are cut-off from the RST that propagates northeastward, and they provide west-northwesterly cold flow that collides with southerly warm humid flow, resulting in a strong frontogenesis zone over the region (Fig. 11c). This SP produced substantial rainfall over the entire region with substantial average precipitation in the western parts of the region (Fig. 11c). The main synoptic features and their influence zones of the SPs associated with these LPSs are summarized in Table VIII.
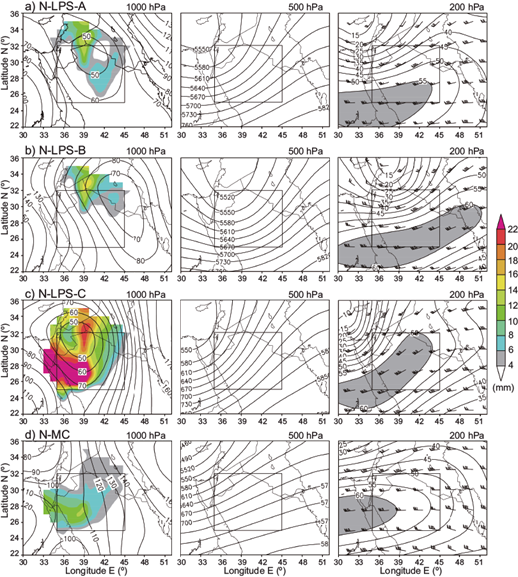
Fig. 11 Same as in Figure 4, but for the LPS and MC SPs: (a) N- LPS-A, (b) N-LPS-B, (c) N-LPS-C, and (d) N-MC.
3.6 Mediterranean cyclogenesis (MC)
Cyclones frequently form over the Mediterranean Sea in the winter, influencing the northern region when they move eastward into the eastern Mediterranean area (not shown), where their associated troughs provide westerly-northwesterly cold flow over the northern region. This synoptic feature was associated with 14% of the northern region’s events, and the present study classified only one SP (N-MC) that influences the precipitation there (Fig. 11d). The cold front associated with the low moves eastward and produces substantial winter precipitation in the western sector, with precipitation decreasing gradually eastward in the presence of the southerly warm flow (Fig. 11d). The low-level wind field is accompanied by a mid-level trough that has an axis located west of the Red Sea, as well as a jet streak associated with the STJ to the west of the northern region during the winter which enhances the lift over the northern region.
4. Summary and conclusion
The present study defined a total of 28 SP classes associated with the development of significant heavy rainfall in Saudi Arabia. It allocated the classifications to five different regions: northern, western, central, eastern and southern. The heavy rainfall events were chosen using the 90th percentile of daily precipitation as a threshold. The classification was accomplished by using a correlation-based analysis of the synoptic patterns of the 1000 hPa field for the heavy rainfall events in the area during the period 2000-2014. The 500 and 200 hPa levels were relatively similar in most of the cases. In general, six main synoptic features that influence the precipitation were identified: RST, APL, PT, RSL, LPS, and MC. Some of these features contribute to the precipitation in all regions while others are associated with precipitation in a subset of these regions. The present study classified nine SPs for the northern region, four SPs for the western region, six SPs for the combined central and eastern regions, foru SPs for the eastern region, and five SPs for the southern region.
The majority of the classified events in the present study occurred in the fall, winter, and spring, while a small percentage occurred in the southern region during the summer. The primary upper level features examined, the 500 hPa trough and the 200 hPa STJ, were present in all SPs (except for the summer cases) and play a significant role in the initiation, propagation, and organization of the surface features over the country. The most frequent synoptic feature that produces heavy rainfall in every region was the RST, which represented 50, 62 43, 63, and 46% of the cases in the northern, western, eastern, combined central and eastern, and southern regions, respectively. The RSL influenced the precipitation in the western and southern regions in addition to the RST and it was associated with 39% of the cases in the west and 28% in the south. The PT and the APL SPs influenced the precipitation in the northern, central, and the eastern regions. The upslope flow associated with the APL pattern produced precipitation in 28% of the cases (summer cases) in the southern region. The influence of the LPS and the MC features was limited to the northern region.
The results presented in this study provide detailed qualitative explanations about the dynamics and the nature of the flow that contributes to heavy precipitation in Saudi Arabia. Understanding the synoptic features that have great influence on the precipitation in this country is an initial step towards understanding mesoscale features that are often important in generating flooding, which seems to have become more frequent during the last 10 years. Moreover, this classification can help operational forecasters, allowing them to estimate the location of the influence zone occurring with each pattern and some guidance on the possible severity of the events. The results may be a first step towards improving forecasting in this part of the world. In the future, the reliability of this classification should be examined further considering false positives.

