


 text new page (beta)
 English (pdf)
 Article in xml format
 Article references
 Send this article by e-mail
 Cited by SciELO
  Similars in
SciELO
Similars in
SciELO 
 Permalink
1. Introduction
Changes in total column ozone (ToZ) affect all living systems at the Earth’s surface. As a result of the importance of stratospheric ozone, the determination of ozone concentration together with the study of the behavior and dynamics of the ozone layer has become a major topic of research (Aucamp and Olof, 2010). The qualitative analysis of atmospheric ozone began in 1913, and as a result many instruments have since been designed to measure ozone (Dahlback, 2008). Ozone measuring instrumentation aboard satellites has been used to determine global ozone concentrations for many locations (Cracknell and Varotsos, 2012). By comparison, ground-based instruments provide precise measurements at the location under study but lack the large spatial coverage given by satellites (which allow ozone measurements on a global scale) (Sivakumar et al., 2007). The availability of both ground-based and satellite measurements are of great importance to scientists as they have proved to be effective in ozone measurement analysis (Liu et al., 2013).
Through the use of satellite measurements, Solomon (1999) determined that ToZ, in mid and high latitudes and for both southern and northern hemispheres, showed a negative trend since the 1980’s. Chandra et al. (1996) used ~14 years of satellite measurements from the TOMS instrument to study total ozone in northern mid-latitudes and showed that ozone trends are influenced by annual variability associated with dynamical perturbations in the atmosphere. They also found a negative trend in ToZ corresponding to a reduction of 1 to 3% per decade. The accuracy of these measurements was assessed by McPeters and Labow (1996) who showed that TOMS data agreed with ground based data to within ±1% over the period of study. Later, McPeters et al. (1997) estimated balloonsonde ToZ using a satellite derived climatology total ozone values were within ±2% accuracy for tropical regions and ±5% for high latitudes where larger ozone variability is expected.
In the 21st century, Fioletov et al. (2002) estimated the global and zonal ozone variations from satellites (TOMS and SBUV) and ground-based (Dobson and Brewer spectrophotometer) measurements between 1964 and 2000. Their results showed that ground-based and satellite measurements in the Northern mid-latitudes agreed to within 1% while over the tropical, equatorial and Southern mid-latitudes, a systematic difference of ~2 to 3% was observed. They also showed the effects of the Quasi Biennial Oscillation (QBO) on ozone fluctuations between 25º S and 25º N in their work. Their estimate of global ozone trends in the latitude band between 60º S and 60º N, showed a decrease in ToZ of approximately 3% between the late 1970s and 1990s. They determined a percentage decline in ozone over mid-latitudes of approximately 2.5% per decade from 1979 to 2000. A year later, tropical ozone climatology was presented by Thompson et al. (2003a) using SHADOZ and Dobson and TOMS measurements. Their results showed an agreement of 2 to 4% between SHADOZ measurements and those from the TOMS instrument in five out of 10 stations. This work revealed that the best agreement between TOMS, Dobson and SHADOZ data was seen at Nairobi and Irene (the stations with the highest altitude). Comparison of satellite measurements recorded by OMI with Dobson measurements as analysed by Bonawentura et al. (2006) showed a bias and standard deviation of normalized difference between them of 1 and 2-3%, respectively.
McPeters et al. (2007) presented a new climatological profile for satellite retrieval algorithms. It was shown that the new climatology agrees with TOMS ToZ measurements to within 4% except for areas close to the Antarctic. Later, Fioletov et al. (2008) compared Dobson measurements with EPTOMS, OMI and GOME satellite data. Their studies revealed that the difference between ground based measurements and the satellite data sets were within ±2% and very rarely outside a ±3% margin depending on seasonal and regional variations. They also showed that these differences were larger under cloudy conditions as compared to clear sky conditions. In 2012, Mahendranth and Bharathi measured tropical annual and seasonal trends of ToZ using ground based instruments. They showed an increasing trend in the Northern Hemisphere of 1.88 DU (corresponding to 0.61%) per year. They also measured the maximum and minimum diurnal variability of ToZ as 28 DU (9.19%) and -36 DU (-11.8%), respectively.
This study is the second part of an investigation on ozone climatology and its variability from ground-based and satellite observations over Irene, South Africa. Part one of this research addressed the vertical variability of ozone over Irene while this one focuses on the ToZ variations over this site. The unique situation of the Irene station is due to the availability of ground based measurements from a Dobson spectrophotometer as well as satellite measurements specific to the location. Previous studies have shown the prevalence of high and low latitudinal influences at Irene (Semane et al., 2006). This study is organized as follows: section two provides a brief description of the datasets used as well as the instrumentation employed; section three presents the climatological results obtained from the measurements while a summary of the results is presented in section four.
2. Data and instruments
The instrumentation used in this study is divided into two categories: ground-based measurements and satellite observations.
2.1 Ground-based measurements
Ground-based instruments refer to in-situ instruments measuring ozone. In this research, a Dobson spectrometer has been employed to measure ToZ above Irene. A brief description of the instrumentation and data recorded are given below.
2.1.1 Dobson spectrophotometer
The Dobson spectrophotometer is the standard instrument used to measure ToZ from the earth’s surface (van Roozendael et al., 1998). Dobson spectrometers were substituted with automated Brewer spectrometers in the late 1980s and 1990s (Fioletov et al., 2002). Results from calibration indicate that the Dobson spectrophotometer maintains a precision of ±0.5% in long term ozone measurements. This result highlights the accuracy and precision of the Dobson instrument as a global network tool, which can act as a reference for the comparison and validation of satellite measurements (Komhyr et al., 1989). With proper maintenance and regular calibrations, ToZ from the Dobson instrument has an estimated accuracy of ~1% for direct sun observation and 2-3% for zenith sky observation with sun elevations higher than 15º. The measurement technique of the Dobson spectrophotometer is based on a differential absorption method in the ultraviolet Huggins band (Balis et al., 2007) where ozone exhibits a maximum absorption feature (Komhyr et al., 1989). Its measurement principle relies on the ratio of direct sunlight intensities at two standard wavelengths of 317.5 nm and 331.2 nm under most conditions, and 331.2 nm and 360 nm for high ozone and high solar zenith angle conditions. The most common combination used is the double pair, which is the recommended international standard for mid-latitudes (Balis et al., 2007; Anton et al., 2010).
The Dobson temporal and spatial network covers a wide geographical area which helps to validate satellite sensor data. This network has provided several ToZ data sets for both trend analysis and satellite validation of total ozone data. In mid-latitudes, there is a seasonal error of ± 0.9% in Dobson measurements as the ozone absorption coefficient used in retrievals is temperature dependent. Systematic error constitutes about 4% (Balis et al., 2007).
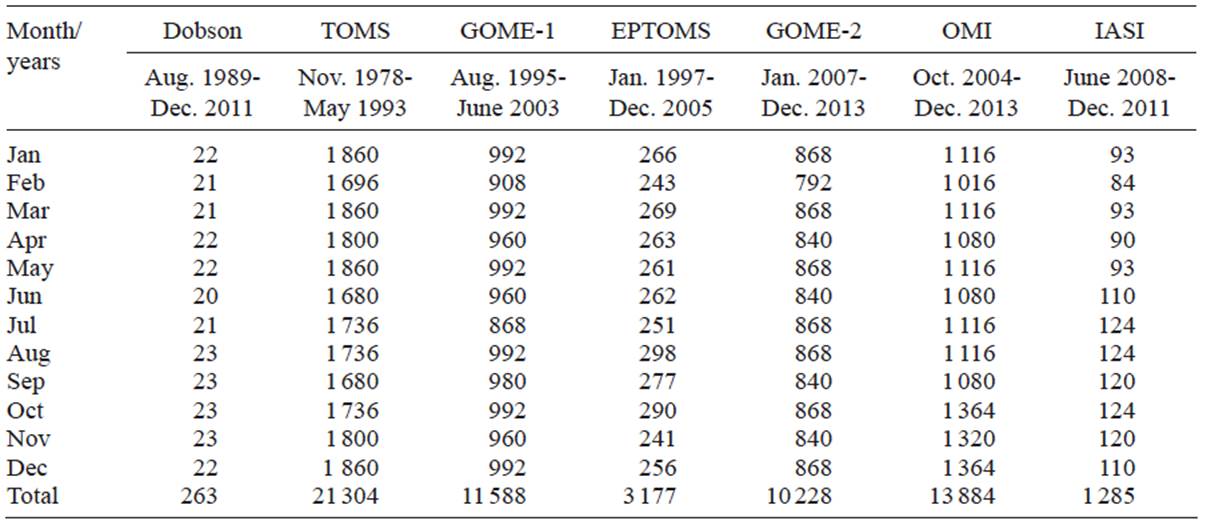
Monthly mean measurements from 1989 to 2011 using a ground-based Dobson instrument operating at Irene were employed in this study. The data obtained were filtered to within a 2σ standard deviation for better quality. Datasets outside this range are not used and are treated as anomalies. The frequency of Dobson measurements as well as other instruments used for this study is presented in Table I.
2.2 Satellite overpass data
The total number of satellite measurements recorded over Irene that are employed in this study are given in Table I for their respective years of operation. The total number of measurements for each satellite data set depends on the number of years of satellite operation together with the frequency of daily measurements. TOMS has a very large data set due to ~15 years of operation coupled with four daily observations. IASI has the smallest data set as operation only begun recently (2008) and data is recorded with one daily observation. A brief outline on each satellite and accompanying instrumentation is given below. For better data quality, all satellite instruments used in this study have been subjected to qualitative analysis to within ±2σ. As discussed earlier, data outside this range were not employed.
2.2.1 Total Ozone Mapping Spectrometer (TOMS)
TOMS measures ToZ present in the Earth’s atmosphere. It was first launched on October 24, 1978 using the Nimbus-7 spacecraft followed by Meteor-3 in 1991. The Nimbus 7 satellite has an orbital period of 104 minutes as it was launched into a local noon, sun-synchronous near polar orbit at an altitude of 950 km. The TOMS instrument measures in six wavelength bands at a swath angle of 51º on either side of the instrument and a resolution of 50-280 km at the extreme scan angle. This instrument gives a daily measurement in a 50 × 50 km field of view at nadir and 250 × 250 km at extreme off nadir (Anton et al., 2011). The data used in this study is from its first launch using the Nimbus-7 spacecraft corresponding to November 1978-May 1993. TOMS provides daily measurements corresponding to the overpass over Irene. The daily mean of these measurements is calculated and presented in this work. TOMS calibration error is estimated to be ±1% (Jaross et al., 1995) while its measurement error is about 12 DU depending on cloud cover, relative humidity and other atmospheric parameters. TOMS measurements have continued through the use of the Earth Probe Total Ozone Mapping Spectrometer (EP-TOMS) which provides a daily survey of the earth’s atmospheric ozone as it is also nadir pointing. The Earth Probe instrument had an initial altitude of 500 km, inclination angle of 99.3º and an equator crossing time of 12 noon. It was however re-boosted in December 1997 to increase its daily coverage and reach a stable orbit. Its final altitude is now 750 km. The data used for this study is from January 1997 to December 2005. More details of TOMS data can be obtained from the following webpage https://data.gov.au/dataset/total-ozone-mapping-spectrometer-toms-ozone-data
2.2.2 Ozone Monitoring Instrument (OMI)
OMI was launched in July 2004 on a sun-synchronous polar orbit onboard the Aura satellite operated by NASA. It is a nadir-viewing imaging spectrometer that measures atmospheric backscattered sunlight in the wavelength region of 270-500 nm with a spectral resolution of 0.5 nm. This instrument has a spatial swath of 2600 km and pixel ranging from 13 × 24 to 13 × 128 km. OMI provides data to derive ozone as well as to measure cloud pressure and coverage. OMI has high spectral capability, which improves the level of precision and accuracy of ToZ (Keim et al., 2009). It uses a linear fit algorithm for the retrieval of ToZ. Kroon et al. (2011) provided a detailed description of the operational OMI ozone profile algorithm. This retrieval algorithm uses optimal estimation whereby the difference between the measured and modeled sun-normalized radiance is minimized iteratively. This is done by adjusting the amount of ozone in 18 atmospheric layers. However, there must be prior knowledge of ozone profiles as well as other parameters such as surface albedo for the retrieval to be constrained (Mielonen et al., 2015).
Ten years of data are used for this study, i.e. October 2004-December 2013. Daily measurements corresponding to the overpass over Irene are made (see Table I for the period of operation as well as the frequency of launches used in this study). Data has a measurement error of ~6 DU and instrument error of about 2%. Further details on OMI can be obtained from https://aura.gsfc.nasa.gov/omi.html
2.2.3 Global Ozone Monitoring Experiment (GOME)
GOME was first launched on European Remote Sensing (ERS-2) satellite in April 1995. It is a visible spectrometer used for global observation of atmospheric ozone, trace gases as well as UVR. It covers the 240-790 nm wavelength intervals and has a spectral resolution of 0.2-0.5 nm (Theys et al., 2013). An improved GOME-1 satellite, GOME-2 was launched in October 2006 onboard the Meteorological Operational Satellite-A (MetOp-A). Its additional features include a sun diffuser, a larger swath width of 1920 km, two polarization channels in 15 programmable spectral bands and a faster data rate of 400 Kbps. This GOME-2 instrument is expected to make a more valuable contribution towards climate and atmospheric research by providing regular, reliable data for use in air quality and forecasting.
The improvements in GOME-2 are consequence of changes made to the sensor itself, which resulted in changes in calibration and data processing. It operates in four bands slightly different from the bands on GOME-1, namely: band 1, 240-295 nm; band 2, 290-405 nm; band 3, 400-605 nm, and band 4, 590-790 nm. Similar to TOMS, daily sets of data are measured by GOME-1 and GOME-2 and their corresponding mean is derived and compared with other satellite measurements (see Table I for the operational period and the frequency of data used in this study). GOME data used for this study ran from August 1995 to June 2003 (GOME-1) and from January 2007 to December 2013 (GOME-2). Instrument error for GOME-2 is about 3.3% while the mean measurement error over the period is ~6 DU.
2.2.3 Infrared Atmospheric Sounding Interferometer (IASI)
IASI is a new French satellite with a high level of accuracy and precision designed for meteorological sounding of atmospheric gases. It was first launched onboard the Meteorological Operational Satellite Program-A (METOP-A) on October 19, 2006 while the second program was launched in 2012 onboard the METOP-B satellite. It is a nadir-viewing spectrometer operating in the thermal infrared (Dufour et al., 2012). It provides infrared soundings of temperature profiles both in the stratosphere and troposphere. It also measures levels of important atmospheric chemical components involved in climate change such as O3, CO2, CH4, CO, H2O, HCOOH, CH3OH, NH3 and other gases.
The data used for this study run from June 2008 to December 2011 and the monthly distributions are given in Table I. A validation exercise performed on IASI using balloonsonde measurements indicated that total column measurements and the retrieval errors are less than 5%. This is consistent with the standard deviation difference between the ozonesondes and IASI data (Keim et al., 2009). More details on IASI instrument can be found in http://www.ospo.noaa.gov/Products/atmosphere/soundings/iasi/
3. Results and discussion
In this section, total ozone (ToZ) variation and climatology over Irene, South Africa are examined using the Dobson instrument for ground-based measurements while TOMS, EPTOMS, GOME-1, GOME-2, OMI, and IASI satellite data are employed. These satellites are carefully selected to provide 35 years of continuous measurements over Irene. The only data gap in this study is between June 1993 and July 1994 when none of these satellites were in operation.
3.1 Monthly variability of ToZ from satellite measurements
Figure 1a shows the monthly mean ToZ, which was obtained from various satellite measurements during their overpasses over Irene by grouping the data in terms of monthly measurements irrespective of the years of satellite measurements and their corresponding mean. This illustrates the variability of ozone over the period of observation as measured by different satellites. TOMS has the highest ToZ (ToZ) measurement compared to other satellites. TOMS ToZ measured during mid spring (October) is 297 DU. However, the measured standard deviations (see vertical lines in Fig. 1) illustrate that it falls within other satellite measurements. EPTOMS measurements were higher than GOME-1, whose overpass times are similar (Fig. 1a). This agrees with the work of Anton et al. (2010), who showed that despite the decline of the EPTOMS instrument, measurements were still higher than GOME-1 even though both satellite measurements are within the same standard deviation. In terms of ozone seasonal variation, there was also a good agreement between EPTOMS and GOME-1 measurements as their data are consistent throughout the years of operation. EPTOMS measured a late autumn minimum of 256 DU and a spring maximum of 287 DU. This data set also showed the highest values for all seasons. TOMS values for all seasons are consistent with the findings of Bramstedt et al. (2003). High ozone measurements from the TOMS satellite can also be due to the years of overpass (1978 to 1993) when atmospheric ozone concentrations were relatively high (Bojkov and Fioletov, 1995). A minimum ozone concentration of 259 DU was recorded in May (late autumn), in agreement with findings over a similar southern subtropical site, namely Reunion (Sivakumar et al., 2007). There is a systematic difference of about 2 to 3% over tropical and equatorial regions and over southern mid-latitudes in the estimate of global and zonal total ozone from GOME when compared to ground-based measurements (Fioletov et al., 2002). This is shown in GOME-1 measurements as ToZ has a peak value in September and October and an early minimum in late summer (February) of 259 DU. This measurement of late summer minimum is also replicated by the GOME-2 instrument, whose data showed a further minimum during late autumn (May) and a mid-spring maximum of total ozone in October. Although Balis et al. (2007) argue that OMI data overestimates ToZ in the Southern Hemisphere, this result showed consistency with other measurements where a spring time maximum of 285 DU and an autumn minimum of 258 DU was observed. TOMS, EPTOMS, OMI and IASI data sets all showed a late autumn (May) minimum with a gradual increase through winter reaching a mid-spring maximum in October. GOME-1 data shows a monthly early maximum during September and minimum during late summer and autumn (February and May). IASI data shows a different behavior from other satellite measurements in terms of both seasonal minimum and average minimum, although its measurements are still within the same standard deviation of other satellite data. IASI data records a winter minimum of ~264 DU and its springtime maximum of 280 DU agrees with other satellite measurements. The result of this monthly mean ToZ agrees with earlier studies made in the Southern Hemisphere, where springtime maximum and autumn minimum ozone concentrations are expected (Sivakumar et al., 2007). It is important to note that Figure 1a shows the monthly variation of satellite measurements irrespective of the years of overpass while Figure 1b shows the ToZ variation between the combined satellite products from 1989 to 2011 and Dobson instrument over the same time period. The average monthly measurements during this period were similar for all seasons. The highest deviation of ~4 DU was observed between the two sources during November.

Fig. 1 (a) Monthly ozone variations and corresponding standard deviation from TOMS (1978-1993), EPTOMS (1997-2005), GOME-1 (1995-2003), GOME-2 (2007-2013), OMI (2004-2013), IASI (2008-2011) and Dobson (1989-2011) data. (b) Combined monthly ozone variation from all the satellite instruments and Dobson measurements for the period 1989-2011.
3.2. Inter-annual variability of ToZ
The yearly mean values for each satellite instrument were obtained by grouping the data in terms of yearly measurements, and the calculating their corresponding mean. The mean values obtained along with their standard deviation are presented in Figure 2a. Ozone was uncharacteristically low in 1985, which showed agreement with the global data (Jones and Shanklin, 2002) since it corresponds to the discovery of the ozone hole by Joseph Farman and colleagues (Hamil and Toon, 1991). The TOMS instrument was the only satellite instrument available for ozone measurement from 1978 to 1993, when it ceased operation (McPeters and Labow, 1996). The yearly mean from TOMS is within 270 DU and 280 DU except for 1985 when it was as low as 265 DU, in agreement with the results reported by Jones and Shanklin (2002). However, in 1992 there was a significant decrease in ToZ, which can be attributed to the volcanic eruption of Mt. Pinatubo (Philippines) that caused a global decrease in ozone concentration (Gleanson et al., 1993). The eruption circulated aerosols globally for a period of five months (Stowe et al., 1992) and was a major factor in the recorded ozone decrease.

Fig. 2 (a) Temporal variations of ozone and its decadal trend over Irene and (b) temporal variations of ozone and its decadal trend over Irene after second order Fourier decomposition, from TOMS (1978-1993), GOME-1 (1997-2003), EPTOMS (1997-2005), OMI (2004-2013), GOME-2 (2007-2013), and IASI (2008-2011).
To identify the increasing or decreasing trend based on the long-term measurements, the second order Fourier decomposition has been applied to the measured values (see Fig. 2a). Figure 2b illustrates the results obtained based on the above applied Fourier decomposition, which results in a smooth ToZ variation and replicates similar variations as seen in Figure 2a. The obtained Fourier decomposition coefficient illustrates a high offset value for TOMS of ~274 DU, in good agreement with our earlier obtained results where TOMS demonstrated high values in comparison to other satellites. There was a subsequent ozone decrease in the 1990s with GOME-1 and EPTOMS averaging 265 DU and 269 DU, respectively, while in the 2000s ozone values increased to about 267 DU and 271 DU as measured by OMI and IASI. There was no significant change in ozone measurements obtained by GOME-1 and GOME-2. The time periodicity based on the Fourier decomposition illustrated well-defined annual oscillations. The decadal trend estimation shows the following values: 2.4, 3.9, 4.9, 5.4, 2.6, and 2.3 DU, respectively, for TOMS, GOME-1, EPTOMS, OMI, GOME-2, and IASI.
A downward trend in ozone measurements is evident from 1978 to 1993 in Figure 2. This is attributed to the TOMS data availability as it ceased operation in May (the expected period of minimum ToZ). Another reason for the downward trend is the significant decrease in global ozone in 1985 and 1992 (Newman et al., 1997). For late 1993 and 1994, where no data was available for this study due to the lack of satellite retrieval, total ozone continued to decline (Hofmann et al., 1994). From 1995 onwards the average ozone concentration in the atmosphere continued to fluctuate due to various dynamical processes and the magnitude of the various transport processes occurring yearly (IPCC, 2001). For both EPTOMS and GOME-1 (whose years of overpass are similar) average yearly ozone means of about 267 DU and 263 DU, respectively, were recorded for the late 1990s; however, in the 21st century the yearly mean increased to approximately 271 DU and 266 DU, respectively, while GOME-2 and OMI measured a corresponding yearly average of 269 DU and 273 DU. This gradual increase and stability in ToZ during the 21st century is attributed to the stable atmospheric concentrations of chlorine and bromine. Furthermore, ozone-depleting gases such as chlorofluorocarbons were gradually removed from the atmosphere through natural processes, albeit at a very slow rate. Randel and Thompson (2011) used data form the Stratospheric Aerosol and Gas Experiment II (SAGE II) and SHADOZ to link the inter-annual variability in ozone trends in the southern hemisphere primarily to the Quasi Biennial Oscillation (QBO) and the El Nino Southern Oscillation (ENSO). This indicates that there is a strong correlation between ozone variability and temperature change in the atmosphere.
The fluctuations in Figure 2a, b illustrate the seasonal variation in ozone as it increases gradually from autumn (where minimum ozone concentration is expected) to winter and then reaches a spring time maximum (linked to biomass burning activities) before it reduces through summer (Clain et al., 2009). The trend analysis of ozone over Irene shows a significant decrease of ~8 DU in total ozone (as discussed earlier) from 1978 to 1993 with a gradual recovery and increase of ~2 DU in total ozone from 1995 to 2005 as measured by both GOME-1 and EPTOMS. An increase of approximately 7-9 DU is observed in measurements from OMI and IASI thereby illustrating the gradual recovery of the ozone layer. Recently, Andric et al. (2013) examined the temporal behavior of ozone in Croatia and observed variability between yearly measurements in the summers of 2002, 2007, and 2012. It was evident from their studies that for every five years, ozone values increased between 2002 and 2012 with daily maximum values obtained in the afternoon.
Data recorded by the GOME-2 satellite between November 2009 and May 2011 contained some errors. Although these measurements were within the standard deviation used to filter the data, they did not show good agreement with the established seasonal behavior of ozone in the Southern Hemisphere. This discrepancy can be attributed to instrument errors. A new instrument, GOME-2B was launched in 2012 for better monitoring ozone and other trace atmospheric gases. Higher ozone peaks were measured by GOME-2 in 2012 and 2013 when compared to those from the OMI instrument. This can be attributed to the change in algorithm from GOME-2A to GOME-2B (Hao et al., 2014).
3.3 Mutual ozone variations
Mutual ozone variations between satellite instruments and Dobson instrument are presented in this section. The comparison is only made for years of data overlap. Daily and monthly values are calculated and used to obtain a time series. The monthly mean is computed and Dobson measurements are subtracted from satellite measurements for the corresponding years.
Figure 3a shows the difference between ToZ measured by TOMS and Dobson from 1989 to 1993, GOME-1 and Dobson from 1995 to 2003, and EPTOMS and Dobson from 1997 to 2005. Both TOMS and Dobson measurements are within ±5 DU for all seasons with negligible variations in February, April, May, September, October and November. For GOME-1 and EPTOMS, both instruments have very similar years of overpass and show the satellite underestimation of ozone from late autumn to the end of the year, though the difference is still within ±5 DU except for GOME-1, whose differences in spring months are 9, 6, and 10.5 DU. GOME-1 shows an underestimation of ozone compared to Dobson for all seasons with greater deviation in late spring and summer. This underestimation may be due to an error in ToZ retrieval associated to the presence of clouds during the measurements (Koelemeijer and Stammes, 1999).
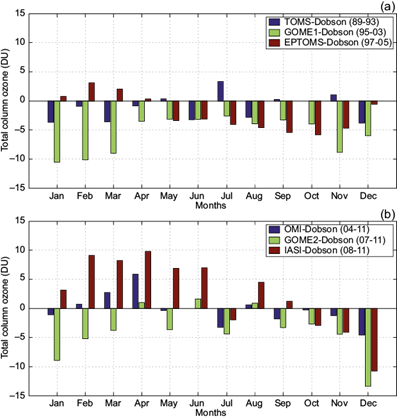
Fig. 3 Mutual ozone variations between (a) Dobson and TOMS (1989-1993); (b) Dobson and GOME-1 (1995-2003); (c) Dobson and EPTOMS (1997-2005); (d) Dobson and OMI (2004-2011); (e) Dobson and GOME-2 (2007-2011); (f) Dobson and IASI (2008-2011).
Figure 3b shows the variation between Dobson and OMI for the same period from 2004 to 2011; between Dobson and GOME-2 from 2007 to 2011, and between Dobson and IASI from 2008 to 2011. The variations between Dobson and OMI are almost negligible throughout the year except for March, April, July and December, when differences are 3, 6, 3.5 and ~4.9 DU, respectively. These marginal differences are in agreement with the results of Balis et al. (2007), who compared OMI total ozone with observations from the Dobson instrument and the Brewer spectrophotometer, establishing that OMI data products are of high quality especially in the tropics and lower latitudes. Similar to GOME-1, GOME-2 underestimated ozone values for almost all months of the year with a greater variation during summer. Measurements during other seasons were all within ±5 DU. As stated in section 3.1, IASI measurements are quite different from other instruments especially for the first half of the year when it overestimates the value of ToZ. Toihir et al. (2015) also reported a positive bias in IASI measurements with respect to OMI and Dobson observations.
Overall, the difference between the measurements range from -15 to 15 DU. Seasonal ozone variations from Dobson measurements are based on an observation period of 23 years, namely August 1989 to December 2011. It has been reported by Komhyr et al. (1989) that satellite instruments have a positive bias when compared to ground-based instruments. This can be due to individual site characteristics such as elevation above sea level. At equatorial and southern mid-latitudinal stations, the bias is ~2 to 3% and rises to about 5% over the Antarctica. Dobson instruments at main southern hemisphere sites agree with the world standard Dobson measurements to within 0.5% (Fioletov et al., 2002). However, since Dobson measurements are an effective tool with high accuracy and precision in determining ToZ, the data were used for this analysis. Comparison of these measurements show good agreement and their difference is found to be within ±10 DU (except for GOME-1 in January, GOME-2 in December, and IASI also in December). The best agreement occurs between Dobson and OMI as their difference in measurements was within ±5 DU except for April, when it was ~6 DU. Dobson and OMI difference in ToZ measurements is also within ~5 DU, as are measurements between Dobson and TOMS.
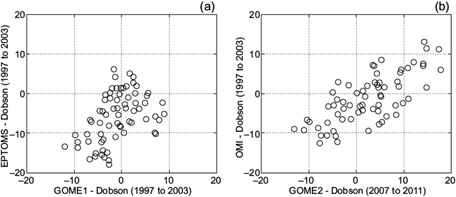
Figure 4 shows the correlation plots between instruments with similar years of overpass. Figure 4a shows the correlation plot between the difference in measurements between EPTOMS and Dobson as well as the variation between GOME-1 and Dobson between 1997 and 2003, while Figure 4b shows the correlation plot of the differences between OMI and Dobson, and GOME-2 and Dobson. It is evident from Figure 4 that the differences between EPTOMS and GOME-1 with respect to Dobson show a correlation coefficient of 0.86 while that of OMI and GOME-2 is ~0.97. This is consistent with earlier results obtained, which illustrates that GOME-2 and OMI are in good agreement with Dobson, while EPTOM shows a greater difference when compared with GOME-1.
4. Summary
ToZ overpass data from TOMS, EPTOMS, GOME-1, GOME-2, OMI and IASI were compared with Dobson ground-based measurements. The yearly ozone variation reveals significant decrease in column ozone abundance between the late 1970s and early 1990s. This decrease has been attributed to the discovery of the ozone hole in 1985 together with the Mount Pinatubo volcanic eruption of 1992. ToZ was stable in the late 1990s and early 2000s due to the stability of atmospheric chlorine and bromine levels as well as the Montreal Protocol which placed a ban on CFC materials (as illustrated by GOME-1 and EPTOMS data). Satellite measurements were compared with Dobson measurements for years when there was a data overlap, namely 1989 to 2011. The main results and findings are summarized as follows:
Overall monthly mean ToZ agrees with earlier reported results in the Southern Hemisphere, namely a springtime maximum and an autumn minimum in ozone concentration.
In general, TOMS ozone measurements are found to be overestimated when compared to other instruments. However, IASI overestimated measurements by ~7 DU especially during the first half of the year which could possibly be due to the limited number of years of overpass (< 3 years).
Second order Fourier decomposition was used to identify the increasing or decreasing trend based on the long-term period of measurements. The OMI instrument showed the largest trend of ozone increase while the minimum trend was obtained from the IASI instrument.
GOME ozone measurements were generally found to be low for all seasons in comparison to Dobson and other satellite measurements over Irene.
Ozone temporal variations reveal significant decrease in ToZ over the last 35 years (during the period up to 2000). However, in the last decade, there has been a gradual increase of approximately 10 DU in ToZ as measured by recent instruments such as OMI, IASI and GOME-2. This trend has also been confirmed by balloon observations.
The results obtained show a strong correlation (~97%) between the Dobson-OMI and the Dobson-GOME-2 variations, and ~85% between the Dobson-EPTOMS and the Dobson-GOME-1 variations. This illustrates that GOME-2 and OMI are in good agreement with Dobson, while EPTOMS shows a larger degree of difference when compared to GOME-1.
OMI shows the best agreement with the Dobson instrument in comparison to other satellite instruments, with a difference in measurements within 5 DU for all seasons.
This research investigated the climatological characteristics and variability of both vertical profile and total ozone over Irene. The results show consistency with the well-established and documented variation of ToZ over the Southern Hemisphere, namely spring maximum and autumn minimum. The analysis also revealed ozone depletion before 1995 of ~10 DU per decade, but recent instruments have measured a gradual increase in ToZ over the last decade. OMI is found to have the best agreement with Dobson while both GOME instruments show the least agreement. IASI data was found to overestimate ToZ in the first half of the year by an amount of approximately 6 DU.

