


 text new page (beta)
 English (pdf)
 Article in xml format
 Article references
 Send this article by e-mail
 Cited by SciELO
  Similars in
SciELO
Similars in
SciELO 
 Permalink
1. Introduction
Since 1985 it has been shown that total column ozone (TCO) has decreased by about 30 DU over southern mid-latitudes (Bodeker et al., 2001); thus, the number of studies investigating trends and measurement of TCO have greatly increased. In order to study ozone variability and climatology over time, researchers have used different instruments and measurement techniques at various geographic locations. Ozonesondes have proven to be the most effective instrument for both tropospheric and lower stratospheric ozone measurement (Diab et al., 2004). However, a review of Barnes et al. (1985) showed that although ozonesondes provide effective and precise ozone measurements, they do not provide global coverage. The limitation of ozonesondes may be complemented with satellite measurements, which provide global coverage but at a low frequency of observation for a selected geographical location. More recently, Ziemke et al. (2011) studied the global climatology of tropospheric and stratospheric ozone using Ozone Monitoring Instrument (OMI) as well as Microwave Limb Sounder (MLS) measurements by combining six years of measurements from October 2004 to December 2010. They validated the satellite measurements with ozonesonde measurements from the World Ozone and UVR Data Centre (WOUDC) and Southern Hemisphere Additional Ozonesondes (SHADOZ) sites. Their integrated ozone values over the troposphere and stratosphere compared to satellite and ozonesonde measurements showed good agreement, especially at low and mid-latitudes. However, a difference of about 5 DU over high latitude regions was noted. The climatological results over 20º S to 25º S and 25º S to 30º S latitude bands demonstrate annual variations with maximum values recorded during September and October, respectively.
Over an adjacent subtropical location, Sivakumar et al. (2007) presented measurements for ozone climatology and variation in the stratosphere at Reunion Island (21º S; 55º E) using in situ measurements from ozonesondes (from September 1992 to February 2005) and Système D’Analyse par Observations Zénithales (SAOZ) data (from January 1993 to December 2004). Their results revealed that ozonesonde measurements were higher when compared to data form the Stratospheric Aerosol and Gas Experiment (SAGE II) and the Halogen Occultation Experiment (HALOE), which showed a deviation of ~3% in the lower troposphere. Their seasonal ozone variation showed a springtime maximum in an altitude range between 24-28 km. They also obtained the proportional difference between measurements from HALOE and ozonesondes, which corresponded to ±5% when ozonesonde data was taken as the reference. The result of their comparison of monthly ozone data from the Total Ozone Mapping Spectrometer (TOMS) and the normalized ozone profiles obtained, showed agreement within ±5 %. They noted low values between 1992 and 1995, which they attributed to the spread of aerosols in the Southern Hemisphere from the Mount Pinatubo eruption which occurred on June 15, 1991. The results presented in this study for Irene are compared to results over Reunion Island, a southern subtropical site. Apart from the above observations, there are few studies over Irene, which concentrate mainly on the troposphere (Diab et al., 2004; Clain et al., 2009). Diab et al. (2004) presented vertical tropospheric ozone distributions and found an increase of ~10 ppbv in surface ozone except during summer months. They attributed this increase to the effect of increased anthropogenic sources during winter. The climatology of tropospheric ozone over Irene and Reunion was discussed by Clain et al. (2009) with measurements from ozonesondes, LIDAR and aircraft. They indicated that tropospheric ozone over Irene was influenced by biomass burning as well as stratospheric-tropospheric exchange in an altitude range between 4-16 km.
The research presented in this work is organized in two parts. First, the climatological and vertical variability of ozone over Irene (25.5º S; 28.1º E), South Africa, is investigated. This is followed by a study of TCO variations for this location. Irene is uniquely situated due to the availability of vertical ozone profiles as a result of the regular launch of combined radiosondes with ozone sensors (generally referred as ozonesondes). Furthermore, Irene is also a component of the SHADOZ network (Thompson et al., 2003a, b).
Irene is located between the two highly industrialized cities of Pretoria and Johannesburg in the subtropical region of the Southern Hemisphere (its geolocation is illustrated in Fig. 1). Semane et al. (2006) conclude that it is an area of interest due to the observation of high and low latitude influences attributed to transport processes; they observed an unusual stratospheric ozone decrease over Irene in May 2002. In this study, the role of isentropic transport of polar and tropical air masses was investigated and it was found that the unusual stratospheric decrease was due to the isentropic transport of air masses both in the lower and middle stratosphere. Like other Southern Hemisphere locations, Irene displays Southern Hemisphere tropospheric ozone seasonality, namely, an austral spring maximum. This behavior is different from other ozonesonde stations in the African tropics such as Ascension and Brazzaville (Diab et al., 2004).

2. Instruments and data
2.1 Ozonesondes
An ozonesonde is a balloon-borne instrument attached to a meteorological radiosonde. Ozonesondes contain electrochemical concentration cells (ECC), which consist of an electrochemical cell with two half cells made of teflon serving as the cathode and anode chamber. Both cells contain potassium mesh electrodes and are immersed in a potassium iodide solution of different concentrations. The two chambers are connected by an ion bridge to provide an ion pathway and to prevent the mixing of the cathode and anode electrolytes. When the ECC senses ozone, it reacts with the potassium iodide solution and produces a weak current that is proportional to the concentration of ozone in the sampled air.
Irene became part of the SHADOZ program in 1998 (Thompson et al., 2003a, b) and since then an average of two measurements per month have been recorded over the intervening years. Ten years of ozonesonde data collected over Irene from 1998 to 2007 (archived on the SHADOZ website (http://croc.gsfc.nasa.gov/shadoz) are used in the present study. During this study period ozonesondes are launched twice per month. Due to financial limitations, no launches took place from January-October 1998, February 2004, January 2006, July-November 2006, June 2007, and November 2007, while some months had a single launch. Due to further financial crises, measurements were stopped in 2007 and resumed in September 2012. All ozonesonde data used for this study are filtered to within 2σ (standard deviation) for better quality. Data whose standard deviations are more or less than the range selected for this study are not used. However, future research is planned to address these anomalous (high or low) ozone measurements.
2.2. Microwave Limb Sounder (MLS) instrument measurements
MLS is one of the four instruments onboard the Aura satellite. It has three objectives, namely to track stability of the stratospheric ozone layer, provide better climate change predictions and improve understanding of global air quality. MLS measurements of atmospheric parameters include temperature, humidity, cloud cover, water vapor and ice levels, all of which are recorded during both day and night. The MLS instrument uses spectral bands in the millimeter and submillimeter wavelength regions with spatial resolution performed along the suborbital track, and it varies depending on the parameter to be measured. MLS has improved the understanding of the ozone depletion process by critical monitoring the stratosphere when the atmosphere is saturated with chlorine. It has also helped in monitoring climate change through the investigation of both seasonal-to-inter-annual and long-term variability of both tropospheric and stratospheric ozone. Comparison between MLS data measurements and balloon-borne instruments shows a difference in values of ~5 to 10% (Froidevaux et al., 2006). It should be noted that the accuracy of MLS measurements is approximately 5% (see also Livesey et al., 2008).
In this study, vertical ozone profiles for ~4 years (August 2004-December 2007) are employed. The relevant data is obtained from the Aura archive for Irene’s geographical co-ordinates corresponding to the latitude and longitude ranges of 25.885-25.873º S and 28.213-28.234º E. Further information on MLS can be obtained from the website http://mls.jpl.nasa.gov/index-eos-mls.php. In a method analogous to ozonesonde measurements, MLS data have also undergone qualitative analysis and data outside ±2σ are not used for the present study.
2.3. Comparison of MLS and ozonesonde data sets
The data used for analysis of combined ozone variations are taken from ozonesonde and MLS measurements for the years 2004-2007, since only these years have common profile measurements, i.e., Irene ozonesonde data is available from 1998 to 2007 while MLS Aura data is available from 2004 to 2013. Therefore, the only overlap period for the combined data sets is 2004-2007. The ozone values from the two data sets are combined and averaged to determine the monthly mean ozone variability. The combined data set has allowed the construction of a mean ozone profile for an altitude range between 0-70 km. However, the results presented in this work are focused on the tropospheric (0-15 km) and stratospheric (15-30 km) regions. The monthly mean ozone values obtained (0-70 km) and their corresponding standard deviation are tabulated and presented in Appendix 1.
3. Results and discussion
The vertical profile variation and climatology of ozone over Irene is examined using both ground-based and satellite observations. The height profile is divided into two altitude regions, namely tropospheric ozone (0-15 km) and stratospheric ozone (15-30 km). Ozone measurements in the altitude range between 0-4 km are referred to as surface ozone for the purposes of this study. The obtained results from the above analysis are presented in the following subsections.
3.1. Monthly climatology of tropospheric ozone determined from ozonesonde data
To characterize monthly ozone climatology, ozonesonde data over Irene are combined and their average mean of corresponding months (irrespective of years) is determined. Figure 2a shows monthly mean ozone for an altitude range between 0-15 km. Variations in vertical ozone concentrations range from 0.5 × 10¹² molecules cm-3 to 2.5 × 10¹² molecules cm-3. The presence of larger amounts of surface ozone compared to ozone at higher altitudes can be attributed to increasing urban industrialization (Diab et al., 2004). Increase in the number of industries, coupled with growing population, vehicular activities as well as human activities have all contributed to an increase in the production of surface ozone.
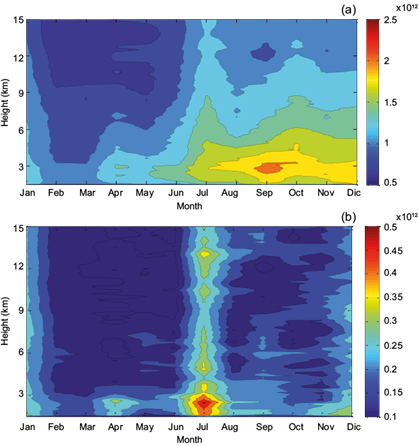
Fig. 2 (a) Monthly mean tropospheric ozone and (b) its corresponding standard deviation, obtained from ozonesonde measurements for an altitude range between 0-15 km (2004-2007).
Above 4 km a decline in ozone concentration is noted, mainly attributed to surface deposition of the ozone formed and fast titration by species emitted from the surface. There is however an increase in ozone concentration above 12 km as this altitude corresponds to the tropopause, where dynamic processes are expected to occur. In terms of tropospheric ozone seasonality, minimum ozone concentration is found to be in May. This corresponds to the season of low maritime air masses conveyed across the continent in relation to mid-latitude westerly waves, as reported by Diab et al., 2004. These authors demonstrated an ozone maximum during spring in both the lower and upper troposphere and attributed this maximum to biogenic (vegetative and microbial) emissions, lightning production, photochemical sources and most importantly biomass burning. It is noted that the biomass burning period over Irene (June-October) is mostly distributed from north to south (10º to 20º and a more easterly direction at 25º; Dlamini et al., 2013). This could be a possible reason for the observed ozone maximum in spring (August-October) in the southern hemisphere.
Figure 2b shows the monthly standard deviation for tropospheric ozone. The vertical variations in deviation range from 0.05 × 10¹² to 0.6 × 10¹² molecules cm-3. This result indicates that there is not much variability for altitudes up to a few kilometers above ground level, which could be partly due to the measurement limitations of the ozonesonde.
A maximum standard deviation with an average value of ~0.4 × 10¹² molecules cm-3 is observed in July which corresponds to the beginning of the biomass burning season over South Africa. Average standard deviation for an altitude below 3 km corresponds to ~0.4 × 10¹² molecules cm-3 in July. The high deviation observed during the month of July might be due to various factors, such as the decreased frequency of data used. Furthermore, the station also may be influenced by long range transport including the local biomass burning peak period. However, the observed standard deviation is small compared to the measured mean ozone concentration (see Fig. 2a) by ozonesondes, revealing a high accuracy of this instruments.
3.2. Monthly climatology of stratospheric ozone determined from ozonesonde data
In this section, stratospheric ozone climatology and its variability over Irene is presented. Figure 3a shows the monthly mean variation of ozone for an altitude between 15 and 30 km. As discussed earlier, monthly mean values are obtained by grouping the ozonesonde data in terms of months irrespective of the year of measurement and their corresponding calculated mean. Vertical ozone concentrations vary from 1 × 10¹² to 5 × 10¹² molecules cm-3 for the altitude range of 15-30 km. Ozone concentrations for an altitude range between 15 and 18 km correspond to ~1 × 10¹² to 2 × 10¹² molecules cm-3 and increases to ~2 × 10¹² to 4 × 10¹² molecules cm-3 between 18 and 21 km. A maximum ozone concentration of 4.5 × 10¹² molecules cm-3 is found in an altitude range between 22 and 27 km. Above 27 km, ozone concentrations decrease as expected. A maximum ozone concentration is recorded during spring (increasing from late winter) while the minimum is measured during the summer/autumn months. An earlier study over Reunion (21º S, 55º E) concluded that such seasonal ozone variations agreed with the Quasi-Biennial Oscillation (QBO) phase (easterly/westerly) Sivakumar et al. (2007). Thompson et al. (2007) stated that variations in the zonal wave number also influence the enhancement of ozone during spring and could also be partly due to transport and re-circulated ozone from African biomass burning regions. There are also pronounced mid-latitude influences due to stratospheric-tropospheric ozone injection during winter (Thompson et al., 2003a).
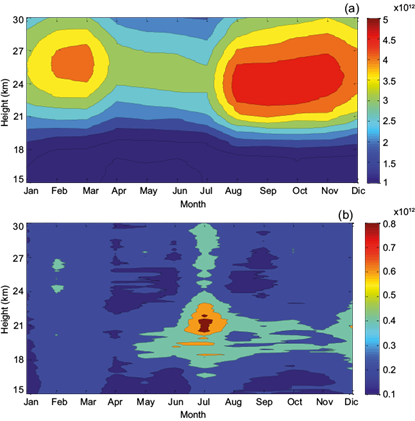
Fig. 3 (a) Mean monthly stratospheric ozone and (b) corresponding standard deviation obtained from ozonesonde measurements for an altitude range between 15-30 km (2004-2007).
The monthly standard deviation for Irene is presented in Figure 3b; values are found to be in the range from ~0.1 × 10¹² to ~0.8 × 10¹² molecules cm-3. A low standard deviation is recorded for the altitude range where maximum ozone concentration is measured for all months, which agrees with the results obtained over Reunion (Sivakumar et al., 2007). Maximum standard deviations are obtained in an altitude range between 17 and 21 km, which corresponds to the tropopause where A large deviation is expected due to occurring dynamical and chemical processes (Sivakumar et al., 2007, 2011; Jun and Hui-Jun, 2010). As determined previously, the standard deviation is found to be higher during July.
3.3 Monthly variations of stratospheric ozone determined from MLS measurements
Similarly to the analysis performed using ozonesonde data, MLS ozone measurements over Irene are analyzed for a 10-yr period. The data are grouped according to the month (irrespective of the year) and their corresponding means are calculated. The monthly mean obtained for MLS data is smoother when compared ozonesonde data (Fig. 4a). This may be due to the reduced height resolution of MLS data. The maximum ozone concentration is found to be in an altitude range between 22 and 28 km and is ~4 × 10¹² molecules cm-3. This value is lower than ozonesonde measurements for the same altitude range, which agrees with earlier published results on global ozone climatology for the 25-30º S latitude range (Ziemke et al., 2011).
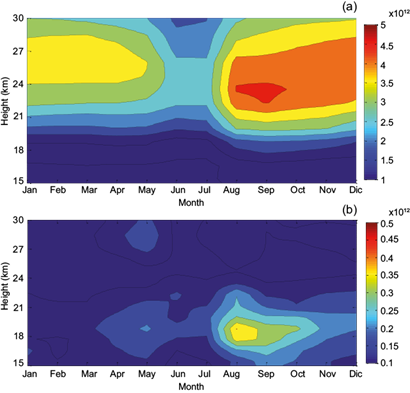
Fig. 4 (a) Mean monthly stratospheric ozone and (b) its corresponding standard deviation, obtained from MLS measurements for an altitude range between 15-30 km (2004-2007).
Apart from the above-mentioned observation, there are no significant differences between ozone levels recorded by MLS and ozonesonde for stratospheric altitudes; however, the actual differences are described in section 3.4. Jiang et al. (2007) observed a similar pattern in MLS and ozonesonde measurements over southern and northern hemisphere regions (particularly in the 20-30º S latitude range). Figure 4a shows that ozone concentration decreases above 28 km, as expected. However, low ozone values recorded during winter months need to be explored in detail.
The monthly standard deviation for MLS data is presented in Figure 4a. Over an altitude range between 15-30 km, deviations in molecule concentration vary from between 0.1 × 10¹² to 0.6 × 10¹² molecules cm-3. A maximum standard deviation of ~0.4 × 10¹² molecules cm-3 is observed in August in an altitude range between 18-20 km, which lies just above or closer to the tropopause height for Irene (Sivakumar et al., 2010). This is a region where maximum deviation is expected. It is also inferred from Figure 4b that there is a shift of a month for observed maximum standard deviation between ozonesonde data (maximum in July) and MLS data (maximum in August).
3.4 Comparison of ozonesonde and MLS Aura data
Figure 5 shows the differences in percentage between ozone concentrations measured by ozonesonde and the MLS instrument, which were calculated by subtracting ozone measurements recorded by MLS from the values obtained by ozonesonde. The results show very low differences between measurements, except at stratospheric altitudes where a maximum difference in ozone concentration is noted. Mostly, values vary by -10 to -15% for altitudes below 23 km. For an altitude range between 23-30 km, differences in percentage values are positive and mostly within 10-15%. The discrepancies between data sets may be attributed to difference in instrumentation, time overlap of measurements between ozonesonde and MLS instrument, and the method of ozone retrieval. It should be noted that Froidevaux et al. (2006) found that the accuracy in MLS measurements is reduced by about 5% in the lower stratosphere.

3.5 Comparison between MLS and ozonesonde height profiles
As discussed earlier, annual mean ozone values are obtained by compiling all the years of data, irrespective of the month. The altitude range considered for comparison of MLS and ozonesonde data is 15-30 km. The length of compared data is limited to 4 yr (2004-2007), as this is the total period of the overlapped data set, as described in Section 2.3. Although MLS measurements are recorded for an altitude range from 10 to 60 km, values between 15 and 30 km are used for comparison with ozonesonde measurements. Figure 6a shows the mean annual profile obtained from both ozonesonde and MLS. In general, ozone concentrations for 2004 and 2005 measured by ozonesonde are higher than those measured by MLS. It is also noted that ozonesonde measurements in 2004 were much higher than data recorded in 2005, a trend which is also observed in MLS measurements. The cause of this increase over a 1-yr period needs to be examined. As expected, maximum ozone concentrations are observed in an altitude range between ~22-27 km. Above 27 km, ozone concentration decreases with an increase in altitude. The MLS profile replicates the same stratospheric ozone profile, namely a gradual increase from the tropopause to a ~27 km altitude.
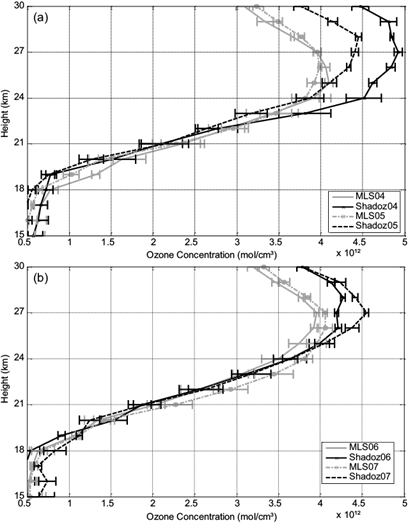
Fig. 6 Height profile of mean annual ozone obtained from ozonesonde and MLS (a) for 2004-2005, and (b) for 2006-2007.
To further examine yearly variations, mean ozone concentrations for 2006 and 2007 from ozonesonde and MLS were computed and are shown in Figure 6b. The results of ozone concentration variations with change in altitude agree with those shown in Figure 6a, except that stratospheric maximum has moved up by 1 km to an altitude range between 23-28 km. For both MLS and ozonesonde measurements, overall ozone concentration in 2007 is found to be higher than that recorded in 2006. These results are in partial agreement with a study by Ziemke and Chandra (2012), who reported the recovery of ozone levels over the last decade and attributed this finding to the stability of atmospheric chlorine and bromine concentrations. It is possible to attribute their findings to such factor, however further data is needed to quantify the level of ozone recovery in the last decade.
3.6 Monthly variations of stratospheric ozone by combined MLS and ozonesonde observations
Mean monthly values are obtained by grouping both MLS and ozonesonde data over the altitude range from 15 to 30 km for the period 2004-2007. Measurements are grouped by month, irrespective of the year. The calculated monthly mean values are presented in Figure 7a. The vertical ozone variation varies from 1 × 10¹² to 5 × 10¹² molecules cm-3. There is no significant variation in ozone concentration between 15 and 18 km as obtained earlier from both instruments separately (see Figs. 3 and 4). Ozone concentrations in this altitude range vary between 1 × 10¹² to 4.5 × 10¹² molecules cm-3. For the altitude range between 18-21 km, a steady increase in stratospheric ozone is observed from 1.5 × 10¹² to 2.5 × 10¹² molecules cm-3. A maximum ozone concentration is recorded in the altitude range from 23 to 27 km with spring ozone concentration corresponding to ~4.7 × 10¹² molecules cm-3. During autumn, a low ozone concentration of 3.5 × 10¹² molecules cm-3 is recorded, with a very similar concentration obtained during summer. All four seasons replicated the same altitude variation with respect to maximum ozone concentration, as measured by ozonesonde and MLS. Above 28 km, ozone concentration decreases with increasing altitude.
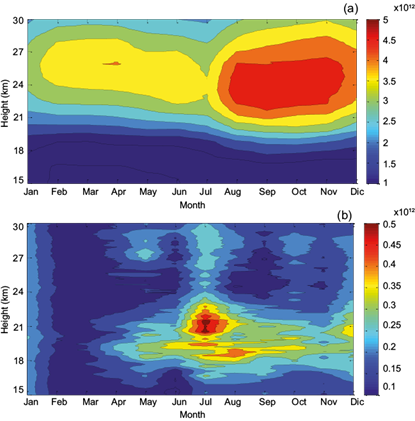
Fig. 7 (a) Monthly mean stratospheric ozone and (b) their corresponding standard deviation, obtained from a combined concentration of SHADOZ and MLS measurements for the 15-30 km altitude range (2004-2007).
The monthly standard deviation obtained from the combined ozonesonde and MLS measurements is presented in Figure 7b. Over the 15-30 km altitude region, variations are in the range 0.1 × 10¹² to 0.5 × 10¹² molecules cm-3. This range of variation is selected to illustrate the measured standard deviation. The obtained standard deviation is very close to the earlier determination of individual deviation observed by MLS and ozonesonde. In general, the standard deviation is further smoothened due to the addition of both instrument data sets. A maximum standard deviation is obtained in the an altitude range between 17-21 km, corresponding to 0.45 × 10¹² molecules cm-3. The lower height in this altitude range (~17 km) corresponds to the height of the tropopause, which can vary from 14 to 18 km over Irene. This variation in tropopause height is dependent on both season and atmospheric dynamics (Sivakumar et al., 2011; Jun and Hui-Jun, 2010). Biomass burning may also be responsible for the observed high standard deviation in July as this is the start of the biomass burning season in the southern hemisphere tropics (Sivakumar et al., 2006).
Using the above combined MLS and ozonesonde data, the mean monthly vertical ozone profile has been constructed for an altitude range from 1 to 70 km. The calculated monthly mean ozone concentrations and corresponding standard deviations (at a resolution of 1 km) are tabulated in Appendix 1.
3.7 Comparison between ozonesonde measurements in Irene and Reunion
This section compares ozonesonde measurements over Irene and Reunion, as they are adjacent southern subtropical sites. As discussed earlier, ozonesonde data from 1992-2005 were used for an analysis of their climatology. Though ozonesonde launching in Irene commenced in 1998 compared to 1992 in Reunion, these two locations may still be used for a valid comparison of their climatology and variability. Both stations displayed the well-documented ozone springtime maximum and autumn minimum, as observed in the southern subtropics. The vertical profile of maximum ozone concentration for both stations is quite similar. For Reunion during spring, maximum ozone concentration was recorded in the altitude range between 24-28 km, while for Irene, a springtime maximum was found between 22-27 km. A maximum ozone concentration of 4.5 × 10¹² molecules cm-3 was recorded in Reunion with a very close agreement to corresponding values measured over Irene. The reasons for these variations have been discussed in Section 3.2. As illustrated by the comparison of measurements over Reunion and Irene, it can be concluded that for adjacent southern subtropical sites, similar climatology and variability can be expected. The seasonal variation in stratospheric ozone over Reunion is linked to wave propagation into the stratosphere when westerly winds occur. A low standard deviation was observed above the altitude range where a maximum ozone concentration was found, and is attributed to less ozone fluctuations in this region. A maximum standard deviation was observed at both stations in the tropopause region (15-21 km). The stratosphere-troposphere exchanges as well as meridian changes are expected to likely be the source of high standard deviation in the tropopause region.
4.Summary
The research presented in this work focuses on troposphere-stratosphere ozone climatology and its variability from ground-based and satellite observations over Irene for the period 2004-007. Ozonesonde data archived in SHADOZ for the period 1998-2007 are compared to profile measurements from the MLS instrument for the period 2004-2013. Based on the above results, this research is summarized as follows:
Mean annual ozonesonde data showed an increase in ozone concentration with altitude. The region of maximum ozone concentration is found in the altitude range between 22-27 km, which corresponds to the expected stratospheric ozone maximum. The MLS has identified maximum ozone concentrations in the altitude range between 21-26 km (1 km lower than ozonesondes). Measurements from ozonesondes and MLS showed an increase in ozone concentration of 1 × 10¹² to 2 × 10¹² molecules cm-3 with an increase in altitude range from 15-18 km to 18-21 km. The ozone concentration corresponding to the stratospheric maximum was found to be 4.5 × 10¹² molecules cm-3. Irene, like other Southern Hemisphere stations agrees with the well-established and documented spring maximum and autumn minimum of both total column and stratospheric ozone.
Low values of monthly standard deviations correspond to periods when maximum ozone concentrations were recorded. Maximum standard deviations were observed at attitudes between 17-21 km, a region that corresponds to the tropopause height. Observed deviations could be related to a number of factors, including the duration of local biomass burning period, long-range transport, and a reduced number of ozonesonde measurements.
Differences between ozonesonde and MLS measurements were calculated. A small difference between these two data sets was noted, except for measurements at altitudes corresponding to the stratospheric ozone maximum. Differences in percentage were found to vary, mostly within ±10%, showing a higher variation above 20 km, which could be related to an error associated with ozonesonde measurements at altitudes above 20 km. The results of this climatology showed consistent agreement with earlier results and the documented variation over the Southern Hemisphere.
Comparison of adjacent southern subtropical sites showed similar climatology for both the stratospheric maximum and minimum values, which is linked to wave propagation into the stratosphere. A maximum standard deviation for both stations was observed in the tropopause, likely due to stratosphere-troposphere exchange as well as meridian exchanges.


