


 text new page (beta)
 English (pdf)
 Article in xml format
 Article references
 Send this article by e-mail
 Cited by SciELO
  Similars in
SciELO
Similars in
SciELO 
 Permalink
1. Introduction
Materials exposed to the environment are at risk of degradation through natural wearing processes. Since the mid-nineteenth century, air pollution has been identified as a factor that accelerates material degradation in natural and manmade materials (Cultrone et al., 2004). The irreplaceable value of the cultural heritage inherent to monuments, palaces, churches, and archaeological ruins is threatened by air pollution. Previous observations regarding many monuments and buildings with historical value have shown that accelerated deterioration is correlated with increases in urbanization, industrialization, and associated fossil fuel consumption.
The vast majority of rocks are composed of two or more different minerals. These minerals are joined in a strong structure that characterizes the stone and partly determines its color, durability, and physical and chemical properties (Winkler, 1997).
1.1 Surface recession of carbonate stones
In the natural dissolution of stone, there is a strong correlation between surface recession and open porosity. An open pore structure allows for more water intake by the stone, increasing the dissolution of carbonate minerals (Grossi et al., 1995). Acidic gases are absorbed into the stone according to its moisture content, which is determined largely by the properties that affect moisture transfer. These properties include absorption, liquid water permeability, hygroscopic moisture content, evaporation, and permeability in the vapor phase. These properties may be related to pore size distribution (Grossi and Murray, 1999).
Franzoni and Sassoni (2011) exposed various types of stones, mostly containing calcite and dolomite, to a wear process in acidic solutions. With regard to the soluble fraction, the average weight loss increased by a factor of 2.3 when the solution’s pH decreased from 5.6 to 4.0. When the pH was changed from 5 to 4, the weight loss factor was increased by a factor of 1.34. They concluded that there is a correlation between the microstructural features and the weathered rock material and established that the rate of recession depends on open porosity and the specific surface.
The deterioration of certain materials has primarily been documented in European cities and is characterized by calcium sulfate or gypsum shell (CaSO4 • 2H2O) formation, resulting from high air concentrations of sulfur dioxide (SO2). Fassina (1978) identified gypsum formation as the process underlying masonry deterioration in an artistic heritage site in Venice. Skoulikidis and Papakonstatinou-Ziotis (1981) noted that accelerated statue and monument deterioration in the Acropolis of Athens is related to dry deposits of atmospheric SO2 on the limestone and marble surfaces and their subsequent conversion to gypsum, caused by intense industrialization in this area. According to these authors, this polluting gas may have generated 85 to 97% of the gypsum detected, causing deterioration in these materials.
The walls of St. Rumbold’s Cathedral (Mechelen, Belgium) were constructed from limestone in the thirteenth and fifteenth centuries, and erosion in these walls has been attributed to gypsum formation. The abundance of sulfate anion in runoff waters confirmed gypsum formation; the runoff water samples were used to calculate an approximate average surface recession of 20 μm (Roekens and Van Grieken, 1989). Cobourn (1993) experimented with gypsum (CaSO4 • 2H2O) and epsomite (MgSO4 • 7H2O) formation in a humid atmosphere over marble and dolomite surfaces through SO2 absorption. For both dolomite and marble, the SO2 deposition rate increased as liquid water increased on the surface.
Studies of the effects of acid deposition on carbonate rocks in the US National Assessment Program on Acid Precipitation quantify erosion of stone. Chemical analyses of rain runoff solutions show that approximately 30% of erosion by dissolution may be attributed to wet deposition of hydrogen ion and dry deposition of sulfur dioxide and nitric acid between rain events. The remaining approximately 70% of dissolution erosion is explained by the leaching of carbonate rocks exposed to rain water in equilibrium with atmospheric carbon dioxide (Baedecker et al., 1992). Research on the effect of acid rain on carbonate rocks yielded a 17% contribution to chemical erosion on marble and 10% on limestone (Baedecker and Reddy, 1993). The observable damage on limestone with a relatively high iron concentration in eighteenth-century buildings in central Stockholm has been largely attributed to acid rain (Nord and Tronner, 1995).
Portland stone samples were exposed to the environment at various sites in southeastern England. A loss of material, equivalent to 16 µm yr-1 was observed for sites located in Central London, while a loss of 10.3 16 µm yr-1 was observed for rural sites. This stone wear was caused by the formation of gypsum due to direct reaction with both SO2 and sulfuric acid (Jaynes and Cooke, 1987).
Delopoulou and Sikiotis (1992) used a reactor (FP-R) in a sample train containing Pentelic marble grains, with the additional use of a filter package, to determine the effect of pollutant gases. They explained that the formation of Ca(NO3)2 was probably due to the reaction of HNO2 with marble followed by the oxidation of the obtained nitrite to nitrate, or by oxidation of HNO2 to HNO3 and the subsequent reaction with marble. Laboratory studies of HNO3 retention on marble were done, varying the following parameters: relative humidity, the flow velocity of the HNO3 mixture, the mass of the stone, grain size, and HNO3 concentration. It was shown that nitric acid is a good corrosive agent for marble. Sikiotis and Kirkitsos (1995) showed that calcareous stones (Pentelic marble, Portland limestone, and Baumberger sandstone) are appropriate sinks for gaseous HNO3. Regardless of its low porosity, at high relative humidity, marble was more vulnerable to attack by HNO3 than limestone and sandstone. Kirkitsos and Sikiotis (1996) also concluded that gaseous HNO3 is more corrosive than NO2 for marble monuments, despite the considerable low concentrations of HNO3.
Fenter et al. (1995) studied the reaction of gaseous HNO3 on calcite in a flow reactor at low pressure and found that HNO3 is absorbed on the solid with a very high efficiency. Identification of H2O and CO2 as products suggests that the reaction of nitric acid with limestone is governed by the following equation:
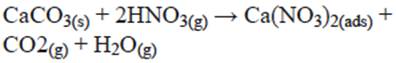 (1)
(1)
The reduction in the use of coal as an energy source is causing a decrease in SO2 concentration levels in European cities. In Mexico, the substitution of fuel oil rich in sulfur, by natural gas in power plants has had a similar effect. In turn, the increased use of the automobile makes necessary to consider the role of nitrogen oxides, chlorides and ozone as accelerators of the sulfation reaction or as direct agents on the deterioration of materials. In fact, a marked increase in the amount of deterioration is seen when the stone is exposed to a combination of SO2, NOx and O3 (Massey, 1999). Allen et al. (2000) found that the presence of NO2 accelerates the rate of sulfation of limestone helping the oxidation of SO2 to SO3 that commonly is a slow process. In another route, SO3 in water reacts with limestone to form CaSO4. Also, iron rich suspended particles, often from diesel vehicles, can increase the oxidation of SO2 on the stone surface (Grossi and Brimblecombe, 2002).
Black scabs found in European monuments and buildings located in urban environments contain molecular markers characteristic of petroleum products (Saiz-Jiménez and Hermosín, 2004). There has been a shift from high levels of sulfate deposition; nitrogen compounds and diesel soot now predominate in stones (Grossi and Brimblecombe, 2007). The presence of NO2 in photochemical smog ensures nitric acid formation; therefore, its relative importance to corrosion of old buildings and artifacts has increased (Tzanis et al., 2009).
Output from air quality numerical models was used to apply the Lipfert damage function (Lipfert, 1989) in order to produce maps of recession rates of materials. Cultural heritage sites in London and Barcelona were used to validate this method (Watt et al., 2007). Spatial mapping of combined observations and modeled data has been used to establish public policies and to understand the spatial character of air quality trends in Europe (Denby et al., 2010).
Using the micro-erosion meter method (MEM), erosion rates were determined for limestone at St. Paul’s Cathedral for decadal periods (1980-1990, 1990-2000, and 2000-2010). These rates were compared with recession rates derived from applying the Lipfert damage function (Lipfert, 1989) to available data on rain and SO2 in central London for the same periods. Erosion rates were 3.33 and 2.77 times higher than the recession rates in the 1980s and 2000s, respectively. The observed decrease in ratios was attributed to the decrease in SO2 levels (Inkpen et al., 2012).
1.2 Monument deterioration in Mexico
Some studies on monument deterioration in Mexico were found in the literature, mostly focused on evaluating and restoring this damage (Bravo et al., 1994, 1995). An analysis of ignimbrite (a type of rhyolite rich in SiO2) blocks in the Morelia cathedral (state of Michoacán) indicated that they had deteriorated by exposure to SO2. This was suggested by a correlation between their mechanical strength and the SO2 levels in the air, most likely from motor vehicles and a paper factory (Alonso and Martínez, 2003). A field study correlated limestone deterioration at archaeological sites in coastal areas in southeastern Mexico with rainwater acidity (Bravo et al., 2006). In Puerto Morelos, Quintana Roo, Mexico, precipitation was characterized by pH values of 5.35 for an average weighed volume; in certain instances, the pH was as low as 4.6 (Bravo et al., 2000). In the city of San Francisco de Campeche, Mexico, included on the UNESCO Cultural Heritage List, the Forts of San Carlos and San Pedro were built with limestone rocks. The degradation observed in these buildings was generally attributed to the volume and intensity of precipitation. However, the existence of gypsum samples from the Fort of San Pedro revealed the influence of SO2 emissions from vehicular and industrial sources in the region, including offshore oil platforms (Reyes et al., 2011).
Several studies have also been published on the primary polluting agents that contribute to such deterioration on a regional level (Martínez-González, 1992; Alonso and Martínez, 2003; Bravo et al., 2000, 2006). The aforementioned experimental studies include the identification of the mechanisms for dissolution of calcium ions in stone. Artificial acid solutions composed of sulfuric acid were used in the dissolution. These studies showed that the calcium dissolution rate is slower in stone with a high percentage of SiO2 (Martínez-González, 1992). Atmospheric corrosion maps for metals in Mexico were created using the ISO 9223 standard classification system. This work required average annual corrosion values for test stations as well as meteorological and air pollution data, such as SO2 and chloride ions (Cl-) (Mariaca et al., 1999).
1.3 Air pollution in the Mexico City Metropolitan Area
Studies evaluating the damage to cultural heritage sites in the MCMA have focused on rainwater acidity as the key factor (Martínez-González, 1992). In addition, the MCMA has serious air pollution problems that impact public health (SMA, 2008) as well as crops and ecosystems (Fenn et al., 2002; Ortiz-García et al., 2002); thus, it is likely that such pollutants also damage the cultural heritage sites. SO2 is considered one of the main pollutants in the MCMA. However, erosion and deterioration of stone in the Valley of Mexico is affected by four main factors: the extreme pollution in the metropolitan area, the semi-arid subtropical climate, the specific hydrological situation, and frequent seismic activity (Wedekind et al., 2011).
SO2 is generated by burning fuels with sulfur, emitted by volcanoes and, to a lesser extent, produced by certain industrial processes such as smelting and petroleum refining. Due to the growth of the city, including its industrial sector, SO2 became a serious pollution problem in the early 1970s. Jáuregui et al. (1981) found that this problem was due to the use of sulfur-rich fuels. Also, an oil refinery was located within the city limits. SO2 concentration levels were higher in the north of the MCMA, where most industries were located. SO2 was also spatially distributed in a north-south direction due to the city’s westerly winds. In a six-month sampling study from January to July 1959, Bravo (1960) reported that the SO2 levels in the northwestern part of the city reached an average 24-h concentration of 1.28 ppm and an average monthly maximum of 0.33 ppm. Furthermore, the SO2 concentration in the southwestern part of the MCMA reached an average 24-h maximum of 0.42 ppm; however, over the six-month study, it averaged a monthly maximum of 0.08 ppm. As a reference, the World Health Organization suggests 0.047 ppm for the average concentration over 24 h (WHO, 2006).
In 1990, the average hourly concentrations for SO2 in the MCMA (90th percentile) reached 0.115 ppm. In 2007, this percentile was reduced to 0.027 ppm (SMA, 2008); nevertheless, between 2000 and 2005, the MCMA was still recognized as the primary urban area in Latin America with high SO2 levels (WHO, 2006). It is worth mentioning that this region is still influenced by major anthropogenic sources such as the Tula industrial complex, located north of the MCMA. The MCMA is also affected by natural sources, such as the Popocatépetl volcano east of the urban area, which produces emissions that occasionally affect the urban area (García-Escalante, 2008; De Foy et al., 2009a, b). Acid rain records for the MCMA indicate relatively high acidity in the 1990s for the western portion of the region, with a gradient toward neutral values in the east. Such conditions have changed over time, and in 2007 only a small area southwest of the city maintained such acidity. The reduced acidity tended toward neutrality for the areas north and northeast of the MCMA (SMA, 2008). Due to its geographic position, the Valley of Mexico has a rainy season between June and September; thus, the lowest yearly pollution levels were recorded during these months. The dry season yields the highest concentrations of SO2 and other pollutants (SMA, 2009). Therefore, archaeological, historic, and artistic monuments in the MCMA are likely to be at risk during the entire year due to pollutants such as SO2 and acid precipitation.
There are few studies of HNO3 levels in the MCMA and virtually none that address the spatial distribution of these levels. Available data indicate that this gaseous species exhibits a behavior that is somewhat similar to that of O3, with a maximum during the day and lower values at night. There is an apparent gradient increase from north to south-southwest (Moya et al., 2004; Rosas-Pérez et al., 2006; Zheng et al., 2008; Wood et al., 2009; Cuevas, 2014). The major source of HNO3 is the reaction of NO2 with the OH radical.
Measurements of HNO3 in 2010 in the southwestern part of the MCMA (Cuevas, 2014) indicate that from midnight until 05:00 LT, HNO3 levels remain around 2 ppb. The rapid accumulation of this species begins shortly before dawn. The maximum value of the medians (3.9 ppb) is reached between 09:00 and 10:00 LT within a narrow range (3 and 5 ppb in the 25th and 75th percentiles), in apparent coincidence with values for NO2. The maximum value of HNO3 in this period was about 6.5 ppb. However, from this period until 13:00 LT, the medians decrease to about 2.5 ppb with an increased uncertainty, as the 25th and 75th percentiles range from 2 to 8 ppb, respectively, with major peaks at 10 ppb. This suggests that in the morning there is a net production of HNO3 due to the reaction of NO2 with OH. Once the OH radical maximum is reached, a competition for NO2 is established with other organic radicals. HNO3 also forms aerosols with NH3. Moreover, there is a strong HNO3 removal caused by contact with surfaces due to intensified atmospheric turbulence. By the afternoon, HNO3 levels are low mainly due to a lower formation rate. At night, the remaining HNO3 can be converted to NH4NO3 and dry deposition mechanisms rapidly remove the low remaining HNO3 concentrations. Since HNO3 is soluble in water, it is expected that in the rainy season its concentrations are in parts per trillion.
Given this background, the purpose of this study was to build surface recession maps for carbonate materials in the MCMA. These recession maps were created using the Lipfert damage function (Lipfert, 1989). A small sample of historic and artistic monuments in the MCMA built with carbonate stones was selected. Maps of the parameters necessary for the application of the Lipfert function were constructed by combining data from monitoring networks with the results of air quality models. This is the first work done in Mexico that shows a spatial estimation of the deterioration risk of cultural heritage in the MCMA due to exposure to high levels of air pollution.
2. Methods
2.1 Types and properties of stones
The stones found in Mexico’s historic buildings are andesite, tezontle, and tuff (Pirella and Ramírez, 2001) and calcareous stones. The latter can be classified as sedimentary (limestone and dolostone) and metamorphic (marble). Limestone is mainly composed of calcite (CaCO3) and dolostone mainly of dolomite (CaMg(CO3)2) minerals.
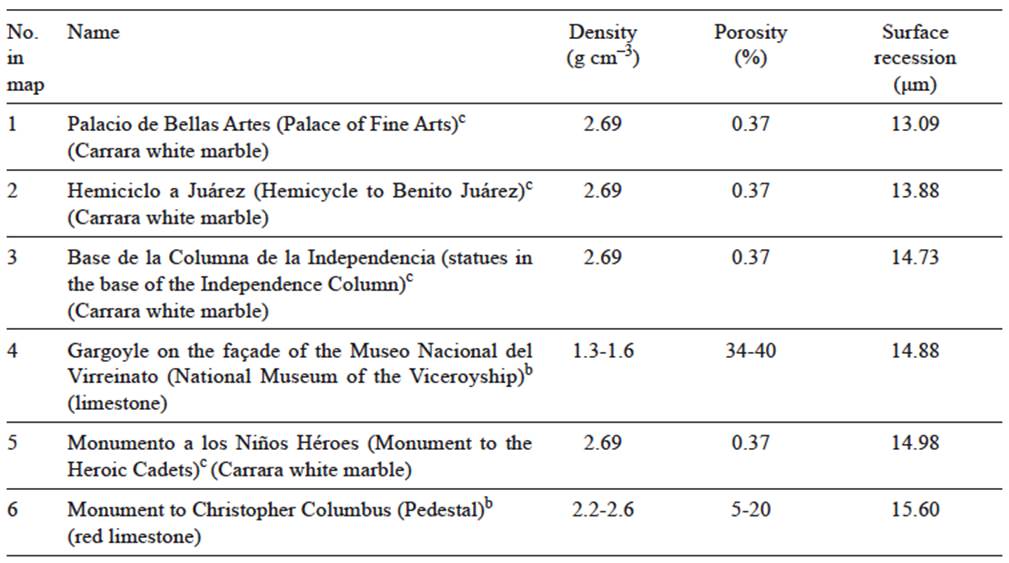
One kind of carbonate stone found in Mexico’s historic monuments is the Tepotzotlán gargoyle stone. This is an unconsolidated hybrid tuff with a very porous matrix made of carbonate and dolomite in the interior edges, and it also contains clay and glass. Its porosity ranges from 34 to 40% with a density of 1.3 to 1.6 g cm-3 (Martínez-González, 1992). It is also possible to find a type of red limestone on the pedestal of the monument to Christopher Columbus with a density of 2.2-2.6 g cm-3 and a porosity of 5-20% (Winkler, 1997).
Metamorphic rocks are igneous or sedimentary rocks recrystallized by the effects of temperature and pressure. Recrystallization of limestone results in marble. Marble is composed of large, interlocking calcite crystals, which form the recrystallization of smaller grains in the parent rock (Tarbuck et al., 2005). Carrara white marble is found in the Palacio de Bellas Artes, Hemiciclo a Juárez, the statues at the Columna de la Independencia, and the Monumento a los Niños Héroes. Carrara white marble has a density of 2.69 g cm-3 and porosity of 0.37% (ASTM, 1979), and in accordance with its density value is classified as class III (high density) (ASTM, 1996).
2.2 Selection of the damage functions
Several surface recession functions for stones have been developed, mainly in Europe. Haynie et al. (1976) focused on white Cherokee marble; Livingston (1992) on carbonate stone; Webb et al. (1992) worked on samples of Portland limestone; Baedecker et al. (1992) on marble and limestone; while Tidblad et al. (1998, 2001) studied Portland limestone and dolomite as well as white Mansfield sandstone. Empirical recession functions were developed as part of large European projects (Kucera, 2005; Kucera et al., 2007).
Damage functions available in the literature often use nonlinear regression equations. Only a few have a theoretical and mechanistic approach. It is desirable that the damage functions represent a large number of buildings and various types of stone (Brimblecombe and Grossi, 2008). To this end, it is advisable not to ignore the petrophysical properties of rocks. These properties account for the degree and type of wear due to the strong correlation of recession with open surface porosity (Grossi et al., 1995). Damage functions express the quantitative relationship between pollutant concentrations, meteorological variables, and deterioration of the material (Grossi et al., 2008). The damage function postulated by Lipfert (1989) for generic calcite considers a model of limestone and marble of medium and high density (ASTM, 1996). The function assumes a constant stone density of 2.7 g cm-3. However, there are stones such as Portland and Hontoria with porosity of 20% and a density close to 2.0 g cm-3 (Bonazza et al., 2009).
Acid rain dissolution models were used to estimate the chemical degradation of calcium carbonate rocks in buildings (Reddy et al., 1985). These models associated laboratory data on physical properties, providing the basis for the theoretical damage function. This function considers three mechanisms for the loss of stone material (Lipfert, 1989). The first is the dissolution of stone by ‘clean’ rain water at a pH > 5.5. This is due to the solubility of calcite as a function of atmospheric CO2, temperature, and porosity, as well as the physical characteristics of the stone. The second mechanism is the reaction with gas-phase SO2 and HNO3, which requires knowledge of their deposition rate. This allows for the estimation of the flow to the surface of the stone depending on weather conditions and the configuration of the stone. The third mechanism is the increased dissolution of stone by acid rain. This is affected by solubility equilibrium (Reddy et al., 1985) and by the kinetics of the dissolution rate (Lipfert, 1989).
Lipfert (1989) quantifies the annual recession of CaCO3 stone, considering the mechanisms of natural dissolution or karst effect, acid rain, and the deposition of pollutants:
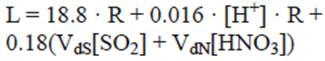 (2)
(2)
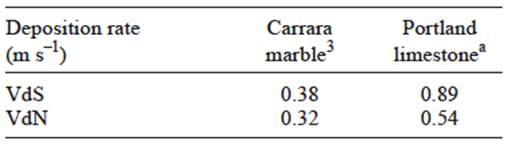
where L = yearly recession (μm year-1); 18.8 is a constant based on the solubility of CaCO3 in equilibrium with 330 ppm (μm m-1 of precipitation); R is the precipitation rate (m year-1); 0.016 is a constant valid for rain pH between 3 to 5; (H+] is the hydronium ion concentration (μmol L-1) estimated from the annual pH of rainfall; and VdS and VdN are deposition rates (cm s-1) for SO2 and HNO3, respectively. Concentration units for these are given as μg m-3. Table I shows the deposition rates used in the Lipfert function.
The carbonate rocks considered in this study are marble and limestone. Nitric acid is not commonly measured in air quality monitoring networks. The availability of data is therefore limited. The following empirical function, derived in the MULTI-ASSESS project, allows for the estimation of nitric acid from NO2, O3, Rh and temperature data (Kucera, 2005):
 (3)
(3)
where [HNO3] = concentration of HNO3; T is temperature in ºC; [NO2] = concentration of NO2; [O3] = concentration of O3; Rhr = relative humidity (%). All concentration units are in μm m-3.
The estimation of nitric acid required the annual average hourly values from (3). Parameters were used from the databases generated by the Red Automática de Monitoreo Atmosférico (Automatic Atmospheric Monitoring Network, RAMA) (SMA, 2011) and the Red de Meteorología y Radiación (Solar Meteorology and Solar Radiation Network, REDMET) (SMA, 2011). These parameters are simultaneously monitored in nine stations: Tlalneplantla, Tacuba, ENEP-Acatlán, Chapingo, Xalostoc, Merced, Pedregal, Plateros, and Cerro de la Estrella.
2.3 Calculation sequence
To generate the recession map, the following steps were performed. First, the monuments were located and identified based on the data and criteria in official catalogues for the type of construction material. One category was used: calcareous (carbonate) stone (limestone and marble). In the second step, the available data on measured concentrations of sulfur dioxide (SO2), hydronium ion (H+), and meteorological parameters were integrated with results from an air quality numerical simulation model. The data and results were applied using mathematical functions suitable for the construction of spatial distribution maps through interpolation. Subsequently, these values were used to apply damage functions corresponding to a certain type of stone in order to generate the recession layers. In the next stage, the recession values for the historic or artistic monument were extracted from the recession layer according to the monument’s geographic location in the MCMA. These steps are summarized and described in the following paragraphs.
2.3.1 Classification and selection of the cultural heritage sites
The Ley Federal sobre Monumentos y Zonas Arqueológicos, Artísticos e Históricos (Federal Law on Archaeological, Artistic, and Historic Monuments and Zones) of Mexico includes the following text: “Archaeological monuments are all those remains of pre-Hispanic cultures dating back to before 1521, the year when Mexico was conquered by Hernán Cortés. Historic monuments are the heritage of the colonial period (1521 to 1810) and of the rest of the nineteenth century. Artistic monuments are the architectural and urban heritage built after 1900”. In this study, cultural heritage sites included historic and artistic monuments located in or close to the MCMA. Classification was based on the Instituto Nacional de Antropología e Historia (National Anthropology and History Institute, INAH) catalogue, which refers to 2300 archaeological monuments, 10 500 historic monuments, and 7168 artistic monuments in the Federal District and the State of Mexico (CONACULTA, 2003). From these sites, which are protected by the Federal Executive, under custody of the INAH, and open to the public, a sample was selected. Then, the sample was arranged by geographical area and material type. The buildings constructed from carbonate stone comprise two historic and four artistic buildings. Their names and locations are shown in Table II; the labels for the sites in the figures correspond to the site-identifiers in this table.
2.3.2 Database for damage function parameters
In this study, SO2 data generated by (RAMA) were used (SMA, 2011) along with values produced using the Multiscale Climate Chemistry Model (MCCM), which employs mathematical simulations in order to approximate concentrations in areas for which measurements are not available. The MCCM was developed by the Institute of Meteorology and Climate Research-Atmospheric Environmental Research (IMK-IFU, German initials), affiliated with the Karlsruhe Institute of Technology, Germany; it combines meteorological and chemical processes. This model includes the gaseous phase, dry deposition, and anthropogenic and biogenic emission chemistry, and it also incorporates explicit descriptions of precipitation and cloud processes (Grell et al., 2000).
In order to establish the net base values for SO2 from interpolation, the average values measured at the stations were combined with the values generated using the MCCM model. The SO2 values from the model are representative and include a downward bias in the troposphere proximal to the surface (0-18 m) for 2007. These results were generated for a domain with 31 × 31 cells with 3 km on each side. It is important to note that the MCCM model underestimates the SO2 concentrations because the entry data are SO2 concentration values from the 1999 data recorded by the national emissions inventory of the Instituto Nacional de Ecología (National Ecology Institute) of Mexico, which may not represent the MCMA conditions for 2007 (García-Reynoso, 2010). To compensate for this discrepancy, a provisional adjustment factor was generated based on a spatial and temporal comparison with the RAMA stations. Using this factor, the MCCM model concentrations were approximated with the RAMA station measurements. Using this adjustment, a 0.52 concordance index was calculated for SO2. The annual concentration values for SO2 include values from 26 monitoring stations (SMA, 2011) and the values estimated using the MCCM model.
For the hydronium ion ([H+]) concentrations, the data from the Red de Depósito Atmosférico (Atmospheric Deposit Network, REDDA) were collected for 2007 (SMN, 2011). The average annual concentrations for hydronium ions ([H+]) include values from 16 stations in this network.
Precipitation (rain) levels were collected from the following network databases: REDDA (SMA, 2011), PEMBU (PEMBU, 2011), and SMN (SMN, 2011); interpolation functions were then applied. The accumulated annual precipitation for 2007 includes values from 53 meteorological stations distributed throughout the Valley of Mexico air basin.
In addition, in order to estimate a possible trend with regard to recession rates resulting from the set of public-health-focused air pollution mitigation actions implemented in Mexico City, we used the same data sources, except for PEMBU, to estimate quadrant-averaged recession rates for Mexico City in 1990.
2.4 Creating layers using a Geographical Information System
2.4.1 Selection of the interpolation method
Under the Geographic Information Systems (GIS) paradigm, the layers represent a surface model that integrates statistical properties for the sample data (Canada, 2006). The layers can be created using deterministic interpolation methods such as the weighted mean through inverse-distance weighting (IDW) and the kriging geostatistical estimator described in Denby et al. (2005). The IDW method is based on the notion that proximal phenomena must have a greater influence on the estimated value than distal phenomena. Each measured point has a local influence, which is reduced linearly by the distance between the sampled and unsampled points. The intensity by which the local influence is reduced by distance is controlled by the weighting parameter “power”. If this parameter is zero, the influence is not reduced by distance, the weight will be the same, and the projected value will be an average of the values measured. If “power” is very high, only the points in close proximity to the measured values will influence the estimated value. When the power value is 2, the data are interpolated through the inverse distance squared. The kriging method is a geostatistics technique similar to IDW. It uses a linear combination of weighted values in known positions to estimate values in unknown positions. The kriging method considers the distance between the sampled points and their autocorrelation. Applying the kriging method implies that modeling the semivariogram describes spatial continuity for the data and how this continuity is modified by distance and direction. Similarly, the kriging method should consider the number of neighbors at the time of interpolation; it should consider the semivariogram mathematical function adjustment that best condenses the observed data. As a result, this mathematical function constructs the best interpolated layer. The selection of the layer depends on the optimum prediction values from the error statistics and the coefficient of determination R2.
An important property of the modeling performed using kriging is that it tends to eliminate extreme values; it produces lower estimation error and creates generalized smoothing, while IDW modeling tends to form islands around the sample points (Canada et al., 2010). Nevertheless, the two methods are considered acceptable for atmospheric science applications. The choice of method depends on the number of observations and their spatial arrangement (Rojas-Avellaneda, 2007; Kumar et al., 2011).The kriging method is a standard procedure commonly used in the European Monitoring and Evaluation Programme to create historic concentration maps (Denby et al., 2005). For example, the kriging method known as “simple kriging” is the method most commonly used to spatially analyze data on acid deposition. It uses an exponential function to model the semivariogram (Venkatram, 1988). The kriging method has also been applied to interpolate temperature data in 10-km cells using an exponential function (Philips and Marks, 1996). Ordinary kriging has been used to map the temporal trends in European air quality by considering SO2 (Denby et al., 2010).
The spatial representation in this study was developed using the ArcGIS software (ArcGIS 9, 2008); ArcGIS uses the “geostatistical analysis” extension, which includes advanced tools for exploratory analyses on spatial data and assists in the construction of statistical surfaces. Optimum layer construction depends on the use of the proper interpolation method, which is determined for constructing vector layers by using IDW and ordinary kriging for each parameter. These layers were transformed into raster layers for subsequent application in the damage functions. Then, the interpolation method was selected based on the best coefficient of determination R2 for the relationship between the observed and projected values at a single position, both in the vector and raster layers.
Kriging and a circular variogram model with five neighbors, or at least three, was used to interpolate the SO2 concentration layer yielding a coefficient of determination R2 = 0.58. The kriging method with logarithmic transformation, a spherical function, five neighbors and two as a minimum was used to generate the temperature layer with the coefficient of determination R2 = 0.54. The IDW method with five neighbors and three as a minimum was used to produce the H+ layer with R2 = 0.08. This value was generated based on concentration data for hydronium ions and precipitation reported by the REDDA for 2007 (SMN, 2011). The graph used best represents the data reported by the REDDA for this year (SMA, 2008). The vector kriging layers for the parameters were transformed into raster layers, which generated the following coefficients of determination: [SO2], R2 = 0.60; temperature, R2 = 0.56; [H+], R2 = 0.08; and PP, R2 = 0.83.The HNO3 layer was obtained using the spatial analysis tool ArcToolbox geoprocessor. A kriging interpolation with the spherical variogram model was applied, producing a coefficient of determination R2 = 0.99.
3. Results and discussion
Table II shows the names and classification of artistic and historic monuments. It also shows the physical properties and estimated recession values for the selected sample of monuments made of marble and limestone, and the quarter of the MCMA where they are located as named by the local environmental authority.
The recession of the two kinds of carbonate stones considered herein was constructed using the “raster calculator” tool included in the spatial analysis extension for ArcGIS 9. This tool performs analytical operations using mathematical functions. The process includes applying the damage function, which inserts the raster layer values for the corresponding parameters. These layers represent a terrestrial space property through a series of square cells of equal size (pixels). The raster model is appropriate for representing continuous variables in space, such as meteorological and air pollution variables (Moreno, 2006). The terrestrial space properties were the independent variables in the Lipfert function (Lipfert, 1989). Although somewhat arbitrary for comparison within the area of study, the value levels of the four variables in the Lipfert function were divided into five color ranks.
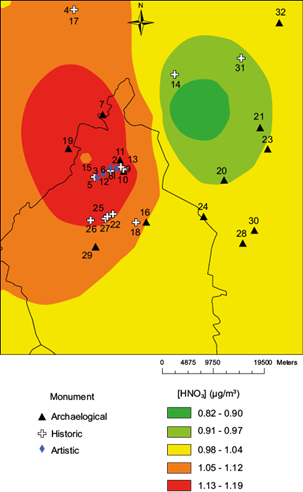
First, the [SO2] layer is shown in Figure 1, which includes the monument locations (Tables II and III). Eighteen sites are in the two higher color ranks, eight in the intermediate, and five in the two lower color ranks. The spatial distribution of [HNO3] is shown in Figure 2, with 23 sites in the two higher color ranks, five in the intermediate color ranks, and four in the lower color ranks.
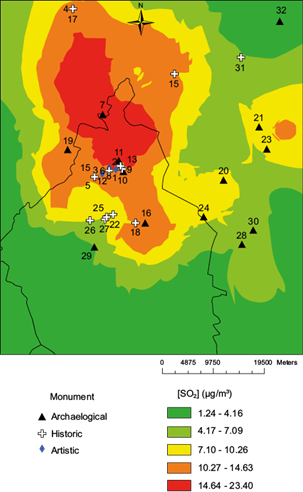
Table III Estimated concentration values of H+, SO2 and HNO3 for volcanic stone.
aArcheological monument; bhistorical monument; cartistic monument.
* Sources for types of building materials: INAH catalogues.
By contrast, the [H+] (Fig. 3), shows no site in the two higher color ranks, 19 in the intermediate level, and 12 in the two lower ranks. Following the same trend, with regard to precipitation (Fig. 4), only three sites are located in the two higher color ranks, 13 in the intermediate level, and 16 sites in the two lower levels.
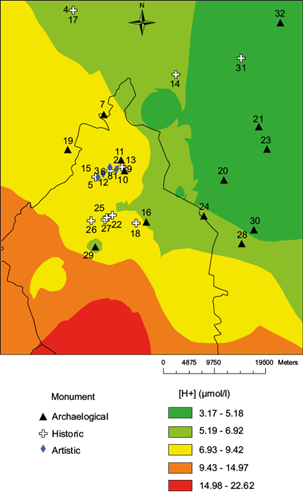
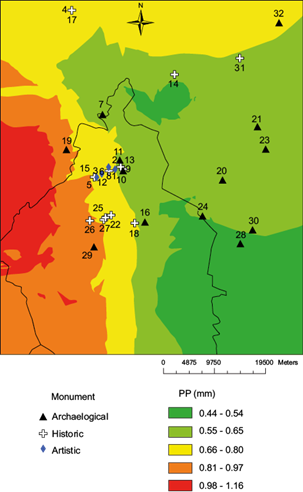
Figure 5 overlays the distribution of marble and limestone sites with the 2007 spatial distribution of their respective recession rates. They were calculated with the “raster calculator”, applying the Lipfert function using the layers shown in Figures 1-4. For 2007, two of the four marble sites in Table II, are in the intermediate range of recession and the other two are in the lower levels (Fig. 5). Also, the two limestone monuments included in Table II (Fig. 5) are in the intermediate range.
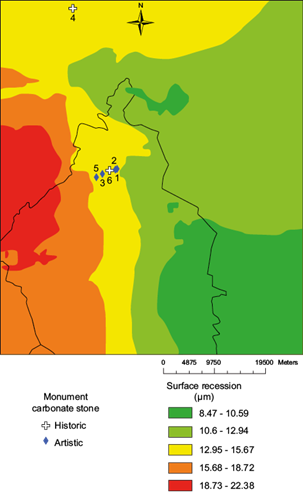
Table II shows recession values for the Palacio de Bellas Artes (13.09 µm), the base of the Columna de la Independencia (14.73 µm), and the Monumento a los Niños Héroes (14.88 µm), all made of marble. They are on a straight line 4.4 km in length. Of the Lipfert variables, precipitation seems to be the variable with the largest difference. The base of the monument to Christopher Columbus, made of limestone and located only 1.4 km from the Palacio de Bellas Artes, shows the highest recession value (15.60 µm). The higher SO2 and HNO3 deposition rates on limestone explain the higher recession value.
The sparsity of sites in Figure 5 compared with the previous figures points out that for most of the sites in the sample, recession rates can not be estimated due to the lack of damage function for the kinds of volcanic rocks used as building materials. Let us assume that this kind of materials are also sensitive to SO2, HNO3 and acid deposition. Table III shows the estimated values of these three pollutants to which those 26 buildings made of volcanic materials were exposed in 2007. Table III could be appended with other 135 buildings made of similar materials extracted from the INAH catalog (INAH, 2015) and located within the modeling domain.
Deterioration maps for materials of the unique cultural heritage in the MCMA are unquestionably needed. This area has many archaeological, historic and artistic monuments that have been designated World Heritage Sites by UNESCO. Some noteworthy monuments include the pre-Hispanic city of Teotihuacan and the Historic Center of Mexico City (CONACULTA, 2003). The Spaniards used the stones taken from pre-Hispanic monuments to build churches, palaces, and government buildings. Some, but much less, historic and artistic monuments were also made of limestone and marble.
The primary material used for the construction of this historic and archaeological heritage was andesite originated from the Chiluca quarries. The Chiluca stone is a virgin rock, a porphyritic andesite augite, consisting mainly of 85% andesite and 6% augite. It has a porosity between 15 and 17% and a density of about 2.23 g cm-3. The stone of the Metropolitan Cathedral was found to be a consolidated volcanic rock, friable by weathering. This rock generally comprises 85% andesite and 15% hornblende crystals. It has a medium porosity, from 14 to 17%, and its density ranges from 2.32 to 2.27 g cm-3, depending on the porosity (Martínez-González, 1992; INAH, 2007; Reyes-García, 2011). In addition, stucco, a plaster and limestone-based composite, was also used, due to the ease of painting walls or decorating interior walls with it (Martínez-González, 1992).
The pink stone of Tepotzotlán found in the Museo Nacional del Virreinato is a devitrified tuff (low density and very porous), consisting of a siliceous paste made almost entirely of tridymite, which is included in the tectosilicate group. It has an unhealthy layer of weathered clay, organic in appearance. It contains a fraction of sodium plagioclase. This stone has a very high porosity, from 40 to 55%, and its density is low, ranging from 1.52 to 1.66 g cm-3 (Martínez-González, 1992). Similar petrophysical properties were also found in the stones from the Valley of Mexico used by the Aztecs to make buildings such as the Templo Mayor, in which the main building stone is called tezontle. In Náhuatl, the Aztec language, tezontle is the name for extrusive volcanic basaltic andesite scoria. These buildings were demolished by the Spaniards in order to use the materials for the construction of the Metropolitan Cathedral and other colonial constructions such as the Palace of the Dukes of Heras Soto (Wedekind et al., 2011).
Due to the abundance of andesite, tezontle and tuff stone (Pirella and Ramírez, 2001) in the cultural heritage of the MCMA, the need for specific damage functions is evident. Additionally, these materials may also be sensitive to other pollutants not discussed here.
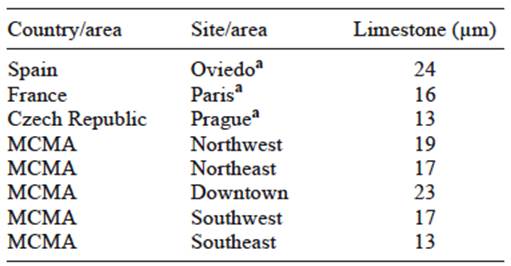
Finally, Table IV shows the estimated recession values for limestone, using the Lipfert function with air pollution and meteorological long-term annual period mean values for 1981-2000 in some European cities (Grossi et al., 2008). This table also contains limestone recession values estimated for 1990 in the five geographical areas used by the Metropolitan Environmental Commission to divide the MCMA. The historical data of pollutants and meteorological parameters used for (3) and the Lipfert function were obtained from local monitoring and meteorological networks (SMA, 2011). In 1990, in the MCMA, recession in the downtown area (CE) was close to the value reported for Oviedo. The northeast (NE) and southwest (SW) areas had recession values similar to those reported for Paris. Values for the southeast (SE) area were similar to those for Prague. From 1990 to 2007, the recession rates decreased by a factor of 1.3-1.5 in the MCMA, basically due to reductions in SO2 emissions.
4. Conclusions
Most studies on cultural heritage deterioration in the MCMA have focused on characterizing the damage to the materials of specific monuments for restoration purposes. The deterioration of cultural heritage in Mexico has also been attributed principally to acid rain, as the primary cause of damage to materials, but dry deposition of SO2, NO2 and HNO3 may also contribute.
To date, the only existing maps in Mexico for damage to building materials are for corrosion of metals.
To the best of our knowledge, this is the first work in Mexico that provides a spatial distribution of existing historical and cultural heritage carbonate stone at risk of deterioration. This was done by mapping areas of corrosion or deterioration rates. Historic and artistic monuments in these areas are susceptible to damage due to pollution and weather conditions.
In this work, maps of atmospheric concentrations of SO2 and HNO3, precipitation, pH of rain, and other weather parameters in the MCMA were obtained by interpolating data from monitoring stations and air quality models in a GIS. The maps were then overlaid in the GIS, and the Lipfert function was applied at the specific coordinates of a small sample of cultural heritage sites.
In contrast to the building materials used in Europe and the USA, in Central Mexico, andesite tezontle and tuff stone are very abundant building materials at historic and archaeological sites. Paramount to a proper assessment of the deterioration risk of that unique heritage is the creation of damage functions such as Lipfert’s function for the specific materials used by the ancient Mexicans and the conquering Spaniards.
Based on the lower density and higher porosity reported for the limestone called Tepotzotlán gargoyle, the use of Lipfert’s damage function may have led to an under-estimation of recession values for this kind of carbonate stone found in Mexico’s historic monuments. Specific Lipfert’s coefficients may also be needed.
In addition to these ad hoc damage functions, recession maps for the cultural heritage in Central Mexico can be improved by: i) including cultural heritage as a criteria for the design of air pollution and deposition monitoring networks, ii) improving emission inventories, and iii) using air quality models that are able to properly represent urban and complex terrain meteorology.

