


 text new page (beta)
 English (pdf)
 Article in xml format
 Article references
 Send this article by e-mail
 Cited by SciELO
  Similars in
SciELO
Similars in
SciELO 
 Permalink
1. Introduction
Atmospheric corrosion is the deterioration of a material due to electrochemical reactions of its surface with the constituents of the surrounding atmosphere. Climatic factors such as temperature, relative humidity (RH), precipitation and air pollution, determine the atmospheric corrosion of metallic elements exposed to such conditions (Oesch, 1996). Air pollutants, together with moisture, are key elements of atmospheric corrosion; in consequence, corrosivity depends largely on the thickness of the humidity layer and the degree of pollutant deposition rates on the material surface. When a material is exposed to the atmosphere, the metal surface will be covered with a thin layer of water resulting from atmospheric moisture. This layer dissolves contaminants and allows for the deposition of corrosive species on the surface. Studies on atmospheric corrosion performed in many cities have concluded that the nature of atmospheric pollutants and their level of concentration play an important role on the service life of different engineering materials (Kucera, 2003; de la Fuente et al., 2013)
The atmospheric corrosion of steel increases mainly by the time of wetness, which depends on meteorological factors such as temperature and RH, and some pollutants, which tend to significantly accelerate the attack. In particular, the presence of sulphur dioxide (SO2) in urban and industrial atmospheres, and chlorides in areas influenced by the sea (Mendoza and Corvo, 1999) have been highlighted. However, in the last decades decreasing SO2 concentrations have resulted in a new pollution condition. In tropical climates, the influence of high temperatures combined with high precipitation and humidity are observed, because the moisture over time is very high (Mikhailov et al., 2007; Corvo et al., 2008).
Some approaches have been used to estimate the behavior of a material in a given atmosphere, such as direct measurement of atmospheric corrosion through the detailed follow up of simple behaviors of materials of interest, and application of dose-response functions or damage functions. These have been associated with the degree of deterioration of similar materials in equivalent microclimates (Tidblad et al., 2001) through the application of a function to predict annual damage caused by atmospheric corrosion. Damage functions or dose-response equations for carbon steel corrosion determined in several studies are shown in Table I.
Table I Dose-response functions for the atmospheric corrosion of plain carbon steel regarding climatic conditions.

rcorr: corrosion rate in µm yr-1; k: corrosion rate expressed in terms of a decrease of the metal thickness in µm; ML: mass loss in g m-2; T: mean temperature in ºC; RH: relative humidity in %; [SO2]: gaseous SO2 concentration in µg m-3, DSO2: SO2 deposition rate in mg m-2 day-1; DCl: Cl- deposition rate in mg m-2 day-1; Rad: total solar radiation in MJ m-2 year-1; rain: amount of precipitation in mm; [H+]: H+ concentration of precipitation in mg L-1; PM10: concentration in µg m-3 of particulate matter up to 10 µm in size, and τ: time in years.
Among some of the most significant results, it is worth mentioning the establishment of a dose-response function for the corrosion of plain carbon steel due to the impact of a significant number of environmental parameters.
1.1 Dose-response function considerations
The statistical methods used in obtaining dose-response functions for various metals use multivariate models, which are based on techniques for estimating functions with cross-sectional analyses or time series analyses. Nevertheless, a procedure for using both transversal and time series data is the longitudinal data, whose advantages (Gujarati and Porter, 2009) are:
The model has explicitly taken into account the heterogeneity caused by the atmosphere at each site, allowing the existence of specific variables per station.
The model provides more data, more variability, less colinearity among variables, more degrees of freedom and more efficiency.
This model is more suitable for studying the dynamics of change, when cross-sectional data per station are repeated.
The model allows detecting and measuring effects which cannot be observed in cross-sectional data or time series. For example, the effect of pollution and atmospheric parameters on corrosion can be better studied because the model includes the variations of other variables.
Allows identifying factors other than atmospheric parameters of a region in a single equation.
Longitudinal data can be estimated using methods such as the pooled ordinary least squares (OLS) model, the fixed effects least squares dummy variable (LSDV) model, the fixed effects within-group or the random effects model.
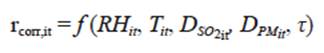
The effect of atmospheric variables and pollutants on the corrosion rate is analyzed by the dose-response function represented by Eq. (1):
 (1)
(1)
where DPM is the particulate matter (PM) deposition in mg m-2 day-1 and τ is the exposure time (months); i corresponds to the i-th corrosion station and t is the time period in which data were collected.
According to the dose-response functions reported by Mikhailov (2001) and Mikhailov et al. (2004, 2007) and using the methodology of longitudinal data, functions for any city are represented by Eq. (2):
 (2)
(2)
where Di is a dummy variable or a dichotomous variable which is used to take into account the specified characteristics of each station, and n is the number of corrosion stations. Eq. (2) shows ML as a linear function of an asset of explanatory variables. On the other hand, dichotomous variables are introduced in this equation in order to use longitudinal data (Eq. 3).
 (3)
(3)
Eqs. (2) and (3) represent deviations of the corrosion rate between the experimental and estimated values from the dose-response function.
Eq. (3) assumes that the variables included in the model affect similarly carbon steel throughout the city. This equation is in accordance with the studies of Mikhailov, but also assumes that there is a statistically homogeneous behavior in the different sites of the region. For the above two equations, parameters β 1, β 2, β 3, β 4 and β 5measure the variables effects on the corrosion rate.
The main difference between these two equations is that Eq. (2) assumes a linear relationship, while Eq. (3) assumes an exponential relationship.
1.2 Site
Colombia is an equatorial country with the Andes mountain range crossing the west side from south to north and with a wide geographic diversity, including savannas, mountains from the sea level to perpetual snow peaks, desserts and forests.
Bogotá city, the capital of Colombia and one of the most air-polluted cities in the region, is located in the center of the country in an intertropical zone 2600 masl (Franco et al., 2015). It shows concentrations of pollutants such as sulfur oxides (SOx), PM, nitrogen oxides (NOx), and others, distributed within urban and periurban areas according to socio-economic activities. These variables along with the climatic features of the city converge in degradation processes of materials exposed to the atmosphere.
A former research reported that atmospheric corrosion of carbon steel in Bogotá was less than 50 μm yr-1 (400 g m-2 yr-1) according to meteorological parameters and pollutant concentration data collected by the city network of environmental assessment during several years, and there was mass loss of carbon steel after one year of exposure (Ríos Rojas et al., 2015). Nevertheless, a damage function of carbon steel corrosion from measurements of standard specimens was not found.
The aim of this study was to determine the behavior of plain carbon steel in Bogotá from measurements in different exposure sites, searching for an annual dose-response function for this material. Therefore, the current study was oriented to assess general atmospheric corrosion of plain carbon steel in Bogotá city from the exposure of samples in specific points of interest, locating racks according to the ASTM G-50 standard.
2. Experimental procedure and materials
Commercial AISI-SAE 1006 carbon steel plates (100 × 150 × 1.6 mm) were used to evaluate corrosion rates. The composition of steel was 0.061% C, 0.015% Si, 0.180% Mn, 0.008% S, 0.001% P, 0.019% Cu, 0.040% Al, 0.020% Cr, 0.010% Ni. The plate surface was initially prepared by degreasing with ethanol and drying with an air jet. Before testing, the plates were weighed on an analytical balance of 0.1 mg of resolution; the initial mass was recorded and then they were stored in a desiccator prior to exposure. The evaluation of carbon steel plates was then carried out by triplicate over 12 months. Specimens were withdrawn after 3, 6, 9 and 12 months, between February 2012 and February 2013. Likewise, the values of RH and temperature were recorded continuously at each site using a thermohygrometer (42270 Extech) (recording three points per hour).
Deposition rates of SO2 and particulate matter (PM) were determined each three months using passive samplers, which allow quantification of cumulative air pollutant deposited on. The deposition rate of SO2 at each site was determined by the lead dioxide technique, according to standard ASTM D-2010 (ASTM_D2010, 2004). These candles were exposed for three months, then removed and replaced with other candles. The deposition rate of PM was determined in triplicate from petri glass dishes located into a louvered enclosure. After exposure, the disk was washed and the amount of deposited material was evaluated, which allows calculating the deposition rate of PM. Both candles and discs were installed in a rectangular louvered enclosure to provide maximum protection from rain.
2.1 Exposure sites
Carbon steel plates were exposed in eight different sites across Bogotá as it is shown in Figure 1. The exposure angle was 45º from the horizontal and with the upper surface facing south according to ASTM G50 (ASTM_G50, 2003). The exposure sites were selected based on the level of pollutants and meteorological parameters reported by the city network of environmental assessment, and located according to standards for sampling total sulfation activity and chloride deposition from the atmosphere, as well as siting criteria for ambient air monitoring (ASTM_G140, 2002; ASTM_D2010, 2004; EPA, 2006). These sites were distributed as follows: one in the north (Calle 170), one in the northwest (Suba-Corpas), one in the east (Candelaria), one in the west (Federman), two in the southwest (Fontibón, Autopista-Sur), and two in the south (Restrepo and USME). The higher density of stations in the west and south was due to the higher concentration of pollutants in those areas.

3. Results and discussion
3.1 Meteorological variables
Bogotá is located on a very high plateau, surrounded by a mountain range that influences its precipitation regime. Bogotá´s rainy seasons run from March to May and from September to November. Meteorological data of the city of Bogotá are shown in Figure 2.

Fig. 2 Meteorological parameters in Bogotá. Annual average values (a, c, and e), and monthly average values for 2012 and previous years (b, d, and f).
Figure 2a, b shows the mean temperature in the period 1998-2011 and the average temperature in 2012 (year of exposure). The average temperature was almost constant during the last years, which is observed in the annual temperature value in Figure 2a. The recorded values of mean temperature ranged from 12 ºC to 15 ºC, being March, April, May, October and November the months with highest values (Fig. 2b ). A slight increase in temperature is recorded during the last quarter of the year. Temperature is distributed over the year in a slightly bimodal manner, associated with the precipitation regime. In addition, temperature inversion is normally present from December to January due to winds of low intensity causing frost. Throughout 2012, the maximum absolute values of temperature exceeded slightly 25 ºC, especially in the months of January, February, March, April, October, November and December, and the absolute minimum recorded was 3.2 ºC in January (RMCAB, 2013).
Precipitation in Bogotá could range from 500 to 1000 mm yr-1, being highest in the eastern part of the city. Figure 2c shows the historical series of precipitation recorded from August 1997 up to 2012. A significant increase in the cumulative precipitation is observed, reaching greater values between late 2010 and early 2011, when Colombia suffered natural disasters resulting from high precipitation rates. Bogotá has less than 200 days of precipitation per year. January and February are the driest months and October and November the most humid (Fig. 2d). The behavior of precipitation throughout the year corresponds to a bimodal distribution, from March to May and October to November.
The registered annual and monthly average RHs between 2006 and 2012 are shown in Figures 2e, f, respectively. The average RH slightly decreases during the last years (Fig. 2e). The RH mean values recorded range between 65 and 80%. The higher value registered in 2011 is associated with the increase of precipitation during that year. March, April, May, October, November and December have the highest RH, which corresponds to the months of the year with highest precipitation.
3.2 Pollution
The air consists of several chemical components such as N2, O2, H2O, CO2, Ar, Ne, He, H2, and CH4, but anthropogenic activities affect such basic composition. Burning fossil fuels and industrialization are factors that have influenced air composition due to the generation of pollutants such as volatile organic compounds (VOC), NOX, SO2, CO, and PM.
Bogotá city is among the most polluted metropolis in Latin America, after Mexico City and Santiago. Nevertheless, Bogotá does not suffer the rigorous consequences of this fact, due to its topographical distribution and meteorological variables that produce pollutants dispersion. The most critical air pollutant in the city is PM10. Studies report that mobile sources contribute very significantly to the emissions of this pollutant (Behrentz, 2009); also, that the chemical composition of PM has an ion contribution where sulfates and nitrates are the anions species making the greatest contribution to the composition of PM10 in Bogotá. According to Figure 3a, a significant reduction of PM in recent years contrasts with its relevant increase from 2004 to 2007.

SO2 occurs mainly due to the use of fossil fuels with sulfur content such as coal, diesel or gasoline used in industries and automobiles. Industrial sources contribute about 60% of PM emissions and 70% of the SOx emissions into the atmosphere of Bogotá (Rojas, 2007). According to the local environmental authority, PM10 and SO2 concentrations decreased during the last years due to the control of permissible maximum levels in the industrial sector and mobile sources (such as public transportation systems). Figure 3a, b shows the effects of mandatory lower sulfur concentrations in fuel. These figures confirm the idea that the city is following the general trend of decreasing pollution in many capitals worldwide (Kucera, 2003).
3.3 Corrosion rate
Meteorological behavior at the test sites is shown in Figure 4. Figure 5 shows the corresponding pollutants deposition for the same period of time.


Temperature is homogeneous and almost constant within the urban area (close to 15 ºC), considering the topographic features (a plain area). The USME station, located south of the city within the periurban area, and at a higher elevation than the other sites, has the lowest value of average temperature. This station in turn shows the highest value of RH. Average RH values are usually higher than 60% in all sites, with higher values in the stations located south and north of the city.
The average deposition rate of SO2 is less than 10 mg m-2 day-1, which is in accordance with the atmospheric concentrations shown above. It was found that Autopista-Sur and Fontibón stations, located in semi-industrial areas, showed the highest values of the SO2 deposition rate due to industrial activities and high vehicle traffic. In accordance with the SO2 trend, PM deposition data are homogeneous and the stations located in the west part of the city show higher values (mainly the Autopista-Sur station).
The corrosion rates of carbon steel in the exposure sites are shown in Figure 6. The corrosion rate was in very good agreement with the behavior of pollutants, mainly with the SO2 level; however, the magnitude of rcorr is not strictly proportional to that of the SO2 deposition. The corrosion rate was almost constant in the test sites having low SO2 and PM depositions, suggesting that carbon steel does not produce a protective corrosion layer in these sites. Candelaria and USME generally show corrosion rate values below 10 µm yr-1, closely associated to the low level of pollutants. Nevertheless, the USME station shows a greater value than the Candelaria station, associated with higher RH. The corrosion rate throughout the exposure time only decreases clearly at Autopista-Sur, which has the greatest pollution levels and average RH below 70%. A similar behavior for the corrosion rate was obtained in Restrepo, which has an equal value of RH but less pollutant deposition rates. It may be considered that the highest SO2 deposition registered in this study leads to the formation of a protective corrosion product on carbon steel surface due to a more compact and thicker layer, which has been reported by other researchers for low and medium contents of SO2 (Morcillo et al., 1998).

3.4 Dose-response function
Preliminary analyses were often made with the use of PM deposition data, which increased the goodness of fit or R 2; however, being strongly correlated to the SO2concentration and included in the equations, PM produced an underestimation of the true effect of SO2, which is why it was finally excluded from the statistical analysis. On the other hand, Eq. (3) gave a better estimation than Eq. (2) of the corrosion rates, including both best-fit and individual significance of the parameters.
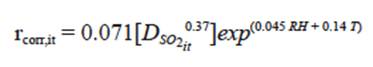
Accordingly, the annual dose-response function of carbon steel in Bogotá city, in agreement with the experimental data, is shown in Eq. (4):
 (4)
(4)
Eq. (4) allows for calculating the annual corrosion rate as a function of the main climatic variables. The coefficient of determination or prediction capacity value (R 2) is 0.67, indicating a proper goodness of fit, and the model is globally significant because the value of the statistic F(4.27) = 6.81; that is, the corrosion rate of carbon steel is adequately explained by the change in the explanatory variables (RH, T, SO 2).
All climatological parameters have a positive relationship with the metal corrosion rate according to this equation. The function proves possible nonlinear effects of independent variables on atmospheric corrosion (primarily SO2, RH and T).
4. Conclusions
An average atmospheric corrosivity value on plain carbon steel could be ranged between 5 µm y-1 and 35 µm yr-1 in Bogotá. The highest values are generally associated with higher SO2 levels, associated with regions of higher anthropogenic activity.
Environments with higher level of pollutants (mainly SO2) and an average relative humidity below 70% have a greater tendency to form a protective corrosion layer after one year of exposure. This behavior is most evident in sites with medium SO2 content.
A dose-response function of RH, T and SO2 deposition, to determine the corrosion rate of plain carbon steel for the first year of exposure, has been derived. The obtained annual dose-response function provided a valid method to estimate the corrosion rate of carbon steel during the first year of exposure to the atmosphere of Bogotá.

