


 nueva página del texto (beta)
 Inglés (pdf)
 Artículo en XML
 Referencias del artículo
 Enviar artículo por email
 Citado por SciELO
  Similares en
SciELO
Similares en
SciELO 
 Permalink
1. Introduction
In severe weather forecasting, one of the most important steps is to identify existing convection and its evolution. Some features of convective clouds, such as rainfall initiation, are difficult to predict because of highly nonlinear dynamic processes occurring during short time scales over which convection evolves (Mecikalski and Bedka, 2006). Regarding the formation and evolution of deep convective storms, moisture and instability are the main keys followed by a lifting process that is connected to low-level convergence. The definition of conditional instability can be found in Emanuel (1994) or Glickmann (2000). Any tool used to evaluate deep moist convection must have these three key parameters present.
Although the contribution of radar systems to meteorology is clear, their efficiency and usage decrease with increasing range. In countries lacking satisfactory radar coverage or without a unified network (e.g., Brazil), other observations tools, among which satellites are the most important, remain to be the main data source to perform weather analysis. Satellite imagery allows extraction of valuable information of the atmosphere across a wide area and over short time intervals, and an automated analysis algorithm can more accurately identify deep convective storms of potential hazard.
As discussed by Doswell (1987), the problem of forecasting convection -in the context of large-scale processes- is in part due to the association between large-scale systems and mesoscale deep moist convection. A forecaster must be able to diagnose the structure of the troposphere and to forecast changes resulting from thermal and moisture advection, along with vertical motion fields
(Johns and Doswell, 1992). Satellite data is the only operationally available dataset that provides an indirect measure of stability and moisture with high spatial resolution over a large domain (Roberts and Rutledge, 2003).
Multispectral satellite analysis has demonstrated an important role in increasing understanding of convective storm-top properties. Different infrared (IR) bands, and combinations between them, have been used to evaluate cloud phase, storm-top height and other features such as cold-U/V shape (Heymsfield and Blackmer, 1988; Schmetz et al., 1997; Setvak et al., 2010). Estimations of instability and moisture along with other deep convective storm characteristics are some of the features that can be assumed with different techniques applied to the whole Meteosat Second Generation (MSG) Spinning Enhanced Visible and Infrared Imager (SEVIRI) water vapor (WV) and IR spectral bands.
Once the storm initiates, tracking and monitoring its features within the initial hours is crucial to minimize the related damage via increasing warning lead times. The problem is that traditional satellite instruments only observe the uppermost cloud tops, revealing no information about the internal structure of the storm (Setvak et al., 2008). Taking full advantage of the high temporal sampling of MSG and its wide gamma of spectral channels, particularly the three channels 6.2, 7.3, 10.8 μm, may be viewed as a measure of convective activity.
This work had the objective to evaluate the usage of different techniques and variations to diagnose deep moist convection (such as mesoscale convective systems [MCSs]) formation and evolution over the southern South America region. An objective methodology, using different techniques arranged in a multi-layered approach to better evaluate areas of singular convection intensities, estimated instability and indirectly evaluated updrafts. This methodology is based in an MSG multi-channel approach in order to stratify cloud shield and highlight regions of different convective characteristics in a way that a single imager reveals a wealth of information. To perform this task, this methodology is derived from differences of satellite channels, temperature trends, and available very short range forecast models, using different parameters. Combining the parameters used to diagnose different convective patterns, it is proposed that an index can help forecasters to map and analyze short range variations in a convective cloud cluster (e.g., MCS).
2. Data and methods
In order to better understand deep moist convection, some techniques of analysis have been used to identify or estimate different patterns in satellite images, such as initiation, cloud top glaciation, cold-U/V shape, and overshooting tops (Petersen et al., 1984; Guang and McFarlane, 1991; Morel and Senesi, 2002; Roberts and Rutledge, 2003; Setvak et al., 2003; Holloway and Neelin, 2007; Zinner et al., 2008; Bedka et al., 2010; Coning et al., 2010; Bedka, 2011; Mahovic and Mikus, 2011; Matthee and Mecikalski, 2013). Simple techniques, such as a nearest neighbor average or time trends, can show important information that highlight subtle features of severe weather.
2.1 Meteosat second generation (MSG) satellite data
This study has the MSG-10 satellite as its main source of data, and uses different techniques of analysis applied to MSG IR 10.8 and WV 6.2 μm channels exploring the different ways that both channels interpret deep moist convection, especially in the high levels of the troposphere to the low levels of the stratosphere. MSG data is provided by the Laboratorio de Análise e Processamento de Imagens de Satélites (Laboratory of Analysis and Processing of Satellite Images, LAPIS) (http://www.lapismet.com).
The MSG-10 is equipped with a high-resolution imaging radiometer in the visible and infrared channels (the SEVIRI), consisting of 11 channels with a spatial resolution of 3 km and one channel of 1 km spatial resolution, and a temporal resolution of 15 min. The MSG-10 coverage area can be seen in Figure 1. Each SEVIRI band highlights a particular microphysical characteristic of the deep moist convection. The SEVIRI visible bands (0.6 and 0.8 μm) are capable of estimating optical thickness, amount of cloud water and ice, while the near infrared band (1.6 μm) observes the cloud-top temperature, particle size, shape, and phase. SEVERI WV channels (6.2 and 7.3 μm) can estimate cloud-top temperature and contents of water vapor in two distinct layers of the atmosphere. IR channels (3.9, 8.7, 9.7, 10.8 and 12 μm) can give a good estimation of cloud-top temperature during day and night, essential for cloud system-recognition. SEVERI is also equipped with ahigh-resolution (1 km) visible channel (HRV) that provides cloud and land surface imagery in great detail. The thermodynamic environment favorable for intense convection is usually created via synoptic-scale and sub-synoptic-scale processes, which may be diagnosed using WV imagery. This channel can also provide information about the amount of water in the upper levels of the troposphere, and sometimes is better than IR or visible (VIS) imagery to detect deep moist convection. The IR channel can measure cloud-top temperature and obtain information to estimate cloud-top height.

2.2 Numerical model data
A comparison between satellite cloud-top temperature and tropopause temperature is an important step in the algorithm that will be fully described later in this paper. This algorithm is intended to be used operationally throughout the MSG-10 coverage area. For better results, a numerical model of high performance and with good spatial and temporal resolution is needed. The Global Forecast System (GFS) model (https://www.ncdc.noaa.gov/data-access/model-data/model-datasets/global-forcast-system-gfs) has global coverage with 0.5° horizontal resolution, equally spaced in longitude/latitude with a 3-h forecast interval integrated out to 180-h, cycled 4X/day. Changes are regularly made to the GFS model to improve its performance and forecast accuracy. Additionally, gridded data are freely available for download. For these purposes, tropopause information is provided by the GFS model and is used with the nearest time period in reference to the satellite image.
To investigate the performance of the proposed algorithm in highlighting the intensity of large deep convective storms, it was put to test through many MCS case-studies. To understand the environment where the selected MCSs cases developed, select model variables were analyzed: total column water vapor, U and V components of the total wind, specific humidity and pressure reduced to mean sea level.
2.3 Observational data
For validation purposes, a lightning dataset from the Vaisala Global Lightning Dataset GLD 360, and weather radar PPI images obtained with a 0.5° elevation angle were used. Radar data were collected by two different radar systems owned by the Sistema Meteorológico do Paraná (Paraná Meteorological System, SIMEPAR) (http://www.simepar.br) and installed in the Paraná state in southern Brazil.
2.4 McIDAS-V/ Python
All data used in this work were integrated using the McIDAS-V software (https://www.ssec.wisc.edu/mcidas/) or in a pure Python environment using the Geospatial Data Abstraction Library (GDAL, available online at http://www.gdal.org/). Both software packages are capable of handling MSG-10 raw data without a pre-processing step. This approach is aimed to get the more accurate applicability depending on the purpose. The McIDAS-V routine can be use to manipulate real time data and can also store the product's final output in image format (PNG, JPEG, or GIF), while the Python algorithm provides gridded data in the form of a net CDF file as a result.
McIDAS-V is the fifth generation of Man-computer Interactive Data Access System (McIDAS) software developed by the Space Science and Engineering Center (SSEC) of the University of Wisconsin-Madison. This software is open source and capable of displaying weather satellite (including hyperspectral) and other geophysical data in two and three dimensions. It can also analyze and manipulate data with built-in mathematical functions and scripting. This ability allowed for algorithms that manipulated and combined different fields of satellite imagery and model forecasts, such as the temperature difference technique.
2.5 Algorithm description and background
The tools presented above have the objective of analyzing a deep convection storm with great detail. The IR 10.8 μm, WV 6.2 μm, and numerical weather prediction (NWP) fields are manipulated and combined into five parameters, divided into two levels, in order to better identify regions of deep convection. These parameters can be analyzed distinctively, highlighted or combined into an index that is used to classify the storms. A scheme of the approach is presented in Figure 2 with each step being represented by a colorful box: data ingestion (green), primary parameters (blue), and secondary parameters (red).
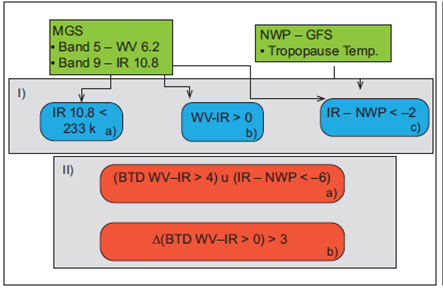
Fig. 2 Stratification approach algorithm scheme. Color boxes representing each step: data ingestion (green), pri mary parameters (blue), and secondary parameters (red). Gray box I represents all the primary parameters: (a) IR 10.8 μm temperatures colder than 233 K; (b) WV 0.62 μm, and IR 10.8 μm BTD positive values; (c) IR 10.8 μm at least 2 K colder than tropopause temperature information. Gray box II represents all secondary parameters: (a) BTD WV - IR higher than 4 K simultaneously to pixels where IR is at least 6 K colder than the tropopause temperature: (b) time step comparison showing BTD at least 3 K warmer.
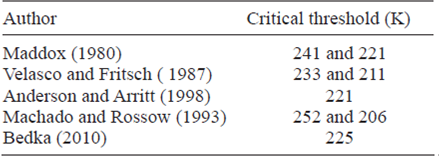
The first task was to choose a threshold in which a pixel starts to be characterized as critical. Table I reveals the different brightness temperature thresholds that have been used as critical thresholds in other studies related to deep moist convection, or convective features. There is no consensus on which temperature threshold should be used in these large severe storms studies. Although this divergence exists, satellite data suggest that highly super cooled water frequently occurs below the 243 K threshold, which indicates strong convective updrafts are present and are consistent with vigorous continental convective storms. High-altitude measurements, using an aircraft equipped with cloud-microphysics instrumentation showed supercoiled liquid water at temperatures approaching 233 K (Rosenfeld and Woodley, 2000). This indicates that to detect a highly-developed cloud top with only ice crystals, 233 K is a safe threshold. Since the objective of the present work is to detect very severe cases, a threshold of 233 K is chosen in the algorithm as a lower limit (Fig. 2-Ia). Therefore, pixels with IR 10.8 inn channel temperatures warmer than 233 K are excluded while colder temperature pixels are set as the first parameter.
The next step is based on another technique of deep moist convection detection. The brightness temperature difference (BTD) between the WV and IR channels (WV 6.2 μm - IR 10.8 μm) is supported by the fact that as the top of a vertically developed cloud approaches the tropopause, it blocks radiation from the troposphere that attempts to escape into space. The radiation at the top of the atmosphere can be considered as the radiation from the cloud top and from the stratosphere. One of the main characteristics of the stratosphere is the positive variation of temperature with height. This is more pronounced in the WV than in the IR channel because of the larger strength of the absorption bands. The actual difference between the brightness temperatures depends on the actual height of the cloud top and on the amount of stratospheric WV (Schmetz et al., 1997). Positive values of this difference are considered as deep moist convection (Setvak et al., 2007). This temperature difference can be higher by as much as 6-8 K. Setvak et al. (2007) used 1 km MODIS data and determined WV - IRW BTD in the range of 4 to 7 K as a good indicator of overshooting above the coldest cloud tops. Since the methodology described in this work does not aim to detect overshooting tops, but instead delimits regions of deep moist convection, positive WV - IR BTD pixels are kept as the secondary parameter (Fig. 2-Ib).
In one of the basic processes of convection, an air parcel reaches its equilibrium level (EL) when the temperature of the parcel is equal to the air temperature around it. In cases of deep moist convection, this level can be near the tropopause. The surrounding anvil cloud has been shown to have temperatures at or near that of the tropopause level (Adler et al., 1985). From the EL, if the parcel continues to ascend, temperatures will be colder than the ambient temperatures, resulting in the coldest temperatures of a cloud. With strong updrafts, the top of a cloud can reach or even exceed the tropopause. As the third parameter, a new comparison of temperatures is made based on the IR-texture technique proposed by Bedka et al. (2010). This technique compares the temperatures of the IR 10.8 μm channel pixels with tropopause temperature outputs from numerical weather prediction data (IR - NWP). In their work, Bedka et al. (2010) included NWP tropopause temperature information to ensure that a given pixel is indeed "overshooting" the tropopause. For the approach described here, only pixels with IR temperature at least 2° K colder than the tropopause temperature are kept (Fig. II-Ic). It is important to note that this NWP field was remapped to the resolution and projection of the corresponding satellite imagery so that a tropopause temperature is associated with every satellite pixel. Although there are some concerns about the information of the physical processes provided by this temperature difference, it can give a satisfying estimative of the presence of deep moist convection.
The first three steps are considered as the main parameters. The other two secondary level parameters, based on temperature trends and critical values, are added to give more information on a single image. The first parameter of the second level is the delimitation of pixels that show high convective activity estimated by both BTD WV - IR and IR - NWP techniques (Fig. 2-IIa). This step highlights areas that present pixels with positive values of the BTD WV - IR higher than 4 K simultaneously with pixels where IR is at least 6 K colder than the tropopause temperature. These thresholds were chosen because, as stated earlier, differences of WV - IR higher than 4 K can be a good indicator of an overshooting top, and because IR tops 6 K colder than the tropopause would imply a difference of height between ~0.6 to ~0.9 km, once its temperature decreases near the moist adiabatic lapse rate of 6.5 K/km. The last parameter of the approach is a comparison between the WV - IR of the earliest image and that of the previous one (Fig. 2-IIb). This time step comparison marks pixels that already had positive values of WV - IR, and in the newest image the BTD is at least 3 K warmer, which would indicate a noticeable change in only 15 minutes.
2.6 Test phase (satellite observations and analysis of 24 severe storms)
The present diagnostic tool was tested in events of MCSs. These storms are one of the largest and most intense systems occurring in South America. According to Velasco and Fritsch (1987), Laing and Fritsch (1997), Machado (1997), Tsakraklides and Evans (2002), Brooks et al. (2003), Salio and Nicoline (2006), Zipster et al. (2006), and others, the region between 20 and 40° S (Fig. 1) is a preferred site of formation of these MCSs. This region was then chosen as the area of interest, during the irst four months of the warm season, from September to December, between 2010 and 2014. The cases selected were according to the SCM definition, large areal coverage and the presence of cloud-top temperatures colder than 205 K in at least one life stage. Selected MCSs were analyzed in their stages of greatest variation: initiation, maximum intensity, and dissipation. The initiation stage spans from the period when the irst storms develop to the period in which the phenomenon could be primarily classiied as an MCS. The stage of maximum intensity is set around the period in which the storm has the largest area of pixels colder than 205 K estimated by the IR 10.8 iim channel. The stage of dissipation is defined as the period in which the storm intensity decreases until it can no longer be classified as an MCS.
3. Analysis and results
3.1 Brief case description
A total of 24 MCSs cases were analyzed. All cases presented life cycles with signiicant differences in the total period of activity. On average, the total time of duration was 24 h. It is important to note that, in this study, the life cycle was considered as the time between the irst storms appearance until total dissipation. According to size and shape, once storms reached the minimum criterion of intensity, they were divided into two subcategories: mesoscale convective complexes (MCC), with a nearly circular shape appearance on satellite imagery, and persistent elongated convective systems (PECS), that presented a more elongated cloud shield. On average, the primary location of storm development was in northern Argentina, and dissipation occurred in southern Brazil. During the storm initiation stage, major differences were noted in the ambient environment, especially in the mean sea-level pressure field and jet stream location. Figure 3 illustrates a comparison of the state of the atmosphere between 2 cases, October 14, 2010 and November 28, 2010. Both cases initiated in northern Argentina and displayed major differences between a weaker and a stronger case observed in the case selection series. A well-defined low pressure center was present in both stronger and weaker cases, located near the border between Argentina, Paraguay and Bolivia (Fig. 3). In the more severe case, a high pressure center was observed south of South America increasing the pressure gradient, and the induced flow contributed to convergence at low levels near the storm formation point, which was at the border between the two pressure systems. Also, the specific humidity field shows a moist atmosphere near the location of storm formation, with magnitudes around 16 g km-1. Other well observed differences included the position and establishment of a subtropical high level jet (SHLJ). In stronger cases, a strong and well established high level jet stream was present while weaker cases displayed a weaker jet stream.

3.2 Output visualization
The algorithm output image is a result of five different parameter combinations (Fig. 4). Each parameter is an increasingly stringent criterion of convection intensity. The irst parameter is enhanced using a gray shade color bar. These pixels are consistent with deep convection without losing the cloud shield shape information. Blue to green shades represent positive BTD WV - IR values, and aims to evaluate the intrusion of moisture in the upper layers during the occurrence of severe convection. IR - NWP temperature differences colder than -2 K are highlighted with yellow to orange shades, being able to estimate regions with strong updrafts and implicitly suggesting an idea of height reached by the top of the cloud, since it presents colder temperatures compared to the tropopause. Inside a black contour, a pixel is presented which shows a positive variation greater than 3 K in regions where the BTD WV - IR was already positive in the previous image, consistent with a rapidly intensifying convective activity. Surrounded by a purple line is the region of greatest convective activity by both WV - IR and IR - NWP techniques.
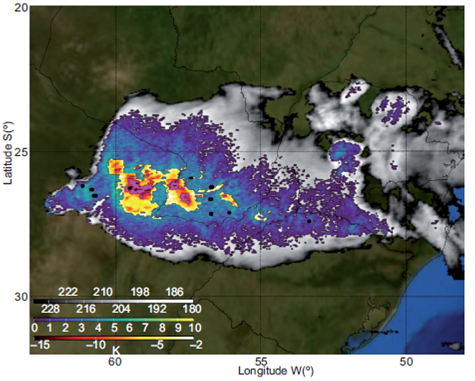
This arrange of parameters allows the analysis of a cloud shield by layers, providing more information in a single image. This algorithm can be exploited to monitor small regions that present high convective activity throughout the lifetime of the phenomenon, giving better results compared with more common techniques (e.g., IR false colors).
3.3 Stratification analysis algorithm applied to SCM cases
In general, all the parameters in the proposed approach were representative according to their objectives. In all of the storms analyzed, in addition to temperatures < 233 K for the 10.8 μm channel, positive WVz - IR differences were reported. As expected, more intense cases showed higher values. The comparison of the IR - NWP parameter was observed in all cases, except one, and had large variability in areal coverage from case to case. Time-step analyses of positive values of WV - IR were present mainly in the stages of initiation and maximum intensity. This behavior made the absence of this parameter to be the first estimation of lose of intensity. The parameter for stronger convective activity evaluated by both the WV - IR and IR - NWP techniques, presented large variability in occurrence and area. This routine analysis was very useful as a diagnostic and prognostic tool for the following few hours of the MCS. Figure 5 illustrates the stratification analysis applied in cases of varying intensities. More intense cases developed from fast growing and stronger updraft cores, resulting in rapid appearances of all parameters. In less severe cases, each parameter evolved slower and sometimes with the absence of some parameters.
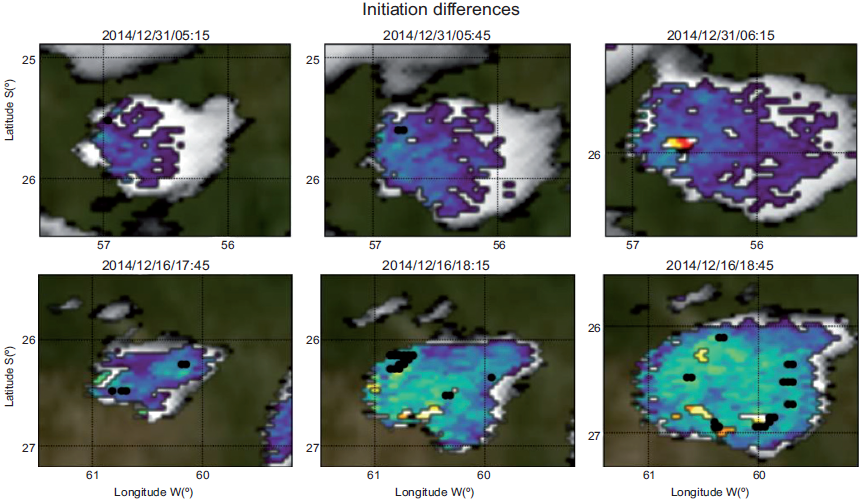
Fig. 5 Feature differences in the approaches between a less severe case (December 31, 2014) and a stronger one (December 16, 2014). Colors in these plots are the same as in Figure 4.
The configuration images of different parameters help to identify the stages visually, not requiring further analysis such as pixel count of certain temperature thresholds. During the stage of maximum convection activity, the size and value of each parameter proved to be good indicators of differences in intensity from one case to another. The combined analyses of WV - IR and IR - NWP showed notable differences in size between extreme and less severe cases. Figure 6 shows the difference in the visualization of a maximum intensity stage occurring in December 17, 2014, by the stratification approach algorithm and the IR false color technique.
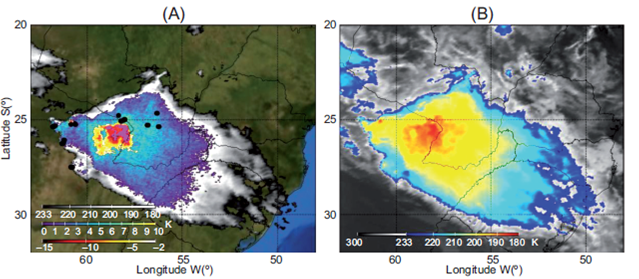
Fig. 6 Maximum intensity stage estimated by both the stratification approach (a) and the IR 10.8 μm channel (b).
The evolution of the dissipation stage is very clear when analyzed using the proposed approach. Parameters that estimate higher intensity begin to fade and the cloud shield displays only the first parameter or dissipates completely. The dissipation stage observed by the stratification algorithm is depicted in Fig. 7.
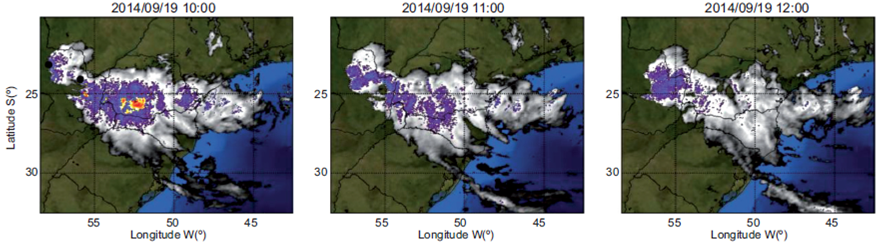
Fig. 7 The dissipation stage analyzed by the stratification algorithm. Colors in these plots are the same as in Figure 4.
3.4 Validation with radar and lightning data
The region of interest in this study coincided with the Meteosat high viewing angle scan area, which may produce some uncertain conclusions, especially when comparing locations with local radar data. However, radar data was only used to evaluate storm evolution. Most convective activity periods estimated by the stratification approach algorithm were well correlated with larger magnitudes of reflectivity. Figure 8 displays a comparison between radar and satellite data, with both images having the same vantage point. The reflectivity is consistent with pixels with positive WV - IR, and the largest radar reflectivity is seen in areas near pixels with IR temperatures of at least 2 K colder than the tropopause temperature. This image suggests that precipitation can be more precisely estimated by satellite using the WV - IR technique, with the stronger cores of precipitation highlighted by the IR - NWP parameter.
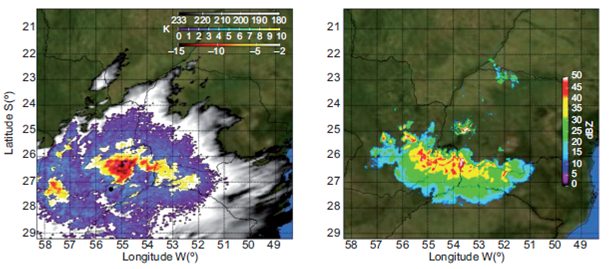
Fig. 8 Satellite imagery (left) and radar reflectivity (dBZ, right) for September 18, 2014 at 13:00 UTC.
A good relationship with lightning data was also observed. Figure 9 depicts a comparison with all lightning strikes and the three primary parameters of the described approach for three different life stages of an MCS case: mature (a), most intense (b), and dissipation (c).
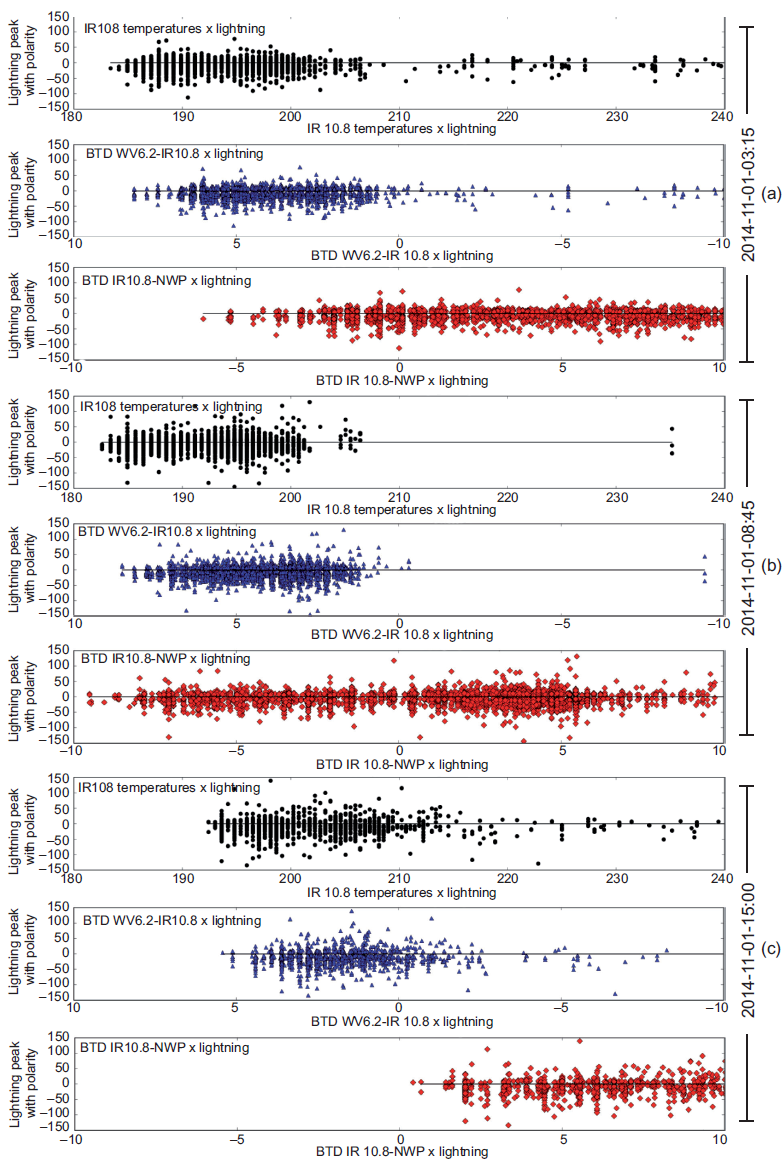
Fig. 9 Lightning strike scattering to IR, IR - WVD BTD, and IR - NWP for an MCS case in different life stages: mature (a), most intense (b), and dissipation (c).
In all stages, lighting strokes occur more within WV - IR positive values and lower IR temperature areas, not necessarily because of stronger convection, but also because it usually covers a larger area than negative IR - NWP. During the storm evolution, IR - NWP negative areas increased, which was also noted by the shift of lightning strikes to areas where this difference was more negative.
3.5 Meteosat WV - IR technique in southern South America
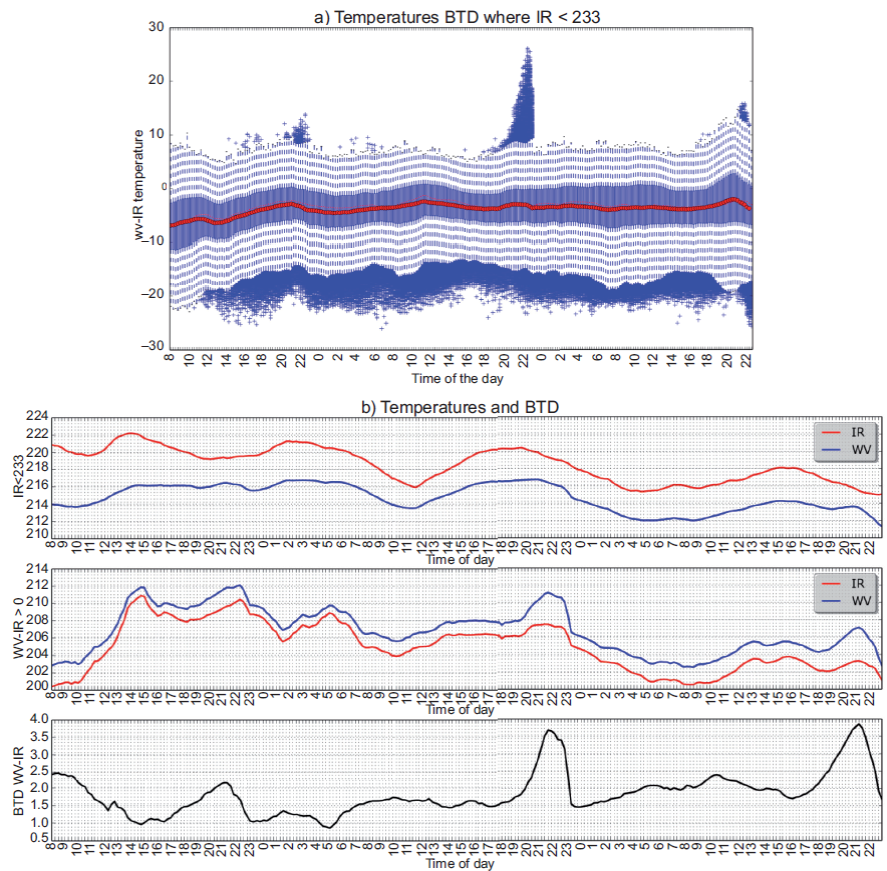
It is known that different viewing angles can affect the way satellite channels observe the atmosphere (Al-Wassai and Kalyankar, 2013), and as a result a full analysis for the region of interest was conducted. WV 6.2 μm - IR 10.8 μm derived from SEVERI channels, in the region of interest of this paper, showed a peculiar behavior at sunset, during which this difference showed inconsistent maximum values. Figure 10a is a representation of WV - IR distribution during an MCS event. During this period (18:00 and 23:00 UTC), positive values of WV - IR BTD showed a notable increase. Maximum values tended to be much greater than in other time frames, while negative values did not show great difference. The separate analysis of IR and WV temperatures revealed that WV channel has the major influence in this pattern. Figure 10b represents a comparison between values of IR and WV in pixels where IR is less than 233 K and where WV - IR positive pixels occurred during the evolution of a storm. In the lapse where BTD had maximum values, the storms did not show great increases in convective activity. This indicates that high BTD values occurred during this interval likely due to some bias in the satellite temperature retrieval. It is possible that this behavior may be present because of a satellite high viewing angle combined with a low solar elevation angle. More research must be conducted to better understand why this happens and the influence of the sun elevation angle during this period for each channel in high clouds.
3.6 Parameter combination and intensity index
To determine the most intense case and to understand how the three primary parameters of the stratification approach correlated with each other, a scatter analysis between them was performed. They were in good agreement in terms of delineating areas of deep convection. Figure 11 shows the correlation between IR, BTD WV - IR and IR - NWP. This figure includes a graphic (11c) where the vertical axis represents WV - IR and the horizontal axis IR 10.8 μm temperature. Pixels that have IR - NWP values lower than 2 K are also represented in the figure (11a, b and c) by magenta areas. Positive values of BTD WV - IR are well correlated with the colder IR temperatures and with negative values of IR - NWP. Depending on the case, one of these parameters (which vary between them) does not agree with the other two. Table II shows a comparison between values that represent the most convective activity of each parameter for the 12 MCS cases in their most intense phase.
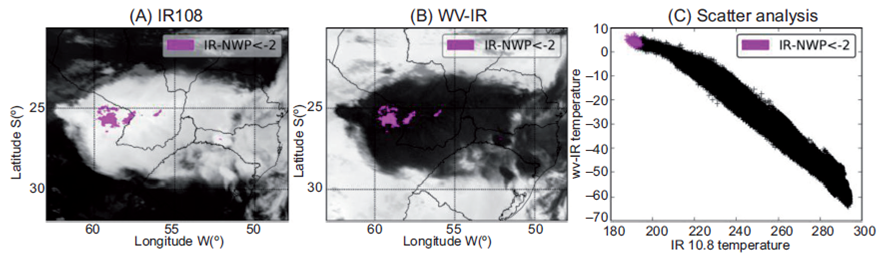
Fig.11. Comparison between IR108 (a), WV - IR (b), and scatter analysis (c) between IR108 and WV - IR. Magenta areas represent pixels with IR - NWP values lower than -2.
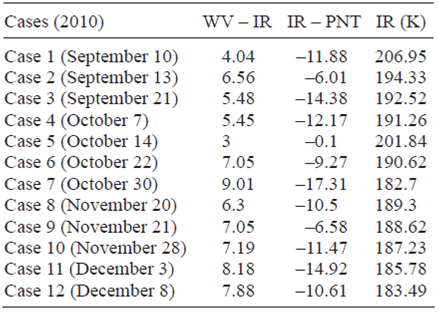
As an example, comparing the values for each parameter between cases 5 and 1, both temperature difference techniques agree that case 1 was more intense, but minima from IR 10.8 μm channel showed otherwise. A similar result is observed when comparing case 4 and case 8, but here the parameter that is not in consensus is the temperature difference IR - NWP. The comparison of the three parameters is more eficient than just analyzing the intensity of a storm by one parameter. This indicates that the analyses of the storms and the comparison between them would be better performed by a temperature index that indicates the intensity of the storm taking into account the three parameters. With that in mind, a simple function called "intensity" that combines the three parameters to indicate the most intense system was used. Table III shows the results of applying the intensity index to the values in Table II.

The results in Table III show that applying the intensity function results in a single minimum temperature value and it makes possible to easily discriminate storms by intensity unambiguously. The intensity function can be directly applied into satellite images in two different ways: limited to values that indicate deep moist convection (IR temperatures < 233 K, WV - IR > 0 and IR - NWP < -2), or without such limitation. Both ways are depicted in Fig. 12. These functions can also be used as an index to identify or classify deep moist convection by thresholds.
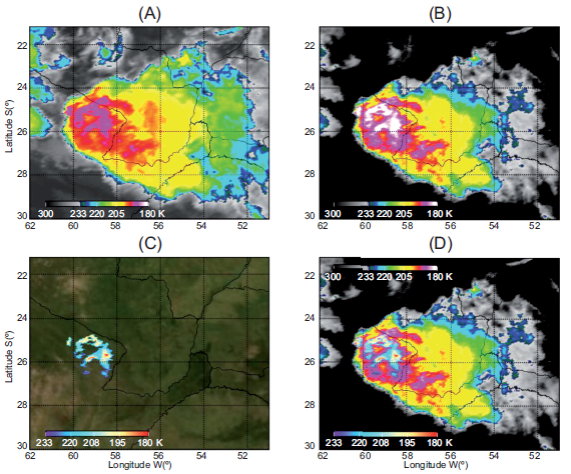
Fig. 12 Comparison between satellite images of storms occurring on De cember 17, 2014 at 06:30 UTC. (a) IR 10.8 μm; (b) image resulting from the application of the intensity function without delimitation; (b) image showing only temperatures that represent deep convection; (d) fusion between images b and c.
The use of the intensity function from satellite imagery can discriminate clouds with small vertical development, and highlight regions of large convective activity in a more efficient way when compared to the IR 10.8 μm imagery. Applying to limited values, the result image is a region where only such values are present, estimating the maximum convective activity of a storm. Both ways can be used together by splitting the convective region from the region of weaker convective activity and highlighting them with two individual color scales.
4. Discussion and conclusions
This study proposes a satellite diagnostic tool for deep moist convection, which aims to stratify a cloud shield into areas of strong convective activity, displaying more information in a single image. This approach uses BTDs along with comparisons with numerical models and temperature trends. This satellite methodology was developed in focus with three fundamental keys to deep convective storm initiation and evolution. The tool presented here has the ability to differentiate areas of isolated stronger convective elements from a larger storm complex such as an MCS. This methodology is arranged in a multi-layers approach that better evaluates areas of different convective intensities.
The stratification approach algorithm output proved to be more precise in indicating the phase of convection and severity of a storm cloud shield, distinguishing areas of different convective characteristics and delimiting areas that show temperature trends coinciding with increases in convection intensity. This gives a better understanding of the system phase and severity. Areas highlighted by this tool were well related to precipitation areas measured by the nearest radar, and also, highest dBZ threshold areas were in agreement with well-developed convection evaluated by the proposed tool. Other deep moist convection indicatives, such as lightning strike evolution have shown an evident relationship with the three main methodology parameters throughout the system's life stages.
This methodology presents a great capability to split an MCS into regions of extreme, modest, and weaker convective activity. Furthermore, each life cycle stage of the MCS showed different features characterized by the presence and behavior of the five parameters that contribute to this methodology. In the initiation stage, the approach was able to differentiate storms that became extremely intense since the appearance of the first convective elements. In such storms all parameters highlighted by the tool were present. Precipitation observed by radar was consistent with positive WV - IR areas and with maxima IR - NWP areas highlighted by the stratification tool. Increases in convective activity are also well related to the evolution of IR - NWP as the lightning strikes tended to shift to areas with negative values of this difference within the evolution of the storm.
According to the characteristics of appearance of each parameter, it was possible to create a storm classification. Class 1 characterizes storms that presented only the first two parameters: a brightness temperature IR 10.8 channel colder than 233 K and positive differences of WV 6.2 - IR 10.8 μm. Thus, this class encompasses deep convective storms of lower intensity. Class 2 categorizes storms that presented both parameters described in class 1, yet display negative values of at least 2 K in the comparison IR - NWP. Class 3 encompasses storms that showed all of the parameters of the proposed methodology, which include the most intense storms.
Besides the great utility of this methodology, it must be pointed out that for the South American region, WV - IR BTDs showed inconsistent maxima during periods of low sun elevation angle (e.g., 18:0023:00 UTC), which seemed to only affect high clouds.
The approach described can be very advantageous for operational forecast centers in regions with a high frequency of MCSs. The use of this method can be quite satisfying when applied to large-scale systems that generate several storms with different intensities such as near the Intertropical and South Atlantic Convergence zones. Further studies will show new applications and advantages of this methodology.

