


 text new page (beta)
 English (pdf)
 Article in xml format
 Article references
 Send this article by e-mail
 Cited by SciELO
  Similars in
SciELO
Similars in
SciELO 
 Permalink
1. Introduction
Due to accelerated industrialization and urbanization, nearly half of the population in the world now lives in urban agglomerations. These intensive activities resulted in increasing quantities of contaminants into the urban environment. Consequently, a variety of environmental problems have cropped up and toxic metal pollution has become a major issue, especially in urban air, soils and road dust (Bilos et al., 2001; Madrid et al., 2002; Han et al., 2006). Road dust is a complex mixture of particles and may contain various components like organics, heavy metals, other inorganics, mould spores, animal dander, pollen, pollen fragments etc., which can possibly get resuspended due to movement of vehicles and wind, resulting in an important source of atmospheric air pollution. It was observed that the particles and associated metals, particularly with fine dust, remain suspended in air longer under certain meteorological conditions. Road dust, an important environmental indicator of metal contamination from atmospheric deposition, receives varying inputs of anthropogenic metals from various stationary and mobile sources such as vehicular traffic, industrial activities, power plants, residential fossil fuel burning, waste incineration, construction and demolition activities, and resuspension of contaminated soil (Bilos et al., 2001; Charlesworth et al., 2003; Bhanarkar et al., 2005, 2008; Gupta et al., 2012). Road dust, therefore, is a significant contributor of pollution in the urban environment. The adverse effects of poor environmental conditions on human health are most evident in urban environments, particularly in developing countries where urbanization, industrialization and rapid population growth are taking place on an unprecedented scale (Duzgoren-Aydin, 2007).
Toxic metals in urban areas are a subject of great concern, due to their non-biodegradable nature and long residence time. The prolonged presence of the contaminants in the urban environment, particularly in road dust, and their close proximity to the human population significantly increase the exposure of the urban population to metals via inhalation, ingestion, and dermal contact (Mielke et al., 1998; Abrahams, 2002). Metals can accumulate in fatty tissues, affecting the functions of organs and disrupting the nervous system or the endocrinal system (Waisberg et al., 2003; Duzgoren-Aydin, 2007) and some metals could cause mutagenic, teratogenic and carcinogenic effects in living beings (Lienesch et al., 2000; Cook et al., 2005).
Although several studies on metal pollution in road dust have been carried out in developed countries (de Miguel et al., 1997; Arslan, 2001; Rasmussen et al., 2001; Charlesworth et al., 2003; Sezgin et al.,2003; Tokalioglu and Karta, 2006; Shi et al., 2008; Amato et al., 2009), very little information is available on this topic in developing countries. Only few studies on quantification and distribution of metals in road dust have been conducted recently in Indian cities (Chatterjee and Banerjee, 1999; Banerjee, 2003; Rawat et al., 2009; Rajaram et al., 2014).
Considering the above, the main objectives of this study include: (1) determination of heavy metals concentration in road dust in various urban environments of Delhi, (2) identification of the possible sources of metals in road dust through statistical analysis and (3) assessment of the metal contamination in urban road dust by various methods.
2. Materials and methods
2.1 Study area
Delhi, the capital of India, is a major center of international and domestic activities in the Asian subcontinent. It is spread over a 1483 km2 area with a population of about 16.7 millions (GOI, 2011). Rapid urbanization and industrialization of the city resulted in growth of vehicular population in the city. There has been an exponential growth in vehicular fleet, which increased from 3.05 million in 1998-1999 to 6.3 million in 20082009, thereby registering an overall annual compound growth rate of 7.52%. Delhi has about 85 private cars per 1000 inhabitants (Government of NCT Delhi, 2010). The total distance traveled by all categories of vehicles in the city is estimated to be about 79.2 million km. Out ofthe above, two-wheelers and four-wheelers (car/van) account for a major share of 42.7% and 3 8% respectively. Three-wheelers and local buses account for about 11.8% and 3.6% of vehicular fleet in Delhi respectively, whereas the share of light commercial LCV) and heavy commercial vehicles (HCV) together account for about 3.2% (GOI, 2002). Besides the vehicular fleet, the city has five power plants and 33 industrial estates in which many medium-scale and small-scale industries that include chemical, pharmaceutical, automobile part manufacturing, and rubber and plastic manufacturing are present.
2.2 Sample collection and analysis
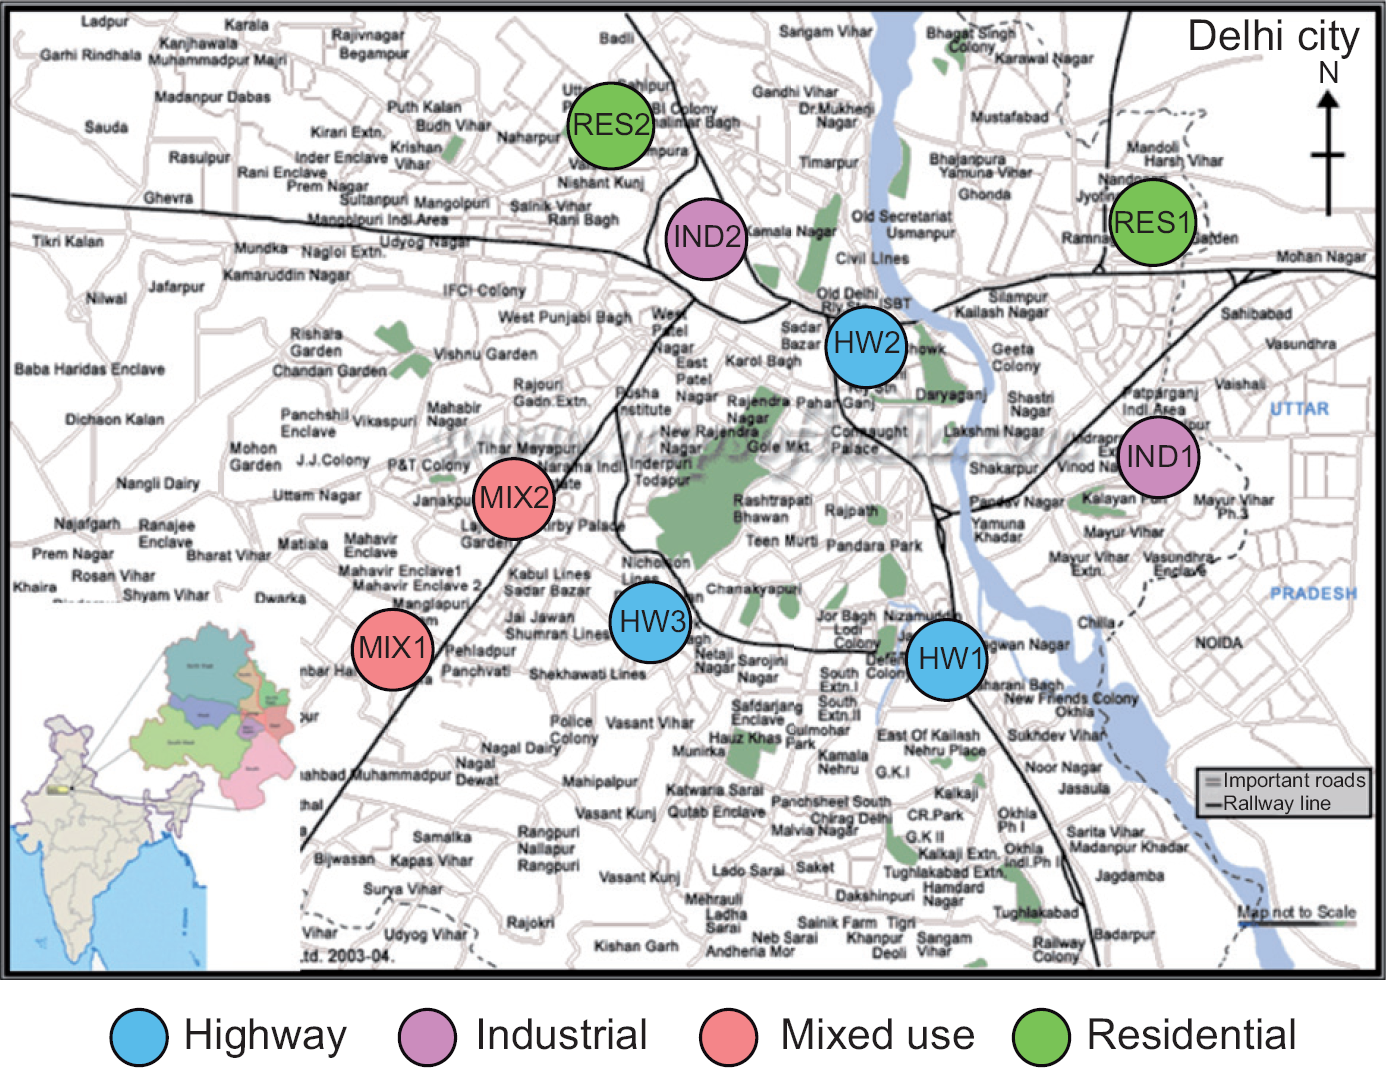
Road dust samples were collected in winter 2009 from nine locations with due consideration to different representative aspects of urban environment in the metropolis including industrial (IND), national highway (HW), residential (RES) and mixed use (MIX) areas (Fig. 1). Samples of road dust were collected by using a vacuum cleaner. A representative composite bulk sample for every sampling location was obtained by taking subsamples from three points of the road at each location and then mixing thoroughly. Description of sampling locations is presented in Rajaram et al. (2014).
All samples were dried in the oven at 110 oC for 48 h and sieved through 200 mesh sieve. The sieved dust samples were analyzed for metal content according to standard methods (US-EPA, 1999). Measurement of metal concentrations, i.e. Cd, Cr, Cu, Ni, Pb, and Zn was carried out using inductively coupled plasma atomic emission spectroscopy (ICP-AES) (Jobin Yvun, model JY24). Calibration standards were prepared through serial dilution of standard stock solution of multi-elements having concentrations of 1000 mg L-1 (Merck, Cat. No. 111355). Standard solutions were used to validate the analytical method. All extractions and analysis were made with replicate samples (n = 3) and the mean values were reported. The details of sampling and analysis methodology are presented in a previous study (Rajaram et al., 2014).
2.3 Statistical analysis
In this study, for the identification of the relationship between metals and their possible sources, Pearson's correlation coefficient analysis and principal components analysis (PCA) were performed using commercial statistics software package SPSS (version 17.0 for windows). The correlation coefficient measures the strength ofthe interrelationship between two metals.
PCA is the most common multivariate statistical method used in environmental studies to reduce the data while retaining important information and to extract a smaller number of independent factors (principal components, PCs) that can be easily interpreted for analyzing relationships among the observed variables (Massart et al., 1997; Malinowski, 2002; Loska and Wiechuya, 2003; Tokalioglu and Kartal, 2006). PCA starts with the correlation matrix describing the dispersion of the original variables and extracting the eigenvalues and eigenvectors (Lu et al., 2010). An eigenvector is a list of coefficients multiplying the original correlated variables to obtain new uncorrelat-ed PCs, which are weighted linear combinations of the original variables. A matrix property, eigenvalue, is used to standardize the number of PCs that can be extracted. Usually, all the PCs with eigenvalues greater than 1 are considered as extracted PCs (Loska and Wiechuya, 2003; Lu et al., 2010).
PCA extracts the PCs from an i,j matrix, where i corresponds to the number of samples and j to the number of pollutants measured (correlated variables, in this case all the heavy metal species measured) (Franco et al. , 2015). The PC extracted corresponds to pollutant (i.e., heavy metal) sources. The number of PCs that can be extracted from the measurements depends on the variability of the available data and on the number of monitored substances. The first PC extracted includes the highest possible variability, and each succeeding compound accounts for as much as possible of the remaining variability (Han et al., 2006). The number of PCs that can be extracted depends on the retained variance of each PC (Franco et al. , 2015).
In this study, for the purpose of this exercise, a data matrix consisting of nine sites and six metals was considered (Rajaram et al., 2014). PCA was performed by applying varimax rotation with Kaiser's normalization with eigenvalues > 1 to identify the sources of heavy metals in road dust. By extracting the eigenvalues and eigenvectors from the correlation matrix, the number of significant factors and the percent of variance explained by each of them were calculated. Data were checked for normality prior to PCA using Kolmogorov-Smirnova test and Sha-piro-Wilk test, which indicated that the normalized data were suitable for PCA.
2.4 Metal contamination assessment methods
In this study, contamination factor index (Cif), degree of contamination (Cdeg), potential ecological risk index (RI), pollution index (PI) and integrated pollution index (IPI) were calculated to assess the metal contamination levels in the road dust. The road dust metal concentrations described in Rajaram et al. (2014) were also utilized to estimate metal contamination assessment.
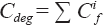
Hakanson (1980) suggested four classes of Cif and Cdeg, to evaluate the metal contamination levels. The degree of contamination (Cdeg) is the sum of contamination factors for all of the elements. The contamination factor Cif was defined as (Hakanson, 1980):
 1
1
where C i is the mean content of metal and C i n is the concentration of a reference value for individual metal. In this study, the C i n values represent the concentrations of the metals in the soil from a remote background area in India (Kuhad et al., 1989; Gowd et al., 2010).
The degree of contamination by the six heavy metals in road dust from the study areas was determined as follows (Hakanson, 1980):
 2
2
The classification for degrees of contamination suggested by Hakanson (1980) was based on eight pollutants, while there were only six heavy metals analyzed in this study. Thus, the original degree of contamination classification was adjusted according to Zhang et al. (2013). The modified classification is presented in Table I.
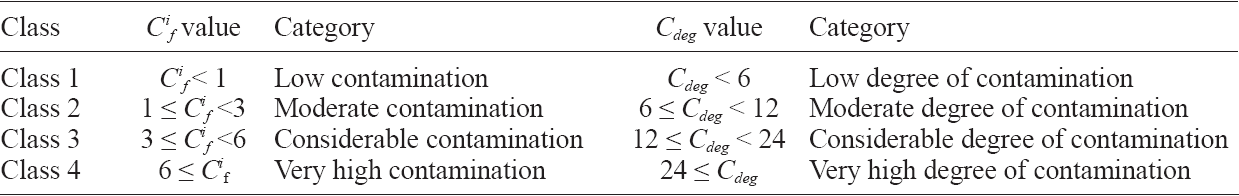
The assessment of degree ofheavy metal pollution was carried out using the RI, based on the toxicity of metals and the response of the environment, as proposed by Hakanson (1980) according to the following equations:
 3
3
 4
4
 5
5
where Ei r is the monomial potential ecological risk factor, Ti r is the metal toxic factor, f i is the metal pollution factor, C i is the concentration of metals in samples, and Ci n is a reference value for metals. The RI classification suggested by Hakanson (1980) was based on eight pollutants. In this study, a modified RI classification suggested by Zhang et al. (2013), was applied in order to evaluate the RI by the analyzed six heavy metals (Table II).
To assess the degree of metal contamination, a revised PI for each metal and an IPI of the six metals were estimated for each sampling site using the following equations as suggested by Huang (1987). PI was defined as follows and classified as presented in Table III:

 6
6
 7
7
 8
8
 9
9
where C is the measured concentration of specific metal, Xα is the threshold concentration of the metal enrichment, Xb is the threshold concentration of the low level of pollution and Xc is the threshold concentration of the high level of pollution. The values of Xα, Xb and Xc, were taken from Huang (1987) and Bai et al. (2009).
The IPI of all measured elements for each sample is defined below in Eq. (10) (Bai et al., 2009) as the sum of the difference between the individual element's PI and 1, and then classified (Bai et al.,2009) in Table III:
 10
10
3. Results and discussion
3.1 Heavy metal concentrations
Results on the concentrations of heavy metals in road dust samples collected from the study area and reported in Rajaram et al. (2014), were summarized and are presented in Fig. 2. The concentrations varied as follows: Cd, from 1.9 to 3.8; Cr, from 56.4 to 500.3; Cu, from 87.3 to 499.0; Ni, from 27.2 to 61.7; Pb, from 69.0 to 316.0, and Zn from 187.7 to 524.3 mg kg-1. The mean concentrations ± 95% confidence intervals of Cd, Cr, Cu, Ni, Pb and Zn in Delhi road dust were found to be 2.65 ± 0.5, 148.8 ± 83.3, 191.7 ± 104.4, 36.4 ± 6.6, 120.7 ± 47.9 and 284.5 ± 67.6 mg kg-1, respectively. Metal concentrations found in this study were comparable to those observed by Rajaram et al. (2014).
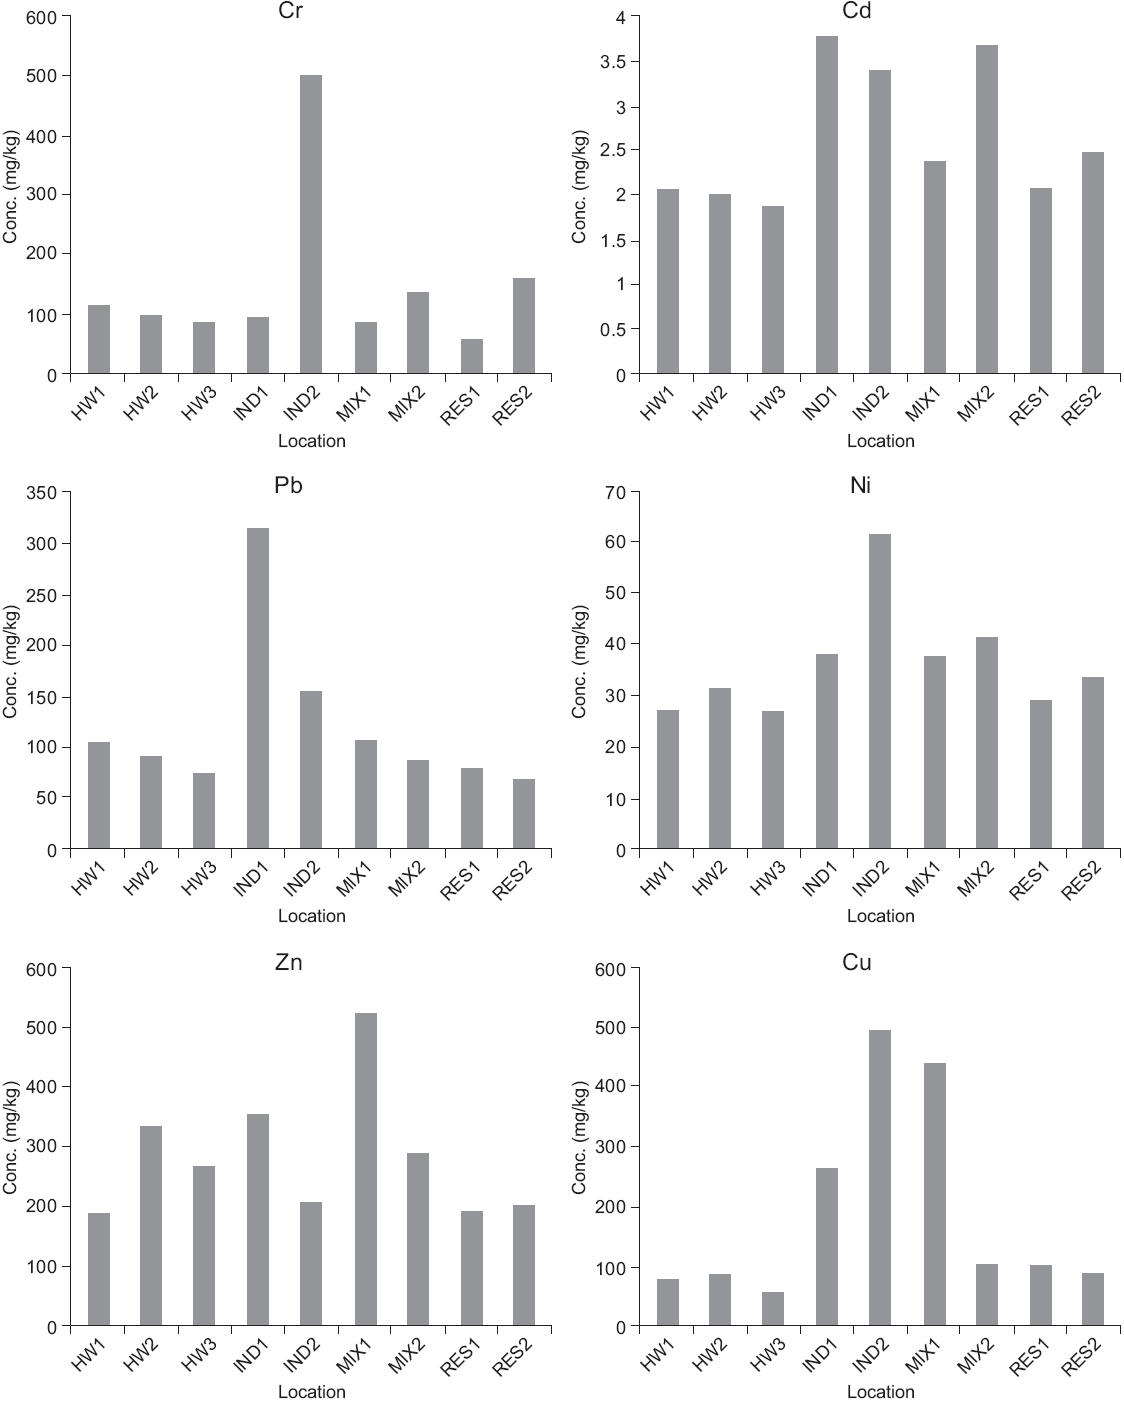
Fig. 2 Metal concentrations in road dust samples in Delhi. Concentration values of Cr, Pb, Ni, Zn and Cu for HW1, HW2, HW3, IND1, IND2, MIX2 and RES2 are taken from Rajaram et al. (2014).
Except Zn, mean metal concentrations in the industrial areas (Cd, Cr, Cu, Ni and Pb: 3.61, 299.5, 383.6, 49.9 and 236.5 mg kg-1, respectively) were relatively higher than those of other activity zones in Delhi (Rajaram et al., 2014). Industrial processes such as metallurgical, electroplating, chemical, and fuel combustion may be the main reasons for metal emissions in those industrial areas and high metal concentrations (Madrid et al., 2002; Wang and Qin, 2006; Li et al., 2008). The lowest concentrations of Cd, Cu and Ni were found to be 1.9, 58.3 and 27.2 mg kg-1 near the highway, respectively, whereas the lowest Cr and Pb levels were found to be 56.4 and 69.0 mg kg-1 in residential areas, respectively. The average highest Zn concentration of 407.3 mg kg-1 was found to be in mixed areas and lowest concentration of187.7 mg kg-1 near highways. The highest Zn concentration found in mixed areas was comparable to that observed by Rajaram et al. (2014). In general, lower metal concentrations were obtained in the samples near the highways as compared to those obtained near the roads in other areas (Rajaram et al., 2014). This may be due to the fact that the roads are always jammed with the high vehicular traffic in other areas resulting in heavy metal emission and metal pollution (Chen et al., 2010; Sun et al., 2010). The distribution have the highest metal concentration, followed by of metals in different functional areas was comparable to the one observed by Wong et al. (1996), who reported that within the urban areas, industrial areas have the highest metal concentration, followed by commercial and residential districts. Wang and Qin (2006) also found that Pb concentration varied in different functional areas in Shenyang in the order of industrial area > commercial area > residential area > suburb. Since the ban of Pb in gasoline, the content of this element in the troposphere has decreased (Wang et al., 2003). The Pb concentration in road dust could still be attributed to emissions from fossil fuels, historical Pb contamination and the long half-life of Pb in soils (Wang et al., 2003; Saint' Pierre et al., 2004). The above results indicate that industrial and traffic activities were the main sources of metal pollution in road dust of Delhi.
Since no guidelines on metals in road dust or soil have been prescribed by regulatory authorities in India, results of this study were compared with the maximum permissible limits prescribed by China (NEPA, 1995) and Canada (CCME, 2007) for metals in soil. As shown in Table IV, the mean concentrations of Pb and Ni were lower than the guideline values of China and Canada, whereas the mean concentrations of Cu and Zn were higher than the permissible limits prescribed by those countries (Rajaram et al., 2014). The mean concentration of Cd was lower than values recommended by Canadian guidelines, but higher than Chinese guidelines, whereas the mean concentration of Cr was higher than the permissible limit prescribed by Canada but lower than the guideline value of China.
Table IV Heavy metal concentrations (mg kg 1) in road dust in Delhi and various cities of the world.
| City | Cd | Cr | Cu | Ni | Pb | Zn | Size (μπι) | Reference |
| Delhi | 2.65 | 148.8 | 191.7 | 36.4 | 120.7 | 284.5 | < 75 | This study |
| Birmingham | 1.62 | 466.9 | 41.1 | 48 | 534 | < 63 | Charlesworth et al. (2003) | |
| Ottawa | 0.37 | 43.3 | 65.84 | 15.2 | 39.05 | 112.5 | 100-250 | Rasmussen et al. (2001) |
| Calcutta | 3.12 | 54 | 44 | 42 | 536 | 159 | < 600 | Chatterjee and Banerjee (1999) |
| Hong Kong | 3.77 | 173 | 181 | 1450 | < 2000 | Li et al. (2001) | ||
| Shanghai | 1.23 | 159.3 | 196.8 | 83.9 | 294.9 | 733.8 | < 125 | Shi et al. (2008) |
| Luanda | 26 | 42 | 10 | 351 | 317 | < 100 | Ferreira Baptista and de Miguel (2005) | |
| Oslo | 123 | 41 | 180 | 412 | < 100 | De Miguel et al. (1997) | ||
| Madrid | 61 | 188 | 44 | 1927 | 467 | < 100 | De Miguel et al. (1997) | |
| Dhaka | 104 | 46 | 26 | 74 | 154 | < 1000 | Ahmed and Ishiga (2006) | |
| Kuala Lumpur | 2.9 | 35.5 | 2466 | 344 | < 63 | Ramlan and Badri (1989) | ||
| Seoul | 3 | 101 | 245 | 296 | < 2000 | Chon et al. (1995) | ||
| Indian natural soil background | 0.9 | 114 | 56.5 | 27.7 | 13.1 | 22.1 | Kuhad et al. (1989); Gowd et al. (2010) | |
| China soil guidelinesa | 0.3 | 200 | 100 | 50 | 300 | 250 | NEPA (1995) | |
| Canada soilguidelinesb | 10 | 64 | 63 | 50 | 140 | 200 | CCME (2007) | |
| Canada soil guidelinesc | 22 | 87 | 91 | 50 | 600 | 360 | CCME (2007) |
aClass II. Metal levels in class II are threshold values established to protect agricultural production and maintain human health.
bResidential/parkland land use.
cIndustrial land use.
In comparison to documented studies, it was observed that the levels of heavy metals in the road dust of Delhi are comparable with those determined in other cities (Table IV) (Rajaram et al., 2014). In general, the concentration of Pb in Madrid and Kuala Lumpur, and Zn in Hong Kong were higher than the concentration recorded in Delhi road dust.
3.2 Correlation coefficient analysis
Pearson's correlation coefficient was estimated to evaluate the inter-element relationship of metals in road dust (Table V). The significant positive correlations (> 0.624) observed between Ni-Cr-Cd-Cu indicate that the general contamination sources of these metals were primarily industrial and traffic activities (de Miguel et al., 1997; Lu et al., 2010; Rajaram et al. , 2014). While Pb showed very weak positive correlations with Cu, Cr, Ni and Zn varying from 0.146 to 0.433, a moderate correlation (0.660) was found between Pb and Cd thereby indicating that the source for Pb may be industrial activities apart from the vehicular emissions (Rajaram et al., 2014). Zn showed poor correlation with all other metals except Cu (0.438), which may be due to the influence of traffic activities in these areas (Arslan, 2001; Gray et al., 2003).
3.3 Principal component analysis
The results of PCA indicated that all the elements are well represented by two components (Rajaram et al., 2014), which account for nearly 78% of the total variance for the data (Table VI). The initial component matrix indicated that Ni, Cu and Cd are correlated, displaying high loading values in the first component (PC1) whereas Zn showed greater loading values in the second component (PC2) (Rajaram et al. , 2014). Cr and Pb are partially represented in both PC1 and PC2. The rotation of the matrix eliminated ambiguities. As shown in Table VI, PC1 included Ni and Cr; PC2 included Zn, whereas Cd, Cu and Pb are distributed in both PC1 and PC2. This implies that Cu, Ni, Cd, Cr, Pb and Zn can be defined as anthropogenic components and may originate from similar pollution sources such as particles released by industrial and traffic activities (Rawat et al., 2009; Lu et al., 2010). Cr and Ni are important constituents of many metal alloys (Siegel, 2002; Manno et al., 2006); therefore, the emission sources of these elements could be attributed to the metal processing industries (non-ferrous metal, electroplating, galvanizing, etc.) in the area. Although Pb has been banned as additive in petrol since a number of years, the concentration of Pb in urban road dust still reflects the significant degree of historical Pb contamination and the long half-life of Pb in soils. Some of the Pb in the road dust might have originate from particles emitted by industrial activities, whereas Zn and Cu may have been contributed by vehicular sources i.e. use of brake pads and wear and tear of tires (Saint' Pierre et al., 2004; Amato et al., 2009).

3.4 Metal contamination assessment
3.4.1 Contamination factor and degree of contamination
Contamination factor and the degree of contamination were estimated as suggested by Hakanson (1980) (Fig. 3). The contamination factors (Cif ) indicated very high contamination levels (6 < Cif) of Pb, Zn and Cu, and considerable contamination levels (3 < Cf < 6) of Cd and Cr in the road dust from the industrial areas. The road dust from the mixed areas had concentrations of Cd and Cu of considerable contamination and concentrations of Zn and Pb of very high contamination. In the road dust near the highways, the contamination factors indicated very high contamination by Zn and Pb. The road dust from the residential areas had considerable contamination of Pb and very high contamination of Zn. These results indicate that road dust is most significantly contaminated by Zn and Pb, followed by considerable contamination by Cu and Cd. The concentrations of Cr and Ni indicated moderate contamination of the road dust.
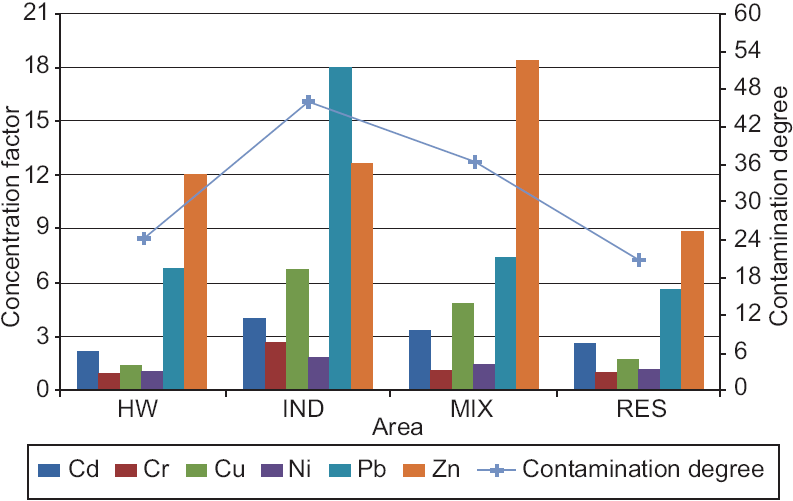
Fig. 3 Contamination factor and degree of contamination of road dust by heavy metals in different areas.
The proportions of the contamination of each metal to the total degree of contamination by the six heavy metals determined in the road dust samples are 6.0-14.4% for Cd, 1.7-10.8% for Cr, 4.5-21.7% for Cu, 2.6-5.7% for Ni, 18.3-36.1% for Pb, and 23.154.7% for Zn (Fig. 4). The degree of contamination in road dust from highways, and industrial, mixed and residential areas are 24.2, 46.0, 36.5 and 20.8, respectively (Fig. 3). These results indicate that the road dust from the highways, the mixed areas and the industrial areas has a very high degree of contamination (24 < Cdeg ). Road dust from residential areas has a considerable degree of contamination (12 < Cdeg < 24). In particular, the degree of contamination for the mixed area 1 was much higher than the value at the other mixed area, which had lesser industrial units. These results indicate that industrial units might have contributed to the increased concentrations of heavy metals in road dust.

3.4.2 Potential ecological risk index
Results of ecological risk assessment of heavy metals in road dust (Fig. 5) revealed that the monomial risk indices (
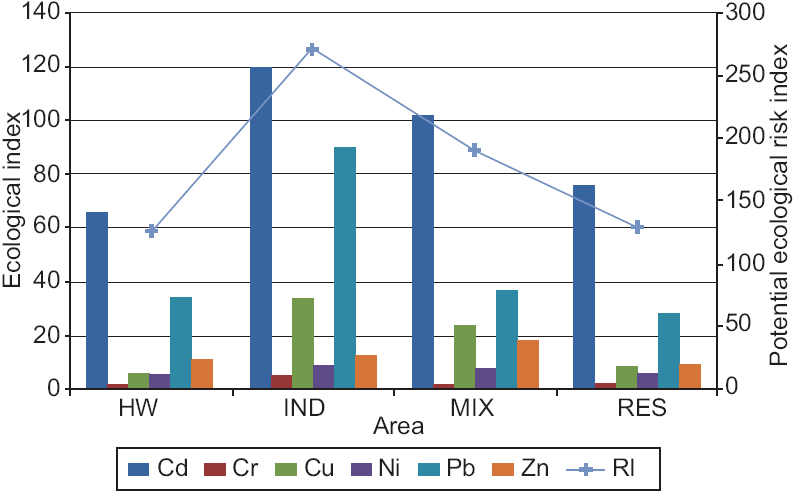
The overall RI of observed metals in road dust was calculated as the sum of all six risk factors (Fig. 5). RI in road dust ranged from 115.6 to 295.7, with an average of 173.5. RI values were higher in the samples from industrial areas and vary between 246.8 and 295.7, indicating that there is a high potential ecological risk. Among different functional areas, the RIs pose high risk in industrial areas, and considerable risk in other areas.
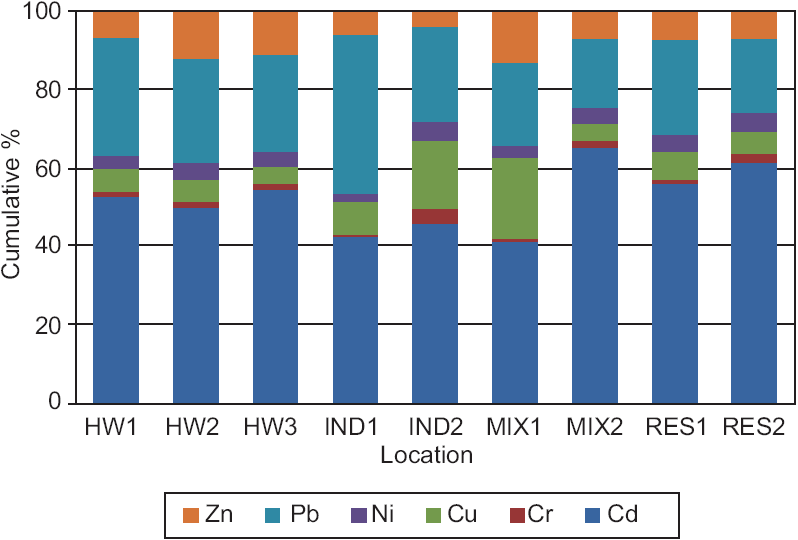
The percent contribution of individual metal to overall RI is demonstrated in Fig. 6. It is shown that Cd accounted for most of the total risks, and the percentages ranged from 41.7% to 65.2% with a mean of 52.4%. Pb ranked the second among the six metals contributing to the total risk, and the average was 25.5%, which was followed by 8.9% (Cu), 7.9% (Zn), 3.9% (Ni), and 1.5% (Cr). It could be concluded that the high ecological risk was primarily posed by two heavy metals, Cd and Pb, as their contribution is nearly 78% of the total potentially ecological risk.
3.4.3 Pollution index
The minimum, maximum and mean values of PI for each metal are shown in Table VII. The mean PI values are generally high, indicating that there was serious pollution of road dust. However, PI values varied among metals. PI values of metals in road dust ranged as follows: Cd, 4.3 to 7.0; Cr, 0.6 to 4.3; Cu, 2.0 to 3.3; Ni, 0.7 to 2.0; Pb, 1.2 to 2.3, and Zn, 1.0 to 3.1 with an average value of 5.3, 1.6, 2.4, 0.9, 1.4 and 1.9, respectively. Most of the samples recorded middle or high pollution level PI values for Cd, Cu and Zn, indicating that urban road dust in Delhi is moderately to highly contaminated.

The PI values of metals were generally higher in industrial areas, indicating the presence of relatively serious heavy metal pollution (Fig. 7). Cd recorded high PI values in all the road dust samples from industrial areas, mixed use areas, residential areas and highways. PI of road dust from industrial areas indicated moderate contamination by Cr, Zn and Cu, whereas road dust from mixed-use areas had moderate contamination by Zn and Cu. In highways and residential areas, the mean PI values of Zn and Cu were close to 2. These findings suggest that the major sources of these metals may be vehicular emissions, and the mechanical parts and tires of vehicles as they are subjected to abrasion (Sadiq et al., 1989; Smolders and Degryse, 2002; Adachi and Tainosho, 2004).

The results showed the following proportions of heavy metal contamination levels (Table VII): 44.4, 11.1, and 88.9% of the road dust samples exhibited low contamination by Cr, Ni and Pb, respectively; 11, 77.8, 11.1, 11.1 and 66.7% of the samples were moderately contaminated by Cr, Cu, Ni, Pb, and Zn, respectively, and 11.1, 22.2 and 11.1% of the samples were highly contaminated by Cr, Ni and Zn, respectively. All the samples were highly contaminated by Cd. These results indicate that Delhi has an important contamination by Cd and a moderate contamination by Cu and Zn. In addition, as shown in Fig. 7, all the roads in this study reported very high values of PI for Cd indicating that Cd contamination in road dust in Delhi is prominent. Furthermore, high (> 1) PI values were observed in only 22% of the samples for Ni. These data indicate that Ni pollution is relatively low in Delhi road dust when compared with other elements.
The IPI value of urban road dust varied from 4.2 to 13.6 with an average of 7.8 (Table VII). There was no sample with IPI < 1, while low pollution levels with IPI lower than 6 accounted for about 33% of all samples. About 67% of all samples with IPI between 6 and 18 indicated moderate contamination. Thus, it is very likely that urban road dust in Delhi is moderately polluted with heavy metals.
Figure 8 shows the spatial distributions of Cdeg, RI, and IPI of the road dust of Delhi. It can be seen from this figure that five out of nine locations in this study had very high values (> 24) of Cdeg while the remaining four locations also had higher values of Cdeg, close to 24 (very high contamination). RI levels at two locations, out of nine, showed high risk; whereas RI levels indicated considerable risk at all other locations, of which two locations are nearing high-risk category. Similarly, IPI at six locations showed moderate contamination and at remaining three locations the IPI values are close to 6 (high contamination). It can be concluded that the road dust of Delhi has been highly polluted by anthropogenic emissions of heavy metals. These heavy metals can easily enter into human bodies through ingestion, inhalation and dermal contact and they can accumulate in the body and pose risks to human health, potentially causing serious problems at high levels. Therefore, strict heavy metal source control is essential to reduce heavy metal pollution in road dust in Delhi.
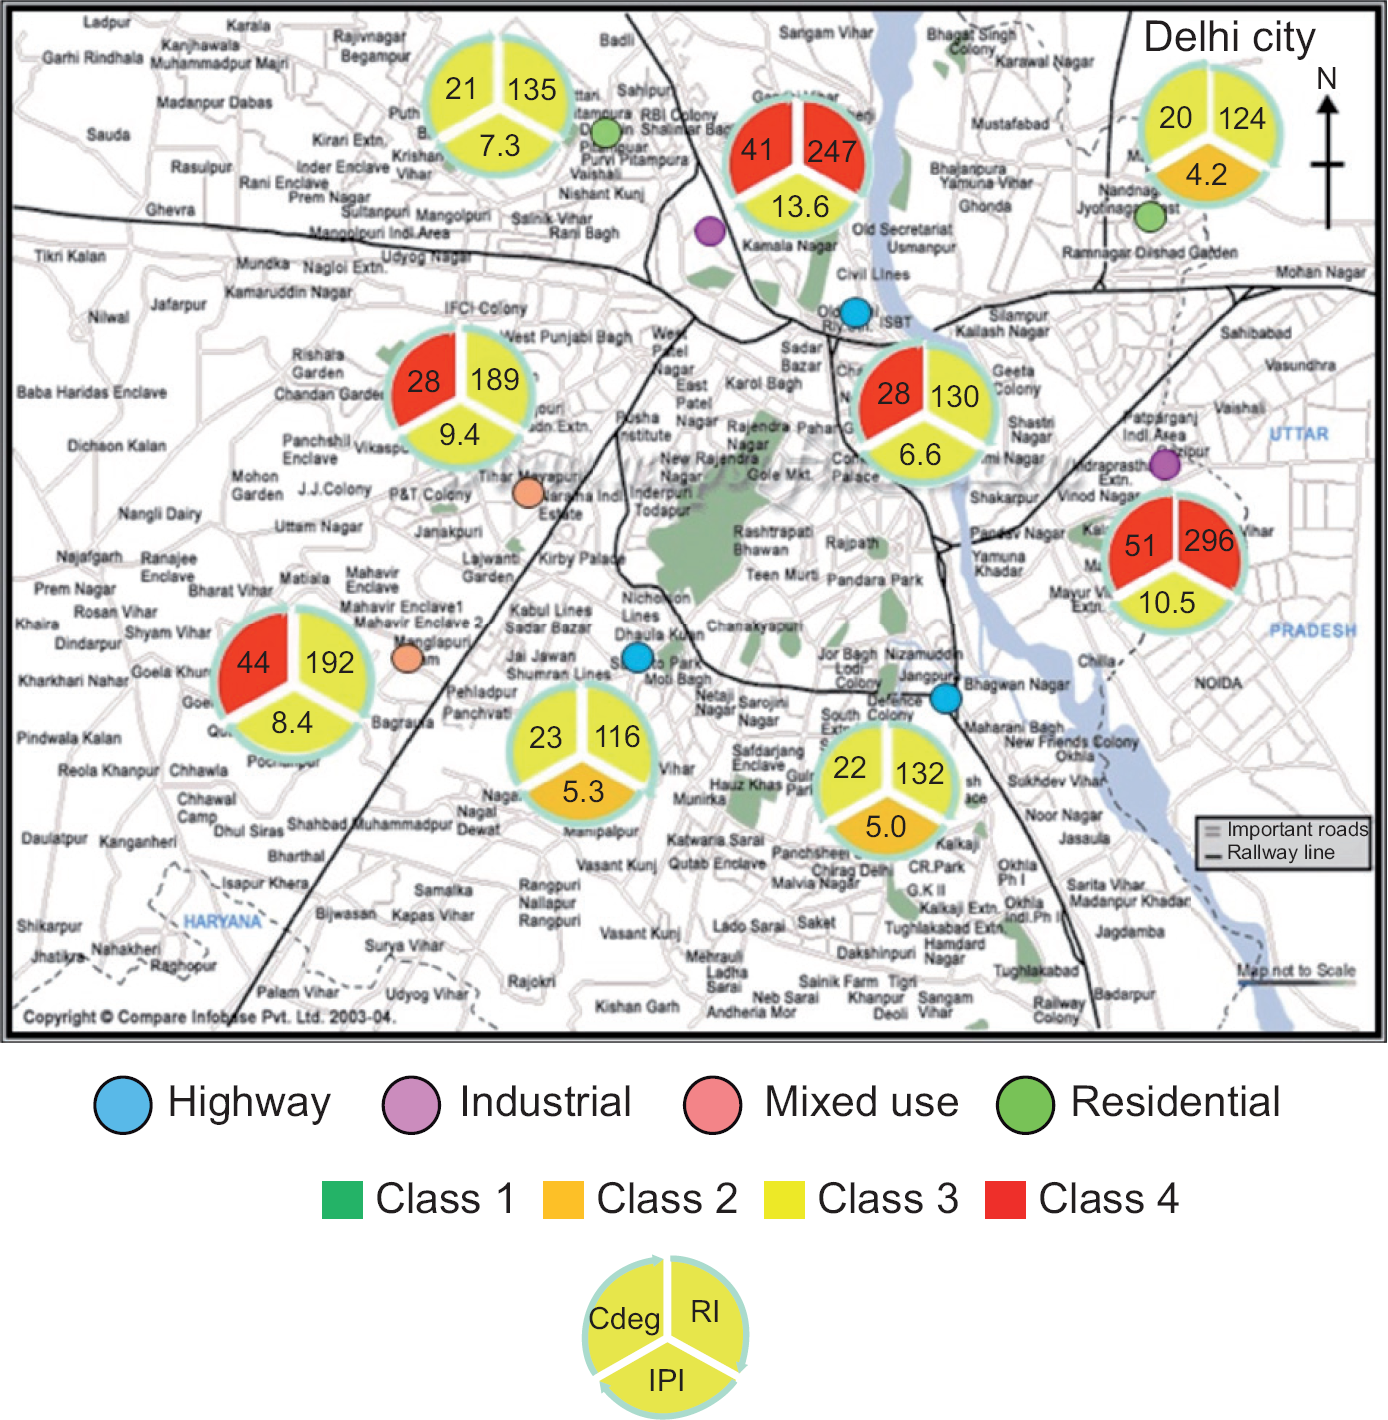
Fig. 8 Spatial distributions of degree of contamination, potential risk index and integrated pollution index in the road dust of Delhi.
From the results of contamination factor evaluation, Cd is mainly in the moderately contaminated category. However, ecological risk caused by Cd was considerable due to its high toxicity. On the other hand, Zn accumulated significantly in the road dusts, but its ecological risk is relatively low. Pollution index results showed that road dust is highly contaminated with Cd and Cu, however, Cu has not accumulated significantly as can be seen from estimated contamination factors, and its ecological risks are also relatively low. Thus, it can be seen that Cif method mainly focused on the accumulation levels of individual metal without taking into account the toxic response factor. RI could describe both ecological risk caused by single pollutant and overall risk or contamination from different kinds of pollutants. PI estimation uses threshold concentrations and can be useful for comparing metal accumulation with the regulatory standards. Therefore, for environmental quality evaluation, all studied assessment methods are important.
4. Conclusion
The analysis of nine road dust samples from different activity zones in Delhi city indicated that the concentration of heavy metals in the road dust collected from industrial area are higher, especially Ni, Cr and Pb. This supports the results of source identification through statistical analysis, which indicates Cd, Cr, Ni and Pb in road dust may be of industrial origin, whereas vehicular traffic may be the major source of Zn and Cu (Rajaram et al., 2014). The metal contamination assessment results based on degree of contamination, potential ecological index and integrated pollution index, revealed that road dusts are mostly contaminated by Zn, Cd and Pb. The road dust from the industrial areas, mixed use areas and highways can be included under a very high degree of contamination with respect to the heavy metals, whereas the road dust from the residential area is having a considerable degree of metal contamination.
The results of the study indicated that the pollution level of road dust in Delhi city is in the category of "moderately to highly contaminated", and for environmental quality evaluation all assessment methods should be combined so that more comprehensive and accurate assessment results can be achieved. The findings of the study are based on the limited number of samples; however, a further comprehensive study is needed in order to better understand the metal contamination of road dust in Delhi and to develop environmental policies and strategies to minimize the contamination.

