


 text new page (beta)
 English (pdf)
 Article in xml format
 Article references
 Send this article by e-mail
 Cited by SciELO
  Similars in
SciELO
Similars in
SciELO 
 Permalink
1. Introduction
Ozone (O3) is one of the primary causes of air-pollution problems in Mexico City, given that more than 20 million people are exposed to concentrations posing a significant risk to their health (Mudway and Kelly, 2000; The Mexico Air Quality Management Team, 2002; Hibler, 2003; Kelly, 2003; WHO, 2006; SMA-GDF, 2010). According to Mexico City's 2009 air quality report (SMA-GDF, 2010a), the levels of ozone reached a maximum hourly value of 0.198 ppm, which is 27% greater than the maximum concentration recorded in Los Angeles, California, on the same year (CARB, 2010) and much in excess of the limit of 0.110 ppm (hourly average) for the protection of environmental health established by the Mexican air quality standard for ozone (SSA, 2002).
One of the most important air quality objectives in the Mexico City Metropolitan Area (MCMA) is the reduction of ozone concentrations. To achieve this goal, it is necessary to reduce and control its precursors (i.e., volatile organic compounds [VOCs] and nitrogen oxides [NOx]) through appropriate environmental management policies. These policies require knowledge of the distribution, character, and daily pattern of reactive species and their photochemical processes (Evans et al., 2002; SMA-GDF, 2012).
The purpose of this study is to design a real-time ozone precursors monitoring network in Mexico City, given that their continuous monitoring will be critical to evaluate the production of ozone. These measurements will provide important information for assessing the state of air quality, for improving the proposed control strategies effectively, and for eventually solving the serious problem of ozone pollution in Mexico City.
2. Background
Continuous monitoring of ozone precursors, specifically VOCs, is very limited in most countries, largely due to the difficulties associated with sampling, speciation analysis, the cost of maintenance and operation of monitoring equipment, and the need for highly trained personnel for analysis and data validation (Demerjian, 2000; Gros et al., 2007). Furthermore, this type of monitoring is primarily focused on cities with problems of ozone pollution or other photochemical pollutants (US-EPA, 1994, 1997; EU, 2008).
Japan is among the countries where VOC monitoring has an ample precedent. Indeed, since 1976 there have been monitoring stations measuring non-methane hydrocarbons (NMHCs) and total VOC concentrations (Wakamatsu et al., 1996). The United Kingdom has a VOC network consisting of a manual system for monitoring benzene and 1,3-butadiene, and an automated system that measures, in addition, 29 ozone precursor compounds (UK-Air, 2016; Dernie and Dumitrean, 2013).
The countries of the European Union follow the guidelines set forth in Annex X of the Directive 2008/50/EC of the European Parliament and of the Council of May 21, 2008 on ambient air quality and cleaner air for Europe. Measurements of ozone precursor substances include at least nitrogen oxides (NO and NO2) and 27 species of VOC. The monitoring is performed in urban or suburban areas.
The World Meteorological Organization (WMO) report on pollution of the air and climate in megacities contains a summary of air monitoring data from cities with pollution problems in Africa, Asia, America, Oceania, and Europe, and mentions VOC monitoring campaigns have been performed in certain countries (WMO/IGAC, 2012).
In Canada, the National Air Pollution Surveillance (NAPS) Network began routine measurement of VOC at selected sites in the country in 1989 (Demerjian, 2000). The Canadian Multi-Stakeholder NOx/VOC Science Program was established in 1992 with the goal of establishing science-based actions to eliminate exceedances of the ozone standard, which is an 8-h average limit of 65 ppb in the troposphere (Olivotto and Bottenheim, 1998; EC, 1999, 2014).
In 1993, the US-EPA modified the Clean Air Act including criteria for monitoring stations that evaluate photochemical pollution (US-EPA, 1994). The instrumentation of a PAMS program concerns cities where ozone exceeds the standard established in 2008 on the National Ambient Air Quality Standards of 75 ppb on average over an 8-h period (EPA, 2008). The objective of this program is to have a complete database of ozone and its precursors for the development of control strategies and assessment, emissions tracking, trend analysis, exposure assessment to photochemical pollutants, and evaluation of air quality models. The US-EPA currently operates 23 PAMS sites in metropolitan areas (US-EPA, 1994, 1997, 2014; Demerjian, 2000).
The United States and Canada have established criteria for evaluating stations for monitoring ozone and its precursors. The design criteria of the US-EPA PAMS network differ from those of other networks because each site needs to meet specific goals. The PAMS network has four types of sites. One type is located upwind far from the sources of precursors. Additional types are located at the center of maximum precursor emissions, in the area of greatest impact of ozone, and in the downwind area of pollutant transport to other regions (US-EPA, 1994; Demerjian, 2000). The criteria for network design in Canada are broader in scope in the sense that they include features not included in other atmospheric monitoring networks and are classified into different types of sites. These types consist of (1) those related to the assessment of control strategies in urban areas, (2) verification of emissions in regions with large sources of precursors, (3) short-range transport where peak ozone occurs, (4) long-range transport in the ozone dispersion path, (5) transboundary influences to assess pollutant flows, (6) effects on agriculture, (7) effects on forestry, (8) impacts on human health, (9) background concentrations in pristine regions, and (10) relevant areas that may be affected by emissions from short- or long-range anthropogenic sources (Demerjian, 2000; CCME, 2003).
In Latin America, the city of Santiago de Chile has continuously monitored NMHCs since 1997. In this city, monitoring began with eight stations, although historically there is information from 10 sites (Seguel et al., 2012). However, by 2014 information was only collected at two stations, although there was no information regarding the selection of these sites (SINCA, 2014).
Since the 1980s, several monitoring campaigns for VOCs have been performed in Mexico City, which served to determine the composition, emission patterns, spatial distribution, reactivity, diurnal patterns, and sources of the most important reactive groups (Bravo et al., 1988, 2002; LAN/IMP, 1994; Ruiz et al., 1996; Arriaga et al., 1997, 2004; IMP, 1998; Edgerton et al., 1999; Bueno et al., 2004; García et al., 2006; Zavala et al., 2006; Molina et al., 2007, 2010; Velasco et al., 2007, 2008, 2009; Volkamer et al., 2007; Fortner et al., 2009; de Gouw et al., 2009; Karl et al., 2009; Lei et al., 2009; Sosa et al., 2009; Apel et al., 2010). Garzón et al. (2015) show the spatial and temporal distribution of different species of VOCs in two periods of the year, as well as their behavior through time in various monitoring campaigns recently conducted in Mexico City. They emphasize the need for continuous and permanent monitoring of VOCs to understand the behavior of ozone precursors, identify the impact of toxic species and assess ozone formation in more detail.
These studies have provided an extremely comprehensive characterization of the urban and regional atmospheric composition and chemistry of Mexico City, information that will improve significantly the scientific understanding needed by decision makers in the MCMA to craft effective policies. However, studies results confirm that the atmosphere is dynamic and in constant transformation, so continuous monitoring is needed to assess atmospheric changes resulting from the implementation of control strategies and the variation of emission sources.
Such a network should take into account factors that affect the production of precursors and be helpful for developing policies and effective programs aimed at the prevention, minimization, and control of air pollution, as well as for the improvement of air quality in the city. Therefore, establishing a network of ozone precursors in Mexico City based on the method proposed by the US-EPA (1994) for a PAMS network, and based on the existing infrastructure of the SIMAT in Mexico City will help to satisfy two priorities: (1) to limit the financial cost of maintenance and operation as allowed by the civil service, and (2) to obtain maximum useful information for correct decision-making.
3. Methodology
The method for selecting the monitoring sites that comprise the network was performed by following the recommendations of the US-EPA (1994). In general, the design of a monitoring network for reactive ozone-precursor compounds should include the selection of representative monitoring sites, where the impacts of precursor emissions may be characterized under prevailing wind conditions during events of high ozone concentrations; and should provide information regarding the formation process of photochemical ozone, its transport and that of its precursors (US-EPA 1994; US-EPA, 1998). The criteria for selecting such sites differ from those used in the design of a conventional pollutant-monitoring network. In an ozone-precursors network, a particular function is assigned to each site and it is designed to generate information for a specific purpose (US-EPA, 1994, 1997; Demerjian, 2000; Yoo and Park, 2010).
The selection of sites is the most important task in the design of the network, and as a result most representative locations for accomplishing the design goals should be chosen. To reduce the costs of installing new monitoring stations in Mexico City, this document proposes that the current infrastructure of the SIMAT should be considered and, based on the application of this method, suitable sites should be selected to meet the design criteria.
According to the US-EPA (1994), the network configuration should include four types of monitoring sites:
Type 1: Upwind site for the characterization of background concentrations. A type 1 site permits an assessment of background concentrations, ozone-transport, and its precursor concentrations. It should be located upwind of the area where maximum precursor emissions are generated with respect to the prevailing daytime wind directions.
Type 2: Site for evaluating the impact of maximum precursor emissions. A type 2 site is intended for the evaluation of magnitudes and types of precursor emissions which are representative of the city, in the area where the impact of maximum concentrations is expected. This type of site is also recommended for monitoring toxic pollutants. Its location should be near the area of maximum precursor emissions and close to the center of the city and business districts, or in areas where a mixture of precursor emissions can be found.
Type 3: Site for the evaluation of maximum ozone concentration. The objective of a type 3 site is to record the maximum ozone concentrations downwind of the zones of maximum precursor emissions. It should be located 15 to 45 km from the source of the emissions and near the urban boundary.
Type 4: Site for monitoring downwind emissions. The purpose of a type 4 station is to characterize extreme downwind transport of ozone and its precursors, in order to identify remote areas that may be impacted by ozone transport. Such a site should be located along the prevailing evening wind direction and downwind of the area of peak precursor emissions.
3.1 Selection of monitoring sites
A five-step process is followed to select the sites for an ozone-precursor monitoring network.
3.1.1 Step 1. Air quality analysis
The goal of step 1 is to assess whether the study area requires the installation of a network for ozone precursors. It is necessary to analyze the air quality with regard to pollutants such as ozone, NOx, and carbon monoxide (CO). In this step, daily variations and spatial distribution of the concentrations of these pollutants in the area of study at the time of year of highest ozone concentrations are determined. This first analysis allows for an assessment of the problem related to the Air Quality Standards (AQS) of environmental health.
3.1.2 Step 2. Determining the prevailing wind directions
The objective of step 2 is to identify the prevailing wind directions in the area of study. It is necessary to generate wind roses based on the vector averages of the meteorological stations in the area of study during the analyzed time period. Data should focus on two time periods: (1) the time of year when maximum ozone concentrations are recorded, and (2) two times of the day, one when peak ozone-precursor emissions are recorded and a second when maximum ozone concentrations are reached before ozone's dispersal. Based on these wind roses, the prevailing wind directions are determined.
3.1.3 Step 3. Locating the centroid of emissions
The objective of step 3 is to identify where the maximum ozone-precursor emissions are located, i.e., to locate the centroid of emissions in the area of study. Information from the ozone-precursor (NOx, CO, and VOC) emissions inventory is required in addition to the spatial distribution of the emission sources. Emissions of the three pollutants were added and classified in five categories to select those higher than 300 ton/year. According with the spatial distribution inside the grid, only the cells where these categories are present were considered, and the centroid was determined based on these cells. The centroid is estimated using geospatial statistical methods. One option is to use a geographic information system (GIS) and to plot the information from the ozone-precursor emissions inventory on a grid of cells measuring 1 km2. In this way, the coordinates of the center of each cell and those of the centroid  are obtained (Eqs. 1 and 2).
 (1)
(1)
 (2)
(2)
where x represents the coordinate x of the centroid for the cell i, y represents the coordinate y of the centroid for the cell i, and n represents the total number of cells used for the calculation.
A subjective option to identify the centroid when the emissions inventory information is lacking, is to map the industrial areas, roads with high vehicular traffic, areas of high population densities, business centers, shopping areas, and major governmental offices. The centroid would then be located along the dominant morning wind vector and slightly downwind of the main center of activity in the city (US-EPA, 1994).
3.1.4 Step 4. Selection of monitoring sites
The following fundamental criteria are taken into account in step 4:
A sector analysis is performed to delineate the sectors upwind and downwind of the maximum ozone precursor emissions. The precursor emission centroid obtained in step 3 and the wind roses obtained in step 2 are used.
The upwind sector is defined based on the wind rose data and the prevailing morning wind. Two imaginary lines forming an angle of 45° are drawn from the centroid and are bisected by the line of the prevailing morning wind direction. The upwind sector extends at 45° within the area defined between the imaginary lines, in the opposite direction of the prevailing morning wind direction. Similarly, the downwind sector is defined at 45° between the imaginary lines, in the direction of the prevailing afternoon wind direction. The determination of these sectors is shown in Figure 1.

When a prevailing wind direction (morning, afternoon or both) has more than one component, then the imaginary lines have to allow for an angle greater than 45° (US-EPA, 1994).
Based on this zoning, the areas where monitoring sites can be installed are determined according to their types, which were described earlier.
The second criterion is the distance between sites. Its objective is to locate the monitoring sites at suitable separations from one another to obtain representative samples of precursor emissions according to their spatial scale and the monitoring objectives. The sites should provide coverage for most of the area of study. To determine the distances between monitoring sites, the locations of likely sites should be mapped. Arcs of specific radii should be drawn from these sites based on the type of site. Types 1, 3 and 4 sites are intended for monitoring on an urban scale and type 2 sites are designed for monitoring on a neighborhood scale. Subsequently, a spatial interpolation should be developed based on air quality information from the ozone monitoring sites, and concentrations in the representative area of each site are thus obtained.
The representativeness of these sites is evaluated based on the mapped arcs to verify that there are no overlaps between sites. When comparing concentrations in the interpolation, any redundancy in the measurements is discarded. Measurements on an urban scale characterize conditions in an area of 4-50 km2, and represent the concentration distribution in a metropolitan area. Measurements on a neighborhood level characterize the conditions in an area of 0.5 to 4 km2, and represent the concentration distribution of the pollutants mixture in an urban subregion. Monitoring on this scale is used to assess the impacts of exposure and emissions trajectory and to provide information regarding pollutants in residential, business and commercial areas.
3.1.5 Step 5. Physical environment evaluation
The physical environment of a monitoring station determines the extent to which the monitoring objectives of representativeness and spatial coverage are achieved. A location where wind flow is obstructed can significantly limit the spatial representativeness of a station. Therefore, it is important to investigate the physical environment of a site during the design phase. In this step, the site is evaluated based on an assessment of the distance of the sampling point to obstacles, the height of the sampling point above the ground, and the minimum distance to trees and vehicular traffic (US-EPA, 1978, 1997, 1998).
3.2 Data
The application of this method in the MCMA is based on the following data:
Data regarding the distribution of emission sources and precursor emissions (NOx and VOC) was obtained from the 2008 MCMA emissions inventory. This inventory contains information regarding stationary, area, mobile and biogenic sources, for 1-km2 cells in units of tons/year (SMA-GDF, 2010b).
Data for 2003 regarding land use in Mexico City was obtained from the Centro de Investigación en Geografía y Geomática (GEO Research Center), and data for the State of Mexico was obtained from information provided by the Comisión Nacional para el Conocimiento y Uso de la Biodiversidad (Mexican Commission for the Knowledge and Use of Biodiversity, CONABIO) for the year 2000 (PNUMA, 2003; CONABIO, 2010).
Meteorological data was obtained from stations of the SIMAT for the years 2005-2009. The set of data contains considerable gaps and inconsistencies for several stations, thus we only considered information from stations with at least 75% of the annual data (DMA-SMA-GDF, 2010a).
Air quality data was obtained from the public databases of the Mexico City SIMAT for the years 2005-2009 from stations that measure O3, NO2, NOx, and CO. Based on this information, indicators were obtained to assess the daily behavior and times of year when the highest levels of ozone are present; spatial distribution maps were developed with the annual maximum averages of the hourly data; and basic statistics were compiled for all pollutants assessed at the monitoring sites. Carbon monoxide distribution was used as a proxy for the hydrocarbon (HC) distribution, in agreement with the work by Riveros et al. (1995), who conducted continuous measurements and found that some HC are emitted in proportion to mobile emissions of CO, as the highest correlation of these species occur in early morning hours (6:00 to 9:00 LT) due to fresh emissions from traffic as the source of ozone precursors, and because photochemical activity is not strong yet and the mixing layer is low, which limits the dispersion of air pollutants. In the case of ozone data, a frequency distribution analysis was performed to identify those stations where the highest concentrations are present and the days when the ozone contingency plan was activated. For each of those days, the meteorological and air quality conditions that led to the activation of the contingency plan were carefully analyzed, and the results served to support the prevailing wind pattern models and the upwind and downwind sectors extending from the centroid. Based on these analyses, the rationale for implementing the monitoring network for ozone precursors was determined (DMA-SMA-GDF, 2010b).
Information from the 2000 Censo Nacional de Población (National Population Census) and projections of the 2009 database form de Consejo Nacional de Población (National Population Council, CONAPO) for statistics comprised in the area of study were used. Population densities were calculated at the proposed monitoring-station sites (CONAPO, 2009).
Physiographic characteristics of the MCMA were obtained from the Instituto Nacional de Estadística y Geografía (National Institute of Statistics and Geography, INEGI). The main mountain ranges and ridges surrounding the area of study were identified, and this information was used to evaluate the airflow and the pollutant dispersion patterns (INEGI, 2005).
4. Results
This section describes the results of the air quality analyses as well as the prevailing wind directions, the location of the centroid, and the selected sites that comprise the projected network for monitoring reactive ozone precursor compounds.
4.1 Air quality analysis
After analyzing the air quality information spanning the period from 2005 to 2009, it was observed that all the existing stations located in the MCMA recorded ozone exceedances according to the maximum AQS (MAQS) limits for environmental health, i.e., a value of 110 ppb during any hour along the year. The Pedregal (PED) station in the southwestern part of the city recorded the greatest hourly exceedances: 511, 428, 342, 291, and 287 hours during the five years from 2005 to 2009, respectively. This trend was also observed in the 8-h average, where the AQS (< 80 ppb) was exceeded at all of the stations in the MCMA. The PED station recorded the highest of such values: 135, 127, 122, 126, and 123 ppb during the five years from 2005 to 2009, respectively. The maximum values of these indicators are regularly recorded in the southwestern part of the area of study, as shown in Figure 2.

Fig. 2 Spatial distribution of the annual average of daily maximum 1-h ozone concentration for 2005-2009.
Based on this information and on the trends of pollutant levels in Mexico City (SMA-GDF 2012), the need for installing an ozone precursor network to understand the development of this pollutant was confirmed. Information from the ozone precursors network is important for present and future studies directed to reduce ozone concentrations in the MCMA.
The maximum concentrations of ozone are usually recorded during the hottest months, which are from March to June. This time of the year is characterized by clear skies, greater solar radiation, low humidity and high temperatures.
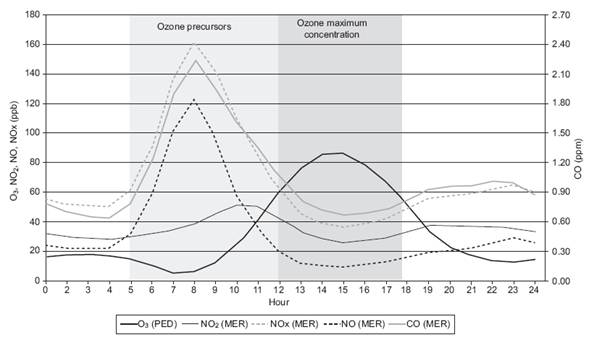
The analysis of the daily behavior of ozone and its precursors indicates that the maximum concentrations of NOx and CO occur between 05:00 and 10:00 a.m. (Fig. 3). This daily time period coincides with the pattern of maximum daily emissions from mobile sources, and relatively low wind speed and vertical mixing. However, lower concentrations occur during mid-day, when traffic is light and vertical mixing is maximum. This period was therefore considered for the analysis of the morning wind patterns.
4.2 Prevailing wind directions
The US EPA (1994) proposed several criteria for developing wind roses: (1) identifying meteorological conditions that favor ozone formation, such as temperatures > 30 °C, wind speed ≤ 5 ms-1 (7:00 to 10:00 LT), wind speed ≤ 7 ms-1 (13:00 to 16:00 LT), and relative humidity ≤60%; (2) identifying the months of the ozone season, i.e., the time of year during which high ozone concentrations are observed; (3) identifying the days during which ozone concentrations exceed 100 ppb; and (4) using five to 10 years of meteorological data to reduce the variability in the above data.
In the case of MCMA, the US-EPA criteria were adapted as follows: (1) surface meteorological information from the SIMAT stations was analyzed to verify the reliability of the measurements; (2) the months during which the highest ozone concentrations (> 110 ppb) were most frequently recorded were selected; and (3) two periods of wind data were selected to determine the daily patterns of ozone and ozone precursors.
Based on the US-EPA (1994) recommendations, and in order to reduce the variability in wind roses and adequately select the prevailing wind directions during ozone episodes, it was decided to use data not only from the most critical days but also from the months with high ozone concentrations, in order to reduce the variability. Furthermore, a statistical analysis of wind information from two periods (2005-2009 and 2008-2009) was performed to determine the degree of consistency that can be obtained based on limited information. The results indicated no significant difference (α < 0.05, Wilcoxon test) between the frequency distributions of wind directions during both periods. In addition, the resulting prevailing wind directions do not vary significantly: two azimuthal degrees for the period from 5:00 to 10:00 LT and five azimuthal degrees for the period from 12:00 to 18:00 LT.
A composite northwesterly and northerly wind prevails during the morning hours (05:00 to 10:00 LT), and a composite northerly and northeasterly wind prevails during the afternoon hours (12:00 to 18:00 LT). These prevailing wind directions correspond solely to the months of March through June during the period 2008-2009.
4.3 Centroid and sector determination
According to the US-EPA (1994) recommendations, it is necessary to perform a sectorization of the MCMA area to facilitate the search for possible monitoring sites. In this step, a geographical reference based on the center of emissions in the region is set. From this center, i.e., the centroid, sectors between lines at 45° or more are delineated based on the wind roses; the purpose is to locate monitoring sites in the upwind and downwind sectors as a function of prevailing winds in the MCMA. In this study, the centroid was located at UTM coordinates x = 487 500, y = 2149 500 (19.439838° lat., -99.119081° long.). This point was located using geospatial methods based on the information from the 2008 MCMA emissions inventory (SMA-GDF, 2010b) and the distribution of sources of ozone precursors (NOx and VOC) in a grid composed of 2225 cells of 1 km2 (Fig. 4). This centroid is located downtown in Mexico City where the main roads, the business center, the main government offices, and the tourist zone converge.

Based on this centroid location, the area of study was sectorized as follows: (a) the upwind zone, based on the prevailing morning winds, extends north from the centroid and contains the industrial zone in the northwestern part of the city and the major roads that connect to Mexico City the adjoining State of Mexico municipalities; (b) the downwind zone extends southwest from the centroid due to the prevailing evening winds; the highest ozone concentrations are regularly recorded in this area (Fig. 4).
4.4 Monitoring sites
The network, as described in the methodology section, was designed based on the presence of the existing SIMAT infrastructure to reduce operating costs, whereby the selected sites will increase the existing monitoring capacity to create the ozone precursor monitoring network.
Once the sectors were delineated, the locations of the monitoring stations were identified in each sector in accordance with the characteristics of the four types of sites recommended by the US-EPA (1994), as summarized in Table I.

4.4.1 Type 1
A type 1 (T1) site should be located such that it intercepts a precursor plume originating in urban areas upwind of Mexico City. This site should be located within reasonable distance from the most significant sources of precursor emissions. This location is based on the results of the sector analysis, which in turn is based on the prevailing wind directions.
Figure 4 shows that the upwind sector contains all of the SIMAT stations located north of the city: Villa de las Flores (VIF), Tultitlán (TLI), Atizapán (ATI), Tlalnepantla (TLA), Vallejo (VAL), La Presa (LPR), Xalostoc (XAL), San Agustín (SAG), Los Laureles (LLA) and Acolman (ACO). All of these stations, with the exception of ACO, are in locations affected by stationary and mobile sources. The ACO station displays the best characteristics of a type 1 site: it is located in the path of the prevailing winds, it is situated upwind of the emissions, and it is not directly affected by emissions sources.
The ACO monitoring station is located on the boundary of the MCMA in a moderately urbanized zone, although this area is primarily rural or semirural. This station contains equipment for monitoring O3, SO2 and PM10.
4.4.2 Type 2
A type 2 (T2) site should be located in an area where a representative mixture of precursors is expected to have an impact, i.e., where the composition of the city's emissions may be assessed. The MCMA comprises approximately 5146 industrial facilities, which represent 16% of the nation's industrial capacity, and more than 4.5 million vehicles. According to the 2008 emissions inventory (SMA-GDF, 2010b): 591 000 ton/year of VOCs were emitted; area sources contributed with 41% (241 000 ton/year) of the emissions, mobile sources contributed with 31% (185 000 ton/year), point sources contributed with 22% (129 000 ton/year) mainly from chemical industry, and biogenic sources contributed with 6% (36 000 ton/year). On the other hand, 188 000 ton/year of NOx were emitted, of which mobile sources produced 82% (155 000 ton/year), point sources contributed with 11% (20 000 ton/year) mainly power energy, and area sources with 6% (12 000 ton/year) (SMA-GDF 2010b).
It is important to mention that the high concentration of alkanes registered in Mexico City is due to the general use of LP gas in residential areas for cooking and water heating for more than 20 years (Gasca et al., 2004; Velasco et al., 2007; Bon et al., 2011). The reactivity coefficient of these light alkanes is low, however due to their high concentration in the atmosphere their contribution to ozone formation is relevant (Sosa et al., 2009).
The spatial distribution of industrial areas and mobile sources determines the participation of the emissions of ozone precursor pollutants, which are primarily NOx and VOCs. The most significant sources of NOx and VOCs are located in the northern part of the MCMA. In the central region, however, the bulk of the emissions were identified based on information from the 2008 emissions inventory.
Based on these findings, the MER station displays the best characteristics of a T2 site. This station is located near the emissions centroid. Roads are located at a recommended distance (US-EPA 1978, 1997, 1998), there are no nearby obstacles that limit the free flow of air, and the sample equipment is at the recommended height above the ground. These site characteristics ensure the collection of representative data on a neighborhood scale.
4.4.3 Type 3
A type 3 (T3) site should be located within the sector where maximum ozone concentrations occur, downwind of emission sources. The US-EPA (1994) recommends that it be located on the boundary of the metropolitan area and at a 5-7 h travel distance of the emissions from their sources. Locations are preferably along the path of the prevailing afternoon wind and where emissions of nitric oxide (NO) are low.
According to the SIMAT records, the southwestern part of the area experiences maximum ozone concentrations most frequently. Factors that control this pattern are the prevailing wind direction from the north and the limitation of dispersion due to the presence of the Ajusco mountain range, which favors the accumulation of ozone and its precursors. Maximum ozone concentrations are recorded between 15:00 and 17:00 LT, and they frequently exceed the limits of 110 ppb (hourly average) and 80 ppb (8-h average) established by the MAQS (SSA, 2002; SMA-GDF, 2012).
The sectorization analysis identified various stations in the southwestern part of the area. However, the detailed analysis of the available information indicated that the PED station registers a higher frequency of maximum ozone concentrations. The characteristics of the PED station, its surroundings, and the distribution of contaminants in the vicinity ensures the urban-scale representativeness of this station.
4.4.4 Type 4
A type 4 (T4) site is intended to assess the transport of ozone and its precursors to other regions beyond the MCMA; thus, in this case a T4 site would be intended to estimate the transport of pollution from Mexico City to other urban or rural areas. It is essential that such a site be located downwind of areas where the highest ozone concentrations are recorded and located along the path of the prevailing afternoon wind. Clearly, the most important criterion to consider is the prevailing afternoon wind direction on the days of maximum ozone concentrations.
The prevailing winds from 12:00 to 18:00 LT blow from the north-northeast direction. The wind in the MCMA exhibits a marked pattern of southward flow during the months when the highest ozone concentrations are recorded. Moreover, the meteorological model provides a detailed characterization of the wind patterns in the Ajusco and Las Cruces mountain ranges. When the dispersion of pollutants is simulated, it is possible to observe entrainment of pollution through the lowlands between the Ajusco mountain range, which forces the uplift of air masses moving from the central and northern parts of the valley (Ali et al., 2010). Based on these conditions, the installation of a T4 station is recommended at the site of the Ajusco (AJU) station, which is located in Parres, a village in the borough of Tlalpan on the border with the state of Morelos (Fig. 5).

Fig. 5 MCMA physiographic map and wind flow direction using the wind speed and wind direction of the surface stations (12:00-18:00 LT, 2008-2009).
Another important criterion in the selection of sites is that distances between sites are in accordance with the scales of representativeness, in order to obtain a representative sample of the area's precursor emissions and avoid redundancy (US-EPA, 1994). To that end, the annual average maximum daily ozone concentrations during the period 2005-2009 were interpolated between the selected sites. It is important to mention that the values of the AJU station were calculated by interpolation using the Kriging method, since this station lacks equipment to determine ozone concentrations. The areas of spatial representativeness for each type of site were mapped in the GIS environment, and the overlaps between sites were evaluated. The results indicate that none of the four selected sites is redundant, and the four sites are located at the recommended distances between sites, as shown in Figure 6.

After performing all the steps of the analysis, the recommended network for ozone precursors compounds includes the Acolman (ACO), Merced (MER), Pedregal (PED), and Ajusco (AJU) stations (see Table II and Fig. 7). Because the ambient air monitoring at these stations is focused on the characterization of the ozone problem within the MCMA, it is suggested that the selected stations be equipped for ozone, NOx, and CO monitoring, as well as surface meteorology. In addition to the measurement of VOCs, the number of species considered must be a function of the atmospheric characteristics and pollutants present in the area of study, as well as the budget available for the analyses of species. In order of importance, some of these species are: VOC species that are markers of emission sources such as biogenic (isoprene); gasoline vehicles (acetylene, benzene, isopentane, 1,3-butadiene); diesel vehicles (dodecane); solvents (n-decane, toluene, xylene); natural gas (ethane); LP gas (propane, n-butane); industry-specific markers (toluene, n-hexane, xylene, formaldehyde, styrene, phenol.); VOCs with ozone forming potential (alkenes, carbonyls); and VOC species that are representative of urban, regional and rural environments. Given their relevance, the following objectives should also be considered depending on the characteristics of the site: VOCs contribution to secondary organic aerosol (SOA) forming potential; and VOCs identified as air toxics or likely air toxics precursors (CASAC, 2011; SMA, 2010a).


It is recommended, at least for site T2 and if possible for T3, to install monitoring equipment for VOCs. The type of equipment depends on the technological advance, as well as the budget and trained staff available for the analyses of VOCs.
It is recommended to measure NOy in T1 and/or T3. As technology advances and the first results are analyzed, it is important to consider the possibility of counting with higher sensitivity equipment, for example analyzing carbon monoxide or measuring true NO2. In this respect, it is important to have specific equipment for true NO2 measurements. The most significant issue regarding standard chemiluminescence NO/NOx/NO2 monitors is their inability to directly and specifically detect NO2, which causes interference as described by Winer et al. (1974), who found that other gaseous-phase nitrogen compounds are converted to NO by the molybdenum oxide catalysts and therefore can be reported as NO2 by the equipment.
Dunlea et al. (2007) conducted an assessment of this type of equipment in Mexico City and found an interference of 50% in the reported NO2 total concentration present every day during the afternoon, when the higher ozone concentration occurred. They found that high amounts of reactive nitrogen species can lead to an overestimation of NO2 concentrations and that interference in the sites near the fresh emissions are due to the combination of HNO3 and all of the alkyl nitrates; also that higher interference in the aged parcels of air is due to the presence of these latter compounds.
A consequence of this interference is that errors can be introduced in the photochemical models used to assess control strategies of photochemical oxidants as ozone, as well as the wrong interpretation of the AQS for NO2. Finally, it is recommended to install equipment for PM2.5 measurement in sites T3 and T4 since these are located in areas that potentially can register the formation of secondary organic aerosols (SOA).
This initial configuration is preliminary and is subject to revision based on the initial monitoring results.
5. Discussion
The aim of this work is to design a network for monitoring ozone precursors in the MCMA. It was found that the recommended method of the US-EPA for installing a PAMS network is applicable to a megacity such as Mexico City. However, because of its physical, economic, and social characteristics and the availability of information regarding air quality, meteorology, and emissions, it was necessary to adapt the US-EPA method in terms of the identification of the centroid, the development of wind roses and the determination of distances between sites based on their spatial representativeness.
The US-EPA recommends delineating the upwind and downwind sectors of the study area in order to select proper site locations. It was found during the period of March to June, when the highest ozone concentration levels are recorded, that the prevailing wind is northwesterly in the morning hours and northerly in the evening hours. These wind patterns control the temporal patterns of ozone distribution and those of its precursors.
Moreover, it is necessary for the wind roses to be prepared in accordance with meteorological conditions and pollutants of interest in each city under study. In this study, the minimum number of years required to develop the wind roses was assessed, and it was found that two years of information yielded the same result as five.
The US-EPA recommends the use of modeling techniques to obtain the emission centroid based on emission density maps; however, the method is not described in great detail. In this study, the centroid was estimated using geospatial statistical methods by producing a grid that contained information regarding the emissions of NOx and VOCs. This allowed to describe how the centroid was obtained, in contrast to previous studies in Taiwan (Yoo and Park, 2010) and Korea (Lee, 2012), in which the US-EPA method was used but no mention was made of how the centroid was obtained. In addition, these studies indicate that the current PAMS in the city of Busan, Korea, do not reflect the areas where the maximum ozone concentrations in the city occur. In the case of Mexico City, by using the current SIMAT infrastructure and selecting the station that historically registers O3 maxima, it was ensured that there will be measurements in the area where the maximum O3 concentrations occur.
Both the US-EPA and Dermejian (2000) mention that the selection of sites is the most important task in the design of a network and that this process should result in the most representative location for the purposes of the site. As a result of our analysis, the proposed network for monitoring reactive ozone precursor compounds includes the Acolman (ACO), Merced (MER), Pedregal (PED) and Ajusco (AJU) SIMAT stations. Because the air quality monitoring at these stations is focused on characterization of the ozone problem within the MCMA, it is suggested that the selected stations be equipped for monitoring ozone, NOx, CO, and VOC.
The US-EPA method recommends an adequate distance between sites to obtain representative samples of the precursor emissions in accordance with their spatial scale and monitoring objectives. The network should thereby provide coverage of most the study area. The four selected SIMAT stations are separated by distances that will provide representative emissions data on urban (ratio > 4 km) and neighborhood (0.5 km ≤ratio ≤ 4 km) scales, thereby eliminating any redundancy. These distances were verified based on the interpolation of the annual average ozone concentrations during the specified period.
The ACO, MER, PED, and AJU stations of SIMAT should be equipped with the recommended measuring instruments to become part of the ozone precursor network (Table II). The personnel responsible for the network should be trained in the management of the equipment (e.g., maintenance, calibration, and operation) and in the validation of data regarding air quality, meteorology, and VOCs (e.g., statistical methods and data quality control and assurance), to ensure the quality of the monitoring data.
6. Conclusions and recommendations
The design of an ozone precursors monitoring network took into account the existing infrastructure of the Mexico City SIMAT to reduce operating costs, where only the monitoring capacity will be increased to create the network.
In general, the US-EPA method for PAMS can be applied to cities with severe ozone pollution that require ozone precursor monitoring sites. Starting from this exercise, it is recommended that each city, depending on its budget, infrastructure, and information adapts the method to reduce costs and obtain the greatest amount of information and that each city installs at least T2 and T3 monitoring stations for measuring ozone and its precursors. For example, a T3 station may be one that historically has recorded the highest levels of ozone, thereby ensuring that the site represents the zone of maximum ozone concentration. The selection of a T2 site is more complex and it is suggested that the steps described above be followed.
The usefulness and quality of the information generated by this network will depend on the operation, calibration, and maintenance of the monitoring equipment, as well as the technical staff training, periodic validation of data, complete information regarding the data quality control, financial resources necessary for the continuous operation of equipment, and temporal distribution of information to the scientific community and decision makers. Therefore, if a network of this type is installed, it is critical that all of these factors should be considered to ensure the success of the monitoring system. Otherwise, the investment will not yield returns for the design of environmental policies and the monitoring objectives will not be achieved.
This study constitutes the first effort to establish a PAMS network in Mexico City, and the method may be replicated in other cities with similar conditions and similar problems of atmospheric pollution.

