


Servicios Personalizados
Revista
Articulo
 Inglés (pdf)
 Artículo en XML
 Referencias del artículo
 Enviar artículo por email
Indicadores
-
 Citado por SciELO
 -
 Accesos
Links relacionados
-
 Similares en
SciELO
Similares en
SciELO
Compartir

 Permalink
Atmósfera
versión impresa ISSN 0187-6236
Atmósfera vol.28 no.4 Ciudad de México oct. 2015
Dust emission from different soil types in the northwest and the Indo-Gangetic Plains of India
Nirmala D. Desouza
Department of Physics, Maulana Azad National Institute of Technology, Bhopal, India
Corresponding author; e-mail: nirmala_devidas@yahoo.co.in
D. Blaise
Department of Soil Physics, Indian Institute of Soil Science, Nabi Bagh, Bhopal, India; Central Institute for Cotton Research, Nagpur, India
Rajnish Kurchania and M. S. Qureshi
Department of Physics, Maulana Azad National Institute of Technology, Bhopal, India
Received: March 9, 2015; accepted: August 4, 2015
Resumen
La emisión de polvo es una de las principales fuentes de aerosoles atmosféricos y es altamente sensible a la velocidad del viento. Las características de la superficie, las propiedades del suelo y los parámetros meteorológicos también influyen en la emisión de polvo. Hasta ahora ningún estudio ha analizado la presencia de polvo sobre el subcontinente indio. Por tal motivo se calculó el flujo de polvo por medio de ecuaciones empíricas y datos de la cubierta terrestre para siete localidades en el noroeste de la India y la llanura Indo-Gangética (IGP, por sus siglas en inglés) que poseen tipos de suelo diferentes. El presente estudio indica la existencia de diferencias en el flujo de polvo entre las localidades estudiadas. En el noroeste, la emisión de polvo inició a una velocidad de fricción de 0.23 a 0.27 m s-1 y su flujo fue menor al registrado en la IGP, donde la emisión inició a una velocidad de fricción de 0.22 a 0.35 m s-1. El flujo de polvo varió de 0.073 a 0.084 kg m-1 s-1 a una velocidad de fricción específica (0.6 m s-1). Se observó que a velocidades de fricción bajas, el flujo de polvo fue escaso en localidades con alto contenido de arcilla (> 20%) y suelos arenosos en comparación con suelos franco arenosos y franco limosos. A mayores velocidades de fricción se observó una tendencia opuesta. El estudio muestra con claridad el efecto de la textura del suelo en la emisión de polvo.
Abstract
Dust emission is a main source of aerosol in the atmosphere and is highly sensitive to wind velocity. Surface feature characteristics, soil properties and meteorological parameters also influence dust emission. Thus far, no study has referred to dust flux over the Indian subcontinent; therefore, we estimated dust flux using empirical equations and land cover data for seven locations in the northwest and the Indo-Gangetic Plains (IGP) having different soil types. Our study indicates differences in dust flux among locations. In the northwest, dust emission was initiated at a friction velocity of 0.23 to 0.27 m s-1 and dust flux was lesser than the IGP. In the IGP, dust emission was initiated at a friction velocity ranging from 0.22 to 0. 35 m s-1. Dust flux ranged from 0.073 to 0.084 kg m-1 s-1 at a given friction velocity (0.6 m s-1). It was observed that at low friction velocity, dust flux was low at locations with high clay content (> 20%) and sandy soils, compared to sandy loam and silt loam soil types. A reverse trend was observed at a higher friction velocity. Our study clearly indicates the effect of soil texture in dust emission.
Keywords: Dust emission, friction velocity, surface roughness, wind speed.
1. Introduction
Dust storms due to dust emissions are a common phenomenon over many parts of the world and their environmental impact has been increasingly recognized (Choobari et al., 2014). Dust particles transported in the Earth's atmosphere have strong effects on air quality, human health, soil formation, ground water quality, crop growth and, more broadly, local and global climate. A very fine fraction of soil-derived dust has a significant forcing effect on the radiative budget (Tegen and Lacis, 1996; Forster et al., 2007; DeMott et al., 2010). Like arid regions, semi-arid regions face the problem of wind erosion and experience dust storms (Desouza et al., 2013).
Wind erosion leading to dust emission results from the impact of high wind speed on different types of soil surfaces. The impact of dust storms due to wind erosion can be evaluated by determining the dust concentration. This can be done by modeling dust emissions over different types of soils in arid and semi arid regions of the world. The development of the dust emission model requires pertinent datasets of meteorological and soil characteristics. For the last decade, input databases have been developed alongside to the advancements of explicit dust emission models. For continental scale applications, the development and the use of accurate databases (surface, soil, and meteorology) are prerequisites to model mineral dust correctly (Laurent et al., 2010).
Within the deserts there are certain regions called as "hot spots" of dust production which can emit large amounts of dust. One among them is the Thar Desert, which is considered as the preferential source area (Ginoux et al., 2001; Tegen et al., 2002). The Thar Desert situated in the northwest of India occupies an area greater than 20 million hectares. This region has very little vegetal cover due to its arid nature. In this part of the world, wind erosion is a serious problem because strong winds greater than 10 km h-1 are common during the months of April to July. Wind speeds greater than 30 to 50 km h-1 are also experienced. These strong winds cause dust storms and occasionally sandstorms leading to severe wind erosion and further land degradation (Santra et al., 2006). The region of Thar Desert adjoins the fertile belt of the northern Indo-Gangetic Plains (IGP) of north India. The westerly winds transport sand and dust from the Thar Desert to the IGP during the pre-monsoon season (Gautam et al., 2011).
Thus far, numerous studies conducted on dust storms in the Indian subcontinent were related to the radiative and optical properties of dust (Tripathi et al., 2005; Mishra and Tripathi, 2008; Kaskaoutis et al., 2012; Tiwari and Singh, 2013). However, none of these studies for the Indian subcontinent reported about dust flux and emission efficiency. Therefore, the process of dust emission over India needs to be explored. Identification of dust emitting sources will enable us to focus on significant dust emitting regions over India and to characterize the dust emitting rates in response to environmental conditions. With such knowledge we will be better able to improve global dust models. Further, this data can be used as an input in dust emission models that would improve accuracy in predicting dust storms globally. Application of complex emission schemes in global and regional models is hampered by lack of required input data at scales of application as well as the inaccuracies of the driving meteorological and climate models (Gillette et al., 1974; Alfaro et al., 1997). Currently, theoretical knowledge predicts the vertical dust flux in models if the required input parameters are accurately determined (Laurent et al. , 2010). The main objective of this paper was to investigate the role of soil particle size and texture and to study the IGP. We used a dust emission scheme that makes use of particle density, air density, friction Reynolds number, and friction velocity to obtain the threshold friction velocity and finally compute the horizontal dust flux.
2. Methodology
2.1 Study site
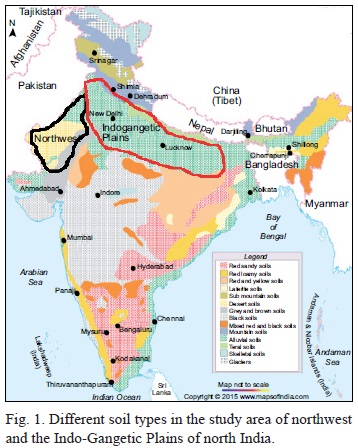
The northwest and the IGP in north India were included in the study area (Fig. 1). In the northwest we studied three locations, namely Jaisalmer, Bikaner, and Jaipur, which are in close proximity to the Thar Desert and have the maximum dust activity. Four locations (the most populated cities) were selected in the IGP, namely Patiala, New Delhi, Kanpur, and Gwalior. The IGP serves as a good source of aerosols as it is surrounded by aerosol emitting sources (like dry riverbeds), making it a hot spot for aerosol research (Tripathi et al., 2005; Mishra and Tripathi, 2008; Kaskaoutis et al., 2012). The entire northwestern region is arid and hot. Jaisalmer receives an annual rainfall less than 200 mm. Bikaner has a mean annual rainfall ranging from 200 to 300 mm, while Jaipur receives about 450 to 600 mm rainfall annually. These areas are abundant with sandy soil types interspersed with dunes. The IGP has soils predominantly of alluvial origin. Patiala has a dry and hot summer and cold winters. New Delhi lies along the bed of the river Yamuna with an annual rainfall of approximately 675 mm. Kanpur receives approximately 850 mm of annual rainfall and lies close to the riverbed of the River Ganges. Gwalior lies to the south of New Delhi on the banks of River Chambal with an annual rainfall of 970 mm. Most of the rainfall at all these locations is received from end of June to September. The global land cover map obtained from Kim et al. (2013) shows bare ground over northwestern India, shrubs, bare ground and cultivated crops over north India and the IGP (Fig. 2). Also the source function map, which represents the probability of dust uplift, showed a value nearly equal to unity over the great Indian Thar Desert, manifesting its importance as a good dust emitting source.

2.2. Soil sample collection and analysis
Surface soil samples (0-0.15 m) were collected from three spots close to the India Meteorological Department observatory. Soil samples were air-dried before the texture analysis, which was done by determining the percentage of sand, silt and clay in a given soil following the pipette method outlined by Gee and Bauder (1986). Based on the particle size distribution, soils were classified using the USDA soil texture triangle chart.
2.3. Data used
As wind is the only driving force for dust emission to occur, the study of dust emission requires the knowledge of 10 m wind speed, the threshold velocity of wind erosion, and finally the surface condition under which the dust emission takes place (Kim et al., 2013). Wind speed at 10 m height was obtained from www.wunderground.com. These data sets are often assimilated into numerical weather prediction models that produce gridded and even simulated weather forecasts, which may be for hours or days. Data corresponding to the pre-monsoon season for the period 2005-2013 was used.
2.4 Dust emission
The methodology followed in this work is based on previous dust emission schemes for regional (Marticorena et al., 1997; Perez et al., 2006) and global modeling systems (Tegen et al., 2002). An important factor in dust emission is wind velocity. When wind velocity exceeds a certain threshold, dust emission takes place. This wind friction velocity is called threshold friction velocity. The empirical equations derived and analyzed by Marticorena et al. (1997) based on formulations of Iversen and White (1982) were used to calculate the threshold friction velocity (u*th). Formula (1) is used for the situation where 0.03 < B < 10, whereas for the situation where B > 10, formula (2) is used.

where

where B is the friction Reynolds number, Dp is the diameter of the soil particle, pp is the particle density, pα is the air density, and g the acceleration due to gravity.
The expression for fluid saltation threshold due to the presence of soil moisture, derived by Fecan et al. (1999) for all soil types, is given in Eqs. 3 and 4.

where u *wt and u *ft are respectively the fluid saltation thresholds in the presence and absence of moisture; and w is the soils' volumetric water content in percent.
The amount of water that can be adsorbed onto the soil is a function of the clay content. Fecan et al. (1999) obtained the expression for water adsorption using the soil clay content given in Eq. 5.

where cs is the soil clay content in percent.
2.5. Dust emission efficiency
To determine the dust emission efficiency (α) and mass of suspended particles with diameter less than 20 μm we used the horizontal and vertical flux of particles mobilized at the soil surface (Marticorena and Bergametti, 1995). The vertical dust flux (F) corresponds to the mass of suspended particles with diameter less than 20 μm passing through a surface parallel to the soil (Sabre et al., 2007). The horizontal flux (H) corresponds to the total mass of materials transported in saltation movement. According to Shao et al. (1993) the ratio of vertical dust flux to horizontal dust flux (i.e., F/H = α), provides the efficiency of dust emission or soil bombardment.
The expression for horizontal dust flux (White, 1979) is as follows:

where, u* is the friction velocity, pα is the density of air, u *th is the threshold friction velocity, and g is the gravitational constant.
According to Marticorena and Bergametti (1995) and Shao et al. (1993), the expression for vertical dust flux is given in Eq. (7):

where C = 2.78, δ is the source function, H is the horizontal dust flux, and α is the horizontal to vertical flux ratio, which is called efficiency of the dust release processes using Eq. (8):

Eq. (8) is valid for soils with clay percentage up to 20%. For soils with clay content > 20%, sandblasting efficiency is set constant to values proposed by Tegen et al. (2002).
Understanding the minimum value of the threshold is very important in dust emission physics. Dust aerosols are only rarely lifted by wind (Loosmore and Hunt, 2000); indeed, they are predominantly emitted by the impact of saltating particles on the soil surface (Gillette et al., 1974).
3. Results and discussion
3.1. Topography
Topographic features of the surface are useful in determining the global distribution of dust sources (Ginoux et al., 2001). Figure 1 indicates that the northwest and the IGP are associated with aeolian and alluvial soils, respectively, which are readily erodible (Sharda et al., 2013). These regions, therefore, can be associated with lows that have a deep accumulation of alluvial sediments (Ginoux et al., 2001). The sediments are composed of fine particles, which can be easily eroded by winds. Thus, physiochemical properties of surface soil have a significant influence on the occurrence and development of wind erosion leading to dust emission in the study area. Apart from this, another study conducted by Kim et al. (2013) showed that the topographical depression is high over the Thar Desert, parts of north India and the IGP (Fig. 2). Thus the probability of dust lift would be higher over these regions.
3.2. Soil texture and dust emission
Dust emission as a result of wind erosion is related to regional geological environments and is affected by soil texture (Abuduwaili and Mu, 2002). Due to differences in soil texture, we observed spatial heterogeneity in dust flux and dust emission efficiency. Soil texture of the different regions under study is given in Table I.
The soils of Bikaner and Jaisalmer are sandy in nature and interspersed with interdunes while those of Jaipur are loamy sands. Thus, these soils provide low dust flux values. On the other hand, in the IGP region, sandy loam to fine sandy loam and fine silty loam soil types are predominant (Murthy et al., 1982). Some locations such as Patiala and Gwalior have soils containing more than 20% clay. At Patiala, clay content was greater than 60% in the clayey soils. These soil types occur, besides the fine silty loam soils. Therefore, areas with greater clay content will have low dust flux and emission efficiency than locations with lower clay content.
3.3. Soil moisture and dust emission
Apart from the percentage of sand, silt and clay, soil moisture content is also an important factor that affects soil erosion and dust emission. If the soil is moist, the viscosity of soil would increase and aggregation between soil particles will also increase. Accordingly, threshold friction velocity, windblown sand speed, and sand and dust particle transport rate would be altered (Fecan et al., 1999; Dong et al., 2002). The maximum amount of adsorbed water ω' as a function of increasing amount of clay is given in Table I. In the northwest regions of India, the least amount of soil-adsorbed water can be found over the locations of Jaisalmer and Bikaner, since the clay content there is < 10% and has more coarse particles. The amount of water adsorbed over Jaipur is the highest because the soils had average clay content of 17.5%. Water adsorption is governed by electrostatic interactions of the mineral surface with the polar water molecules. Since sandy soils generally contain lower density of net electric charges substantially less water is adsorbed compared to clayey soils (Hillel, 1980). Since water adsorbs more readily onto clay soils (Hillel, 1980), the volumetric fraction of water that soil can adsorb before capillary forces (ω') become substantial increases with an increase in clay content as is evident from data in Table I. For these soils the dominant dust production process is not saltation but abrasion. In sandy soils, presence of soil moisture creates substantial inter-particle forces that inhibit the initiation of saltation (Chepil, 1956; Pye, 1987). When relative humidity is low (< 65%), inter-particle forces are produced primarily by bonding of adjacent adsorbed water layers, whereas for high relative humidity (> 65%) this occurs primarily through the formation of water wedges around points of contact (capillary forces) (Hillel, 1980; Ravi et al., 2006). Water bridges form in sandy soils with low soil moisture contents compared to soils having greater amounts of clay, thereby producing substantial capillary force (Belly, 1964). From this data, we expect that dust emission efficiency would be lowest at locations containing high clay content such as Gwalior and Patialaclay because of strong cohesive forces, compared to other locations where sandy to sandy loam and silt loam soils are present.
3.4. Threshold friction velocity and horizontal dust flux
We observed spatial heterogeneity for the threshold friction velocity over the northwest and north of the IGP. Further, surface roughness varied over this region. A change from rough to smooth usually increases the surface factional stress consequently leading to a weakening of wind at the surface. The surface roughness map (Fig. 3) shows that the surface is smooth over the great Indian Thar Desert as the surface roughness values are very low (Prigent et al., 2005; Cheng et al., 2008). Also, the value of surface roughness over most parts of the locations in northwest India (Jaisalmer, Bikaner and Jaipur) ranges from 0.001 to 0.01. The value of surface roughness over New Delhi and its adjoining regions varies from 0.03 to 0.06. This change in surface roughness from the Thar Desert towards New Delhi leads to a weakening of winds at the surface.
Fig. 4. Bikaner is similar to Jaisalmer; however, the soils of Bikaner consist of more fine sand particles than those over Jaisalmer, where they are coarse in nature. Similarly, Jaipur has a larger proportion of fine-sized soil particles and clay content than those for Bikaner and Jaisalmer. Thus the threshold friction velocity is relatively smaller at Jaipur and Bikaner as compared to Jaisalmer.
Threshold friction velocity in the IGP was lower than over the northwest India because these locations contained more fine soil particles. The threshold friction velocity at which dust emission was initiated ranged from 0.21 to 0.35 m s-1 (Fig. 5). At Patiala, with clay soil types, threshold friction velocity was the highest and dust emission was initiated at a friction velocity of 0.35 m s-1 (Fig. 5a). On the other hand, at the same location where silty loam soil types were present, the threshold friction velocity was 0.26 m s-1. Dust emission was initiated at a threshold friction velocity of0.23, 0.22 and 0.21 m s-1 for New Delhi, Kanpur and Gwalior, respectively (Fig. 5 b, c, d). Our results are in accordance with the experimental data of Bagnold (1941), Chepil (1945) and Marticorena et al. (1997), thus confirming that threshold friction velocity is size dependent. We too observed a decrease in threshold friction velocity with a decrease in average soil particle diameter up to 71.1 μm, followed by an increase with a further decrease in particle size in clay soil types. This is because inter-particle cohesion forces are stronger in soils containing a greater fraction of very fine soil particles (Iversen et al., 1976). The values of threshold friction velocity reported in this study in the desert areas are similar to those reported for the Tak-limakan Desert in China, which has a predominance of sand and low vegetation cover (Yang et al, 2011). Threshold friction velocities reported in this study for the IGP, where most of the land is under farming, has slightly lower values than those reported in China and elsewhere (Wang et al., 2007). These differences may be due to the fact that in summer (April to June) the land in this part of the world is bare with very little vegetative cover. Cultivation begins soon after the monsoon rains are received by the end of June.

The horizontal dust flux over Jaisalmer and Bikan-er at a friction velocity of 0.6 m s-1 was 0.082 and 0.083 kg m-1 s-1, respectively (Fig. 4a, b). At Patiala, in the IGP, horizontal dust flux was 0.073 and 0.082 kg m-1 s-1 for clay and silt loam soil types, respectively (Fig. 5a). Values of dust flux were similar for the other locations in the IGP (0.083 to 0.084 kg m-1 s-1) (Fig. 5b, c, d). However, at a higher friction velocity (1 m s-1), horizontal dust flux was highest at Patiala with clay soil types and at Jaisalmer with sandy soils (0.39 kg m-1 s-1). In general, the northwest had higher horizontal dust flux (0.382 to 0.387 kg m-1 s-1) than the IGP (0.38 kg m-1 s-1). Because of differences in surface roughness, soil texture, and threshold friction velocity, horizontal dust flux varied across locations.
Dust emission efficiency is a ratio of horizontal to vertical flux and is a function of friction velocity. Dust release efficiency over various locations is given in Table II. Dust emission efficiency was similar across locations in north and northwest India, except for Patialaclay (Table II), which has clay content in excess of 60%; therefore, soil cohesion is stronger than in the arid regions of northwest and other parts of the IGP.

The estimation of horizontal dust flux and dust emission efficiency done in this study by using empirical equations has regional limitations. We employed climatological land cover data. The time variation of surface roughness was not taken into account in calculating dust emission. Such an approach may be inadequate where time variation of land cover change is significant and may cause significant errors in estimating dust emission. This is a possibility for the IGP. However, we believe this approach is adequate because there is little vegetal cover in permanent desert location areas such as the Thar Desert. Furthermore, even the IGP has very little vegetal cover from the harvest of the main crop wheat in April until the onset of the monsoon.
4. Conclusions
We estimated horizontal dust flux and dust emission efficiency for seven locations, three in the northwest (Jaisalmer, Bikaner and Jaipur) and four in the IGP of north India (Patiala, New Delhi, Kanpur and Gwali-or), using empirical equations and land cover data. From our study, we conclude that surface roughness increases from the northwest parts of India (Thar Desert) towards New Delhi. Further, threshold friction velocity was higher over Jaisalmer and Bikaner than in the IGP. Dust emission was initiated at a threshold friction velocity of 0.27 and 0.24 m s-1, respectively, compared to 0.21 to 0.35 m s-1 in the IGP. The northwest regions close to the Thar Desert have coarse soil particles. Therefore, the threshold friction velocity at which dust emission was initiated was higher than in the IGP. Horizontal dust flux was low over Jaisalmer and Bikaner at lower values of friction velocity than those found in the IGP. But the trend was opposite at a higher friction velocity. The regions of the IGP (Patiala, New Delhi and Kanpur) had relatively higher dust flux because of the greater clay content found in their sandy loam and silt loam soil types, as compared to those at Jaisalmer and Bikaner. However, where clay content exceeded 20%, (Patialaclay and Gwalior), horizontal dust flux and emission efficiency were low. Future studies are needed to validate horizontal dust flux on a real time basis. Further, this region encompasses a wide variety of soil types, therefore their influence on vertical dust flux needs to be estimated.
Acknowledgements
We acknowledge with gratitude Weather Wunder-ground (http://www.wunderground.com) for making available weather data and NASA for the images that were used in the study.
References
Abuduwaili J. and G. J. Mu, 2002. Analysis on the dust storms and their disasters in the lakebed regions of Ebinur lake, Xinjiang. Arid Land Geogr. 25, 149-154. [ Links ]
Alfaro S. C., A. Gaudichet, L. Gomes and M. Maile, 1997. Modelling the size distribution of a soil-aerosol produced by sandblasting. J. Geophys. Res. 102,11239-11249. [ Links ]
Bagnold R. A., 1941. The physics of blown sand and desert dunes. Methuca, New York, 265 pp. [ Links ]
Belly P. Y., 1964. Sand movement by wind. Technical Memorandum No. 1. U. S. Army Coast Engineering Research Centre, Washington, D.C., 84 pp. [ Links ]
Cheng T., Y. Peng, J. Feichter and I. Tegen, 2008. An improvement on the dust emission scheme in the global aerosol-climate model ECHAM5-HAM. Atmos. Chem. Phys. 8, 1105-1117. [ Links ]
Chepil W. S., 1945. Dynamics of wind erosion. Soil Sci. 60, 305-320. [ Links ]
Chepil W. S. 1956. Influence of moisture on erodibility of soil by wind. Soil Sci. Soc. America Proc. 20, 288-292. [ Links ]
Choobari O. A., P. Zawar-Reza and A. Sturman, 2014. The global distribution of mineral dust and its impacts on the climate system: A review. Atmos. Res. 138, 152-165. [ Links ]
DeMott P. J., A. J. Prenni, X. Liu, S. M. Kreidenweis, M. D. Petters, C. H. Twohy, M. S. Richardson, T. Eidhammer and D. C. Rogers, 2010. Predicting the global ice nuclei distributions and their impacts on climate. Proc. Natl. Acad. Sci. 107, 11217-11222. [ Links ]
Desouza N. D., R. Kurchania and M. S. Qureshi, 2013. Initiation of a convective dust storm over north India on 21 April 2010 inferred using satellite data. Meteorol. Atmos. Phys. 122, 47-54. [ Links ]
Dong Z. B., X. Liu and H. Wang, 2002. The flux profile of a blowing sand cloud: A wind tunnel investigation. Geomorphology 49, 219-230. [ Links ]
Fecan F., B. Marticorena and G. Bergametti 1999. Parameterization of the increase of the aeolian erosion threshold wind friction velocity due to soil moisture for arid and semi arid areas. Ann. Geophys. 17, 149-157. [ Links ]
Forster P., V. Ramasamy, P. Artaxo, T. Berntsen, R. Betts, D. W. Fahey, J. Haywood, J. Lean, D. C. Lowe, G. Myhre, J. Nganga, R. Prinn, G. Raga, M. Shulz, R. van Dorland, 2007. Changes in atmospheric constituents and in radiative forcing. In: Climate change 2007: The Physical Science Basis (S. Solomon, D. Qin, M. Manning, Z. Chen, M. Marquis, K. B. Averyt, M. Tignor and H. L. Miller, Eds.). Cambridge, U.K., 131-234. [ Links ]
Gautam R., N. C. Hsu, S. C. Tsay, K. M. Lau, B. Holben, S. Bell, A. Smirnov, C. Li, R. Hansell, Q. Ji, S. Payra, D. Aryal, R. Kayastha, K.M. Kim, 2011. Accumulation of aerosols over the Indo-Gangetic plains and southern slopes of the Himalayas: distribution, properties and radiative effects during the 2009 pre-monsoon season. Atmos. Chem. Phys. 11, 12841-12863. [ Links ]
Gee G. W. and J. W. Bauder, 1986. Particle-size analysis. In: Methods of soil analysis. Part 1. Physical and mineralogical methods (A. Klute, Ed.). Agronomy Monograph No. 9. American Society of Agronomy/Soil Science Society of America, Madison, WI, 383-411. [ Links ]
Gillette D. A., Blifford I. H. Jr. and D. W. Fryrear, 1974. The effect of wind velocity on size distribution of aerosols generated by wind erosion on soils. J. Geophys. Res. 79, 4068-4075. [ Links ]
Ginoux P., M. Chin, I. Tegen, J. M. Prospero, B. Holben, O. Dubovik and S. J. Lin, 2001. Sources and distributions of dust aerosols simulated with the GOCART model. J. Geophys. Res. 106, 20255-20273. [ Links ]
Hillel D., 1980. Fundamentals of soil physics. Academic Press, London, 771. pp. [ Links ]
Iversen J. D., J. B. Pollack, R. Greeley, B. R. White, 1976. Saltation threshold on Mars: The effect on inter-particle force, surface roughness, and low atmospheric density. Icarus 29, 381-393. [ Links ]
Iversen J. D. and B. R. White, 1982. Saltation threshold on Earth, Mars and Venus. Sedimentology 29, 111-119. [ Links ]
Kaskaoutis D. G., R. P. Singh, R. Gautam, M. Sharma, P. G. Kosmopoulos and S. N. Tripathi, 2012. Variability and trends of aerosol properties over Kanpur, northern India using AERONET data (2001-10). Envtl. Sci. Lett. 7, 1-9. [ Links ]
Kim D., M. Chin, H. Bian, Q. Tan, M. E. Brown, T. Zheng, R. You, T. Diehl, P. Ginoux and T. Kucsera, 2013. The effect of the dynamic surface bareness on dust source function, emission and distribution. J. Geophys. Res. 118, 1-16. [ Links ]
Laurent B., I. Tegen, B. Heinold, K. Schepanski, B. Weinzierl, M. Esselbom, 2010. A model study of Saharan dust emissions and distributions during the SAMUM-1 campaign. J. Geophys. Res. 115, doi:10.1029/2009JD012995. [ Links ]
Loosmore G. A. and J. R. Hunt, 2000. Dust resuspension without saltation. J. Geophys. Res. 105, 20663-20671. [ Links ]
Marticorena B. and G. Bergametti, 1995. Modeling the atmospheric dust cycle: 1- Design of soil derived dust production scheme. J. Geophys. Res. 100, 16415-16430. [ Links ]
Marticorena B., G. Bergametti, B. Aumont, Y. Callot, C. N'Doume, M. Legrand, 1997. Modelling the atmospheric dust cycle: 2. Simulations of Saharan dust sources. J. Geophys. Res. 102, 4387-4404. [ Links ]
Mishra S. K. and S. N. Tripathi, 2008. Modelling optical properties of mineral dust over India desert. J. Geophys. Res. 113, doi:10.1029/2008JD010048. [ Links ]
Murthy R. S., L. R. Hirekerur, S. B. Deshpande and B. V. Venkata Rao, 1982. Description and classification of benchmark soils. In: Benchmark soils of India: Morphology, characteristics and classification for resource management (R. S. Murthy, L. R. Hirekerur, S. B. Deshpande, B. V. Venkata Rao and H. S. Shankaranarayana, Eds.). NBSS & LUP, Nagpur, 105-374. [ Links ]
Perez C., S. Nickovic, G. Pejanovic, J. M. Baldasano and E. Ozsoy, 2006. Interactive dust-radiation modeling: A step to improve weather forecasts. J. Geophys. Res. 111, doi:10.1029/2005JD006717. [ Links ]
Prigent C., I. Tegen, F. Aires, B. Marticorena, and M. Zribi, 2005. Estimation of the aerodynamic roughness length in arid and semiarid regions over the globe with the ERS scatterometer. J. Geophys. Res. 110, doi:10.1029/2004JD005370. [ Links ]
Prospero J. M., P. Ginoux, O. Torres, S. E. Nicholson and T. E. Gill, 2002. Environmental characterization of global sources of atmospheric dust derived from the NIMBUS7 TOMS absorbing aerosol product. Rev. Geophys. 40, 1-31. [ Links ]
Pye K., 1987. Aeolian dust and dust deposits. Academic Press, New York. 334 pp. [ Links ]
Ravi S., T. M. Zobeck, T. M. Over, G. S. Okin and P. D'Odorico, 2006. On effect of moisture bonding forces in air-dry soils on threshold friction velocity of wind erosion. Sedimentology 53, 597-609. [ Links ]
Sabre M., M. V Lopez, S. C. Alfaro, J. L. Rajot, L. Gomes, 2007. Characterization of the fine dust particle product process by wind erosion for two types of bare soil surfaces. In: Wind erosion - An international symposium (E. L. Skidmore and J. Tatarko, Eds.). USDA-ARS Wind Erosion Research Unit, 11. [ Links ]
Santra P., P. S. Mertia and P. Narain, 2006. Land degradation through wind erosion in Thar Desert - Issues and research priorities. Indian J. Soil Conserv. 34, 214-220. [ Links ]
Shao Y., M. R. Raupach and P. A. Findlater, 1993. Effect of saltation bombardment on the entrainment of dust by wind. J. Geophys. Res. 98, 12719-12726. [ Links ]
Sharda V. N., D. Mandal and P. R. Ojasvi, 2013. Identification of soil erosion risk areas for conservation planning in different states of India. J. Envtl. Biol. 34, 219-226. [ Links ]
Tegen I., S. P.Harrison, K. Kohfeld, C. Prentice, M. Coe and M. Heimann, 2002. The impact of vegetation and preferential source areas on global dust aerosols: Results from a model study. J. Geophys. Res. 107, 4576-4597. [ Links ]
Tegen I. and A. A. Lacis, 1996. Modelling of dust particle size distribution and its influence on radiative properties of mineral dust aerosol. J. Geophys. Res. 101, 19237-19244. [ Links ]
Tiwari S. and A. K. Singh, 2013. Variability of aerosol parameters derived from ground and satellite measurements over Varanasi located in the Indo-Gangetic Basin. Aerosol Air Qual. Res. 13, 627-638. [ Links ]
Tripathi S. N., S. A. Dey, S. Chandel, S. Srivastava, R. P. Singh and B. Holben, 2005. Comparison of MODIS and AERONET derived aerosol optical depth over the Ganga basin, India. Ann. Geophys. 23, 1093-1101. [ Links ]
Wang P. X., L. D. Sun, P. Yue and S.J. Niu, 2007. Features of dust aerosol transportation during sandstorms over Yanchi area of Ninxia Autonomous region. J. Desert Res. 27, 1077-1079. [ Links ]
White B. R., 1979. Soil transport by winds on Mars. J. Geophys. Res. 84, 4643-4651. [ Links ]
Yang X. H., X. L. Xu, Q. He, A. Mamtimim, B. Yu and S. H. Tang, 2011. Sand flux estimation during a sand-dust storm at Tazhong area of Taklimakan Desert, China. J. Arid Land 3, 199-205. [ Links ]

