


Servicios Personalizados
Revista
Articulo
 Inglés (pdf)
 Artículo en XML
 Referencias del artículo
 Enviar artículo por email
Indicadores
-
 Citado por SciELO
 -
 Accesos
Links relacionados
-
 Similares en
SciELO
Similares en
SciELO
Compartir

 Permalink
Atmósfera
versión impresa ISSN 0187-6236
Atmósfera vol.28 no.1 Ciudad de México ene. 2015
Characterization and source identification of VOC species in Bogotá, Colombia
Juan Felipe Franco and José Pacheco
Grupo de Estudios en Sostenibilidad Urbana y Regional (SUR), Facultad de Ingeniería, Universidad de los Andes, Carrera 1 Este 19A-40, Bogotá, Colombia. Corresponding author: J. F. Franco; e-mail: jffranco@uniandes.edu.co.
Luis Carlos Belalcázar
Departamento de Ingeniería Química y Ambiental, Universidad Nacional de Colombia, DC 111321 Bogotá, Colombia
Eduardo Behrentz
Grupo de Estudios en Sostenibilidad Urbana y Regional (SUR), Facultad de Ingeniería, Universidad de los Andes, Carrera 1 Este 19A-40, Bogotá, Colombia
Received May 7, 2014; accepted October 2, 2014
RESUMEN
En este trabajo se caracterizan compuestos orgánicos volátiles (VOC, por sus siglas en inglés) en aire ambiente en tres sitios de monitoreo ubicados en el perímetro urbano de Bogotá, Colombia. Se realizaron mediciones en línea de VOC con una resolución temporal de 30 min utilizando un cromatógrafo portátil Synstech Spectras. Las concentraciones medias de VOC fueron más altas en los dos sitios de muestreo, que se distinguen por sus actividades industriales y comerciales, así como por contar con una alta actividad vehicular. Los análisis del comportamiento diurno de los VOC mostraron que las concentraciones tienden a ser mayores durante la mañana (alrededor de las 8:00 a.m.) y la noche (alrededor de las 10:00 p.m.). Estas tendencias sugieren la influencia del tráfico vehicular en los niveles de los VOC en las inmediaciones de los sitios de medición. De acuerdo con los resultados obtenidos, los alcanos son los hidrocarburos más abundantes en el aire ambiente de Bogotá (cerca de 80% del total de VOC), en tanto que los alquenos representan únicamente 15% del total de VOC. Se calculó el potencial de formación de ozono (OFP, por sus siglas en inglés) utilizando el concepto de máxima reactividad incremental (MIR, por sus siglas en inglés) y se evaluó el papel de cada VOC en la formación de O3. Estos resultados muestran que el eteno, el propeno, el n-butano, el i-pentano y el isopreno son las especies con mayor OFP (resultando que las altas concentraciones no necesariamente están asociadas a mayor potencial para la producción de O3). Finalmente, se hizo un análisis de componentes principales para identificar las fuentes de los principales VOC. Los resultados muestran que la mayoría de los compuestos incluidos en este estudio proceden del tráfico vehicular. La modelación de receptores también muestra que los cinco principales compuestos en términos de producción de O3 proceden primordialmente de los tubos de escape de vehículos a gasolina.
ABSTRACT
In this article, volatile organic compounds (VOC) were characterized in ambient air at three different monitoring sites within the urban perimeter of Bogotá, Colombia. On-line VOC measurements were conducted using a Synstech Spectras portable gas chromatograph with a temporal resolution of 30 min. Average VOC concentrations were higher at two of the sampling sites, which are characterized by intensive industrial and commercial activities, and high vehicular activity. Analyses of the diurnal behavior of total VOC showed that concentrations tend to be higher in the morning (at around 8:00 LT) and during the evening (around 22:00 LT). Such trends suggest the influence of road traffic activity in the surroundings of the measuring sites on VOC levels. According to our results, alkanes are the most abundant hydrocarbons in the ambient air in Bogotá (about 80% of the total VOC), while alkenes represent only 15% of the total VOC. We computed the ozone formation potential (OFP) using the maximum incremental reactivity (MIR) concept and evaluated the role of each VOC in the O3 formation. These results show that ethene, propene, n-butane, i-pentane and isoprene are the species with the highest OFP (noting that high concentrations are not necessarily linked with elevated O3 production). Finally, we used principal components analysis to identify the sources of different VOC. Our results showed that most of the compounds included in this study are emitted by road traffic. The receptor modeling also shows that the top-five compounds in terms of O3 production come mainly from the exhaust of gasoline vehicles.
Keywords: Urban air pollution, on-line VOC monitoring, ozone formation potential, source identification.
1. Introduction
Reducing air pollution is considered an environmental challenge in the major cities of the world, mainly in developing countries (Chow et al., 2004), where rapid urbanization has resulted in increasing emissions (Gurjar et al., 2008). Bogotá, the capital of Colombia and one of the largest cities in Latin America, has been ranked as one of the most air-polluted cities in the region (WHO, 2005, 2014; EIU, 2011), primarily because its ambient inhalable particulate matter (PM10) concentrations are well above local and national air quality standards (WMO, 2012). Despite the efforts conducted by local authorities during the last few years, much is yet to be done to better understand the city's air pollution scenario.
While most of the research in Bogotá has been focused on the study of particle-related pollutants, relatively no attention has been given to other contaminants such as volatile organic compounds (VOC). These species are defined as hydrocarbons which vapor pressure at 20 °C is between 0.13 and 101.3 kPa (Hester and Harrison, 1995). VOC are important atmospheric pollutants not only because they affect human health (some of them are carcinogenic), but also because these compounds play a key role in the production of tropospheric O3 and aerosols. As soon as VOC are emitted to the atmosphere, they react with other air pollutants (i.e., nitrogen oxides) to produce tropospheric ozone and aerosols (Carter,2004).
VOC monitoring in ambient air has been usually conducted by analyzing in the laboratory integrated samples manually collected in canisters at different urban environments. Recently, instruments able to identify and quantify online VOC concentrations have been developed. Such instruments are fully automatic portable gas chromatographs. With this sampling and analytical technique it is possible to obtain an important amount of data with a time resolution of minutes.
The identification of emission sources is a key factor in the implementation of effective strategies to control air pollution in an urban center. There are different methodologies to identify emission sources of air pollutants, such as emissions inventories. However, in some cases the required information to build these inventories is insufficient or even inexistent. An alternate approximation is receptor-oriented modeling. Receptor models are mathematical procedures to identify sources of ambient air pollutants and to quantify their impact at a site named receptor, based on concentration measurements at this receptor site. Receptor modeling has also been used as an independent check to evaluate the accuracy of existing emission inventories (Jorquera and Rappenglück, 2004).
Despite the relevance of VOC in the air quality of an urban center, in many cities of the world including Bogotá, VOC concentrations and its emission sources have not been formally evaluated. Within this context, the main objective of this study was to quantify ambient VOC concentrations in Bogotá to understand their impact on ozone formation and to identify their emissions sources by means of the receptor modeling technique. Although this study was carried out between 2008 and 2010, it is still the latest information regarding VOC concentrations in Bogotá.
2. Methods
2.1 Study location and sampling sites
The study was conducted in the urban area of Bogotá (Colombia's capital and largest city), located 2600 masl in the Andes Mountain Range. The city's annual average temperature is 15 °C, with alternate periods of rain and drought. Bogotá exhibits one of the highest population densities in America, with close to 8 000 000 people living in less than 30 000 ha of urbanized land (DANE, 2011). Similar to many cities in the developing world, the majority (60%) of the travels in the city are carried out on public transportation. The economy of Bogotá represents about 25% of the country's gross domestic product (GDP). Even though there is an important number of industrial facilities in different areas of the city, production activities represent less than 10% of Bogotá's GDP (Luna and Behrentz, 2011).
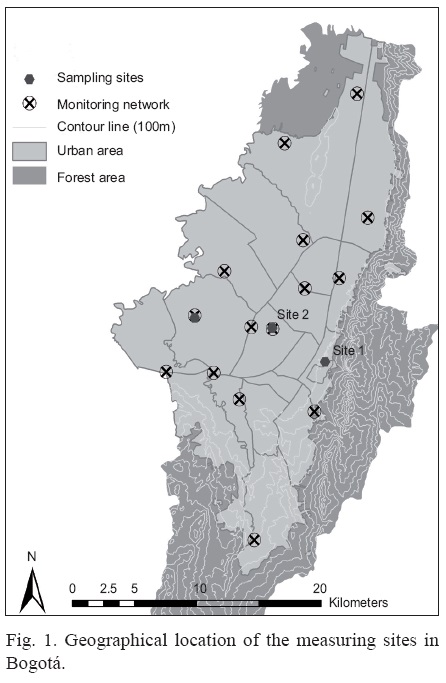
VOC concentrations were characterized at three different monitoring sites. The sampling sites selection was determined by its predominant socio-economic activities as well as the air quality condition of the zones in which those sites were located. In addition, logistic concerns such as equipment's security were considered in the site selection. Figure 1 shows the geographical location of the selected monitoring sites. Sampling site 1 was located at the central-east side of Bogotá. This location corresponds to a low air pollution area of the city. Site 2 was located at the central-west side of the city and it is under the influence of an industrial zone. Site 3 was located at the southwest of Bogotá where commercial activities are predominant. Sites 2 and 3 are considered highly air-polluted areas of the city. Table I presents relevant information about the sampling sites.
2.2 Field campaign
A field monitoring campaign was conducted between November 2008 and July 2009. During this time, 20 different VOC (C2-C6) ambient concentrations were measured online at the three selected sampling sites. VOC measurements were conducted using a continuous portable gas chromatograph (GC) with a 30 min integration time. During the time when the GC was operating, meteorological variables were also measured. Information about ambient concentrations of other pollutants was also collected at sites 2 and 3. Since there was only one GC available for this study, it was only possible to measure VOC concentrations at one place at a time. Days with valid data at each sampling site are shown in Table I. Forty-eight samples were collected per day (each sample corresponds to the 30-min analysis of 20 VOC). The total number of valid samples taken during the whole field camping was over 4000.
2.3 Instrumentation
The identification and quantification of VOC concentrations were conducted using a Synstech Spectras GC955 gas chromatograph (Synspec b.v., Groningen, The Netherlands). This instrument monitors hydrocarbons (C2-C6) concentrations continuously and simultaneously. The equipment measurement technique is based on the operation of two different detectors (a photo-ionization detector [PID] and a flame ionization detector [FID]). The air sample is transported using a carrier gas (nitrogen) through the pre-concentration chamber and then through the stripping and analysis columns. Chromatograms are displayed in real time in the instrument's screen and at the same time they are saved in the GC's internal hard disk. The instrument was installed in a temperature and relative humidity controlled room. At sites 2 and 3 the equipment was placed inside a city's air quality monitoring network station where data for other pollutants concentrations and meteorological data were available. At site 1, meteorological conditions were registered using a Davis Vantage Pro2 Plus station (Davis Instruments Corp, California, USA).
The GC was calibrated according to factory recommendations. A complete calibration was conducted at the beginning of the measurements in each sampling site. Span checks were performed weekly during the measurements. The calibration procedure was carried out using a Scoot Specialty Gases standard mix. Five different points with known concentrations were selected. Each sampling point was run three times so the generated calibration curve had between 15 to 20 points for each of the 20 VOC.
2.4 Data analysis
Once chromatograms were saved in the GC hard disk, a reprocessing procedure was carried out. This operation consisted in checking if concentrations peaks for each compound were located in its corresponding time window on the chromatogram. Information about other pollutant concentrations and meteorological data registered at sampling sites 2 and 3 was provided by the local environmental authority (which is the entity responsible for the operation of the air quality network in Bogotá). These data were also validated. With all the information assembled in the same dataset, we conducted a descriptive statistical analysis and obtained time trends for each variable. Data reprocessing and validation, dataset generation and the regarding data analysis was carried out from July 2009 to June 2010.
2.5 Calculation of the ozone forming potential
We computed the contribution of each individual VOC to the O3 formation by using the maximum incremental reactivity (MIR) scale. The MIR coefficient, developed by Carter (1994), is the amount (in grams) of ozone formed per gram of VOC added to a reference atmosphere. It has been reported in the atmospheric chemistry literature (Seinfeld and Pandis, 2000) that reactions of VOC and NOx in the presence of sunlight are the major source of tropospheric O3. So and Wang (2004) evaluated VOC reactivity with respect to their O3 forming potential, which is defined as follows:
O3 forming potential (j) = concentration (j) x MIR
where concentration (j) → VOC mass concentration j. This equation was used to calculate the O3 forming potential for each VOC measured in this study.
2.6 Source identification
Receptor models are statistical tools that help identifying the sources of pollutants from measurements collected at a receptor site. These techniques have been recently used to identify VOC sources in some cities of the world (Guo et al., 2004; Song et al., 2006; Leuchner and Rappenglück, 2010). In particular, principal components analysis (PCA) is a mathematical and statistical method used to reduce a number of correlated variables into a smaller number of uncorrelated variables called principal components (PC). PCA extracts the PC from an i,j matrix, where i corresponds to the number of samples and j to the number of pollutants measured (correlated variables, in this case all the VOC species measured). The PC extracted corresponds to VOC sources.
The number of PCs that can be extracted from the measurements depends on the variability of the available data and on the number of monitored substances. The first PC extracted includes the highest possible variability, and each succeeding compound accounts for as much as possible of the reminding variability. The number of PCs that can be extracted depends on the retained variance of each PC. A matrix property called eigenvalue is used to standardize the number of PCs that can be extracted. Typically, all the PCs with eigenvalues greater than 1.0 are considered as extracted PCs. In this study, a varimax rotation with Kaiser normalization was applied in order to simplify the interpretation of results. The compounds with more than 70% of their data below the detection limit are also excluded from the modeling. Additionally, for the purpose of this exercise only source identification results for sites 2 and 3 are included.
3. Results
3.1 Ambient VOC concentrations in Bogotá
Table II shows VOC and other pollutants concentrations found at each of the study's sampling sites. Also shown is the total VOC concentration, which corresponds to the sum of concentrations of the measured hydrocarbons in parts per billion of carbon units (ppbC). The comparison of total VOC concentrations at the three sampling sites showed that they were higher at sites 2 and 3 (characterized by intensive industrial and commercial activities with high vehicular traffic). Total VOC concentration at site 2 was 2.5 times higher than at site 1 and 1.5 times higher than at site 3. It is important to note that more than 50% of VOC concentrations at site 1 were below the GC detection limit.
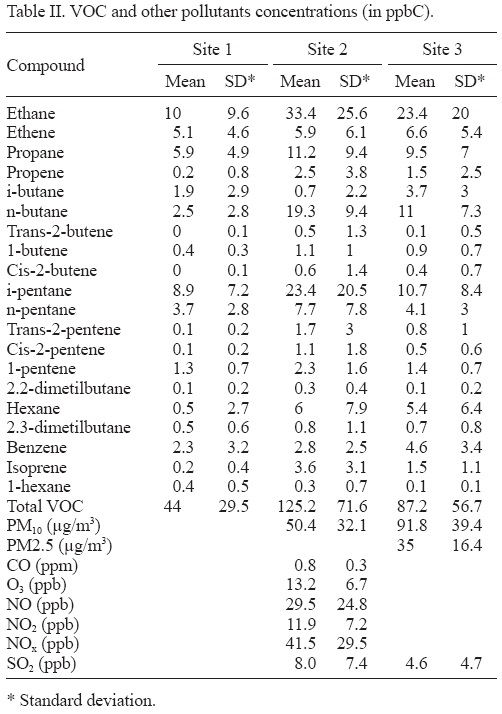
According to these results, alkanes are the most abundant hydrocarbons in the ambient air of Bogotá. Species such as pentane and butane isomers (i.e., n-pentane, i-pentane, n-butane, i-butane) area classified in this category. This condition was present at all three sampling sites, where these compounds represent about 80% of the total documented hydrocarbons. Alkenes (i.e., ethene, propene, pentene) represent 15% and aromatics 5% of the total VOC.
3.2 VOC temporal distribution
Figure 2 shows hourly temporal distribution (site 2, all sampled days) for some VOC, NOx, SO2 and O3. NOx and VOC rise to a maximum concentration in the early morning (probably due to peak vehicular traffic) and O3 concentration rises during the day when sunlight is present. This phenomenon is explained by photolysis reactions and has been reported in literature as a normal daily trend in urban centers (Finlayson-Pitts and Pitts, 2000). Figure 3 also present O3 hourly average concentration at site 2 and solar radiation. O3 mean concentration and maximum values are between the concentration ranges previously documented for Bogotá and other Latin American cities (WMO, 2012).
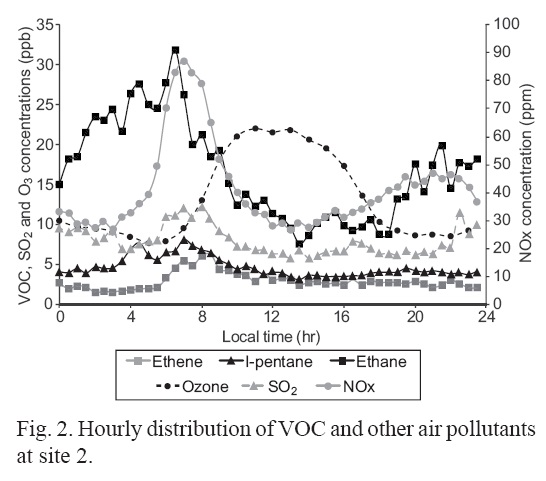
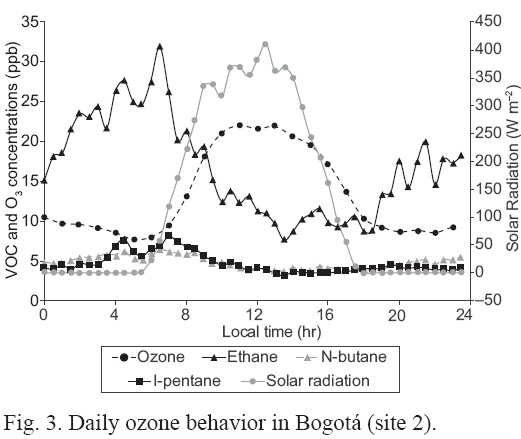
Figure 4 shows hourly total VOC mean concentrations at each of the three sampling sites (categorized by weekdays and weekends). The black curve in this figure represents the hourly variation of total hydrocarbons concentrations during a weekday and the grey curve describes the same variable for a day during the weekend. According to these results, at site 2 (characterized by industrial and commercial activities and high vehicular traffic) the total VOC levels during a weekday begin to increase around 5:00 LT and reach their highest peak between 7:00 and 8:00 LT. This period coincides with the morning rush hours of the city. Subsequently, total VOC concentrations start to decrease and keep constant until the final hours of the day, when they increase again reaching another concentration peak around 10:00 LT. The behavior at site 3 is similar to that observed for site 2.
3.3. Ozone forming potential
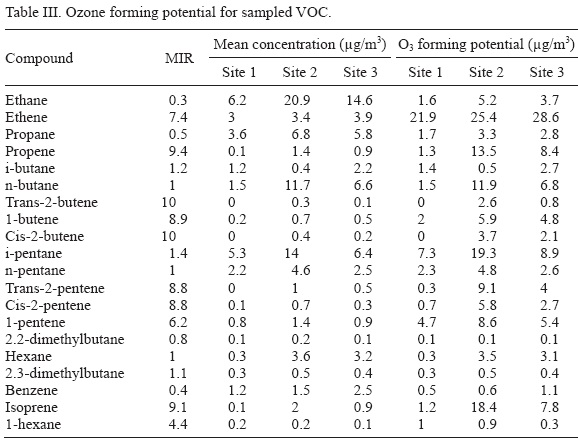
The evaluation of the role of each VOC in the O3 formation process showed that ethene, propene, n-butane, i-pentane, and isoprene are the species with the highest OFP. Table III shows the mean concentration of the 20 hydrocarbons sampled together with their ozone formation potential. These results suggest that a high concentration of VOC is not directly linked to elevated O3 production; however pollution management strategies in the city should be oriented to controlling the emission of both high-concentration and high-OFP VOC.
3.4 Source identification
3.4.1 Site 2
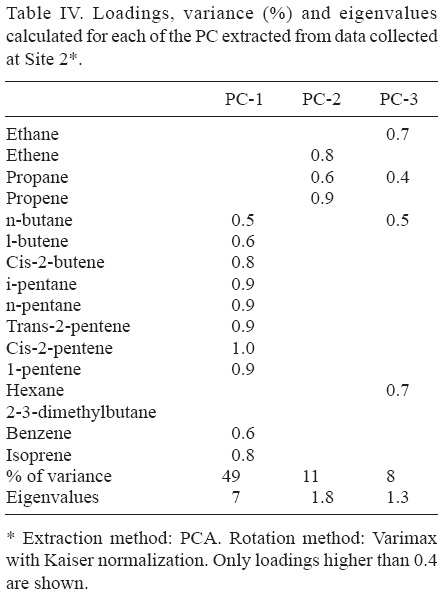
The PCA model was able to extract three PCs (see Table IV) at site 2. The variance retained by these three PCs is equal to 68% and the eigenvalues are greater than 1.0. Table V shows that PC-1 has high loadings of all the pentanes, mainly i-pentane and n-pentane which are associated to evaporative emissions. PC-1 also shows high loadings of isoprene, which may indicate that this component is associated to biogenic emissions. In the same way, PC-2 corresponds to vehicle exhaust emissions and PC-3 to liquefied petroleum gas (LPG). PC-3 also has high loadings of other compounds (i.e., ethane and hexane). Recent studies have included available measured concentrations of primary pollutants in the principal components analysis to increase the number of extracted PCs. At this site the concentrations of CO, NOx and SO2 were also monitored, thus these compounds were also included in the modeling (see Table V).
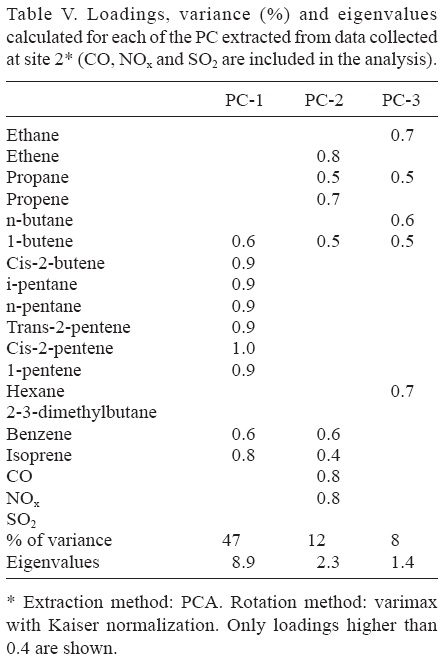
As can be seen, the number of extracted PC remains unchanged when these three primary pollutants are included. Moreover, the VOC profiles remain also nearly the same. In this case, CO and NOx appear related to PC-2. These two compounds are also associated to vehicle exhaust emissions. These results confirm the previous findings: all the compounds that have a high loading in PC-2 are related to vehicle exhaust emissions. On the other hand, SO2 is not related to any PC. Available emission inventories made for Bogotá city conclude that SO2 is mostly emitted by industrial activities (Zárate et al., 2007), which confirms that all the compounds that are presented in Table IV (except SO2) are associated to road traffic.
3.4.2 Site 3
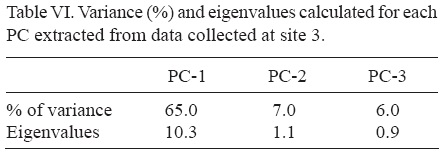
Table VI shows the variances (in percentage) and eigenvalues calculated for each of the PCs extracted. As it can be seen, the first two PCs retain 72% of the variance and only the first two PCs have eigenvalues greater than 1.0, which indicates that the PCA model can only extract two PCs from this database. This number of PCs is insufficient to identify VOC sources. Therefore, despite the fact that the PCA model is easy to use, its main weakness is that it extracts a reduced number of PCs in some cases. In order to identify the sources of the VOC at site 3 it would be useful to run a more advanced tool like the positive matrix factorization (PMF) model.
4. Discussion and conclusion
For the first time, ambient concentrations of C2-C6 VOC species were documented at three different areas of Bogotá. Scientific literature has reported a large number of studies related to VOC concentrations in many places, however studies of VOC characterization in ambient air in Latin American cities are still limited. A study developed in Dallas (Qin et al., 2007) determined non-methane hydrocarbon concentrations during the period between 1996 and 2004. In addition to the O3 forming potential, authors reported an average concentration of 99 ppbC for the total amount of VOC. This value is in range with the concentrations found for this study (44-125 ppbC). Cheng and Sandhu (1997) developed a study in Edmonton (Canada), in which temporal variation of some VOC concentrations in ambient air was analyzed. The mean concentration values reported for compounds such as propane, propene, butane and benzene were 25, 5, 22 and 6 ppbC, respectively. These values are higher compared to the data obtained for the same compounds in Bogotá.
Dollard et al. (2007) measured the concentration trends of hydrocarbons C2 and C8 from 1993 to 2004 in different zones of the United Kingdom. The authors reported concentrations between 4-11 ppbC for aromatic species such as benzene. In addition, their results evidence a trend to lower concentrations over that period of time due to the enforcement of control policies such as the mandatory use of catalytic converters for gasoline vehicles.
As a result of the high levels of O3 reported in some Asian cities, VOC monitoring in countries like China and India became more important. So and Wang (2004) analyzed concentrations of C2-C12 in Hong Kong, concluding that higher VOC levels correspond to sites located closer to roads of high traffic. They also found that the lowest concentrations were present in rural areas. The average total concentrations of VOC were reported to be in the range of 100-160 ppbC in a place of the city where industrial activity and heavy-duty vehicles were predominant. The average concentration found in site 2 (corresponding to the industrial zone of Bogotá) is in that range also. Duan et al. (2008) assessed VOC concentrations during an episode of high O3 concentrations in Beijing (China). The mean concentration of total VOC during this episode was 379 ppbC, being alkanes and aromatic compounds the ones with highest concentrations among the registered species. Guo et al. (2011) studied atmospheric non-methane hydrocarbons during high PM10 episodes in Foshan (China). These authors documented ethyne, ethene, i-pentane, toluene, ethane and propane as the more abundant hydrocarbons (accounting for around 80%) and concluded that vehicular emissions were responsible for most hydrocarbons.
In South America, Gee and Sollars (1998) analyzed the concentrations of some VOC species in cities of Brazil, Ecuador, Chile and Venezuela, reporting concentrations for benzene between 10 and 35 ppbC. Quito (Ecuador) exhibited the lowest concentrations and Sao Pablo (Brazil) the highest values. For other species assessed during the study, such as hexane and toluene, concentrations were between 30 and 42 ppbC, being Santiago de Chile the city with highest concentrations of this compounds. Authors concluded that those values are relatively high compared with concentrations reported for cities from the USA and Europe but lower than Asian cities.
A study developed in Mexico (Arriaga-Colina et al. , 2004) assessed VOC concentrations in the metropolitan area of Mexico City. Data were collected for nine years between 1992 and 2001. Authors reported VOC total concentrations in the range of 1130- 6700 ppbC. These levels are significantly higher than the values found in this study for Bogotá. In Colombia there is a lack of information regarding ambient VOC concentrations, as none air quality-monitoring station in the country reports VOC data. According to our results, total VOC levels in Bogotá are lower than those reported in peer-reviewed literature for other cities in Latin America. One of the possible reasons for such situation may be the predominant meteorological conditions in the city, in particular its wind pattern.
In terms of the OFP, the top five compounds found in the present study were mostly the same in sites 2 and 3. So and Wang (2004) sampled 39 different hydrocarbons in Hong Kong, and they also reported the top ten VOC in terms of ozone production. Five of those match the compounds we identified in this study as the most important in terms of ozone production. Duan et al. (2008) assessed 57 VOC including alkanes, alkenes, aromatics and aldehydes in Beijing. They also determined the O3 forming potential for each gas measured. Excluding aldehydes (not considered in this study), five of those compounds (ethene, i-pentane, isoprene, propene and n-butane) match the top eight compounds with higher O3 forming potential for sampling sites 2 and 3 in this study. Another research project developed in California (Qin et al., 2004) reported ethane as the VOC with highest concentrations, but this gas was not among the top 10 most relevant gases involved in the O3 formation. That list included hydrocarbon species such as ethene, propene, i-pentane, n-butane and isoprene, which are also in the top 10 of the most important compounds related to the O3 formation in Bogotá.
The receptor modeling showed that most of the VOC species documented in this study at site 2 are emitted by motor-vehicles emissions and gasoline vaporization. This analysis also confirms that the top five compounds in terms of O3 production come mainly from road traffic. The results of this work provide a technical basis to local environmental authority, primary in air pollutants such as VOC that are not normally followed by the city's monitoring network. However, further research is needed in order to better understand Bogotá's air pollution scenario and to develop environmental policies and strategies aimed at improving the air quality of the city.
Acknowledgments
This study was supported in part by the Colombian Department of Science, Technology and Innovation (Colciencias, project code 1204-40-520246), the Commission for Research Partnerships with Developing Countries (KFPE) and the Centre of Studies on Urban and Regional Sustainability at the Universidad de los Andes.
References
Arriaga-Colina J. L., J. J. West, G. Sosa, S. S. Escalona, R. M. Ordúñez and A. D. M. Cervantes, 2004. Measurements of VOCs in Mexico City (1992-2001) and evaluation of VOCs and CO in the emissions inventory. Atmos. Environ. 38, 2523-2533. [ Links ]
Carter W., 1994. Development of ozone reactivity scales for volatile organic compounds. J. Air Waste Manage. 44, 881-899. [ Links ]
Cheng L., L. Fu and H. S. Sandhu, 1997. Seasonal variations of volatile organic compounds in Edmonton, Alberta. Atmos. Environ. 31, 239-246. [ Links ]
Chow J., J. G. Watson, J. J. Sah, C. S. Kiang, C. Loh, M. Lev-On, J. M. Lents, M. J. Molina and L.T. Molina, 2004. Megacities and atmospheric pollution, critical review discussion. J. Air Waste Manage. 54, 1226-1235. [ Links ]
DANE, 2011. Población consolidada departamental y omisión censal. CENSO 2005. Departamento Administrativo Nacional de Estadística, República de Colombia. Available at http://www.dane.gov.co/censo/files/libroCenso2005nacional.pdf (last accessed on December 15, 2011). [ Links ]
Dollard G. J., P. Dumitrean, S. Telling, J. Dixon and R. G. Derwent, 2007. Observed trends in ambient concentrations of C2-C8 hydrocarbons in the United Kingdom over the period from 1993 to 2004. Atmos. Environ. 41, 2559-2569. [ Links ]
Duan J., J. Tan, L. Yang, S. Wu and J. S. Hao, 2008. Concentration, sources and ozone formation potential of volatile organic compounds (VOCs) during ozone episode in Beijing. Atmos. Res. 88, 25-35. [ Links ]
EIU, 2011. Latin American green cities index. The Economist Intelligence Unit. Available at: http://www.siemens.com/press/pool/de/events/corporate/2010-11-lam/Study-Latin-American-Green-City-Index_spain.pdf (last accessed on August 6, 2014). [ Links ]
Finlayson-Pitts B. J. and J. N. Pitts Jr., 2000. Chemistry of the upper and lower atmosphere. Academic Press, San Diego, 969 pp. [ Links ]
Gee I. L. and C. J. Sollars, 1998. Ambient air level of volatile organic compounds in Latin American and Asian cities. Chemosphere 36, 2407-2506. [ Links ]
Guo H., T. Wang, I. J. Simpson, D. R. Blake, X. M. Yu, Y. H. Kwok and Y. S. Li, 2004. Source contributions to ambient VOCs and CO at a rural site in eastern China. Atmos. Environ. 38, 4551-4560. [ Links ]
Guo S., J. Tan, J. Duan, Y. Ma, F. Yang, H. Yu and J. Wang, 2011. Characteristics of atmospheric non-methane hydrocarbons during high PM10 episodes and normal days in Foshan, China. Atmos. Res. 101, 701-710. [ Links ]
Gurjar B. R., T. M. Butler, M. G. Lawrence and L. Leliereld, 2008. Evaluation of emissions and air quality in megacities. Atmos. Environ. 42, 1593-1606. [ Links ]
Hester R. E. and R. M. Harrison (Eds.), 1995. Volatile carbon compounds in the atmosphere. Issues in environmental science and technology. The Royal Society of Chemistry, Cambridge, 140 pp. [ Links ]
Jorquera H. and B. Rappenglück, 2004. Receptor modeling of ambient VOC at Santiago, Chile. Atmos. Environ. 38, 4243-4263. [ Links ]
Leuchner M. and B. Rappenglück, 2010. VOC source-receptor relationships in Houston during TexAQS-II. Atmos Environ 44, 4056-4067. [ Links ]
Luna D. and E. Behrentz, 2011. Estado de cuentas y nueve propuestas para el buen gobierno de Bogotá. CESA, Bogotá, 253 pp. [ Links ]
Qin Y., G. S. Tonnesen and Z. Wang, 2004. Weekend/ weekday differences of ozone, NOx, CO, VOCs, PM10 and the light scatter during ozone season in southern California. Atmos. Environ. 38, 3069-3087. [ Links ]
Qin Y., T. Walk, R. Gary, X. Yao and S. Elles, 2007. C2-C10 non-methane hydrocarbons measured in Dallas, USA. Seasonal trends and diurnal characteristics. Atmos. Environ. 41, 6028-6032. [ Links ]
Seinfeld J. H. and Pandis S. N., 2000. Atmospheric chemistry and physics. From air pollution to climate change Wiley, New York. [ Links ]
So K. L. and T. Wang, 2004. C3-C12 non-methane hydrocarbons in subtropical Hong Kong: Spatial-temporal variations, source-receptor relationships and photochemical reactivity. Sci. Total Environ. 328, 161-174. [ Links ]
Song Y., S. Xie, Y. Zhang, L. Zeng, L. Salmon and M. Zheng, 2006. Source apportionment of PM2.5 in Beijing using principal component analysis/absolute principal component scores and UNMIX. Sci. Total Environ. 372, 278-286. [ Links ]
WHO, 2005. An assessment of health effects of ambient air pollution in Latin America and the Caribbean. World Health Organization, Pan-American Health Organization Office, Washington D.C., 68 pp. [ Links ]
WHO, 2014. Ambient (outdoor) air pollution in cities database 2014. World Health Organization. Available at: http://www.who.int/phe/health_topics/outdoorair/databases/cities/en/. [ Links ]
WMO, 2012. Impacts of megacities on air pollution and climate. GAW Report No. 205. World Meteorological Organization, Geneva, 299 pp. [ Links ]
Zárate E., L.C. Belalcázar, A. Clappier, V. Manzi and H. van den Bergha, 2007. Air quality modeling over Bogotá, Colombia: Combined techniques to estimate and evaluate emission inventories. Atmos. Environ. 41, 6302-6318. [ Links ]

