


Servicios Personalizados
Revista
Articulo
 Inglés (pdf)
 Artículo en XML
 Referencias del artículo
 Enviar artículo por email
Indicadores
-
 Citado por SciELO
 -
 Accesos
Links relacionados
-
 Similares en
SciELO
Similares en
SciELO
Compartir

 Permalink
Atmósfera
versión impresa ISSN 0187-6236
Atmósfera vol.27 no.1 Ciudad de México ene. 2014
Preliminary analysis of the development of the Carbon Tracker system in Latin America and the Caribbean
YU WOON JANG, IL-SOO PARK, SANG-SUB HA, SU-HWAN JANG, KYUNG-WON CHUNG, GANGWOONG LEE, WON-HO KIM, YONG-JOO CHOI
Korea-Latin America Green Convergence Center, Hankuk University of Foreign Studies, Seoul, Korea Corresponding author: Il-Soo Park; e-mail: hufspis@naver.com
CHEON-HO CHO
Climate Research Division, National Institute of Meteorological Research, Seoul, Korea
Received April 10, 2013; accepted October 25, 2013
RESUMEN
El sistema rastreador de carbono desempeñará un papel importante para mejorar la comprensión sobre las fuentes y sumideros de CO2, el intercambio de gases entre la atmósfera y el océano, y las emisiones de gases provenientes de incendios forestales y combustibles fósiles en América Latina y el Caribe. El objetivo del presente estudio es analizar las tendencias de los flujos de carbono en la biosfera y el océano, así como las emisiones procedentes de incendios forestales y el uso de combustibles fósiles en dicha región, mediante el sistema rastreador de carbono. De 2000 a 2009 el flujo promedio de carbono para la biosfera, el uso de combustibles fósiles, los incendios y el océano en América Latina y el Caribe fue de -0.03, 0.41, 0.296 y -0.061 Pg C/yr, respectivamente, y en México fue de -0.02, 0.117, 0.013 y -0.003 Pg C/yr, respectivamente. El promedio del flujo neto de carbono en América Latina y el Caribe, por un lado, y México, por el otro, fue de 0.645 y 0.126 Pg C/yr, respectivamente. En América Latina y el Caribe, los sumideros terrestres de carbono se encuentran principalmente en las regiones boscosas y agrícolas, así como en los pastizales, zonas de arbustos y en la cordillera de los Andes. Los flujos netos entre la superficie y la atmósfera que incluyen al combustible fósil son predominantes en los alrededores de las grandes ciudades de México, Brasil y Chile, al igual que en las zonas de deforestación en el río Amazonas. Se ha comprobado que los incendios forestales son una importante fuente de CO2 en América Latina y el Caribe. Por otra parte, podemos confirmar que la política de fomento al uso de etanol en vehículos livianos en Brasil ha contribuido a disminuir las emisiones de carbono generadas a partir de combustible fósiles, y suponer el efecto del programa Proárbol en México como resultado de la absorción de carbono proveniente de la biosfera y de incendios forestales. Este estudio confirma que el sistema rastreador de carbono puede cumplir un papel importante en Latinoamérica y el Caribe como herramienta científica para comprender mejor los procesos de absorción y liberación de carbono derivados de los ecosistemas terrestres, del uso de combustibles fósiles y del océano, además de permitir una vigilancia a largo plazo de las concentraciones de CO2 en la atmósfera.
ABSTRACT
The Carbon Tracker system will play a major role in understanding CO2 sinks and sources, gas exchange between the atmosphere and oceans, and gas emissions from forest fires and fossil fuels in Latin America and the Caribbean. This paper discusses the trends in carbon fluxes in the biosphere and ocean, as well as emissions from forest fires and fossil fuel use in the above-mentioned region, using the Carbon Tracker (CT) system. From 2000 to 2009, the mean carbon fluxes for the biosphere, fossil fuel use, wildfires and the ocean in Latin America and the Caribbean were -0.03, 0.41, 0.296, -0.061 Pg C/yr, respectively, and -0.02, 0.117, 0.013, -0.003 Pg C/yr, respectively, in Mexico. The mean net carbon flux for Latin America and the Caribbean was 0.645 Pg C/yr, and 0.126 Pg C/yr for Mexico. The terrestrial sinks in Latin America and the Caribbean are dominated by the forest, agricultural, grass and shrub regions, as well as the Andes mountain range and the net surface-atmosphere fluxes including fossil fuel are dominant in regions around large cities in Mexico, Brazil, Chile, and areas undergoing deforestation along the Amazon River. The results confirm that forest fires are an important source of CO2 in Latin America and the Caribbean. In addition, we can confirm that policies encouraging the use of ethanol in light vehicles in Brazil have helped to decrease carbon emissions from fossil fuel, and assume the effects of the Proárbol program on carbon sinks from the biosphere and from fire emissions sources in Mexico. Based on this analysis, we are confident that the CT system will play a major role in Latin America and the Caribbean as a scientific tool to understand the uptake and release of Co2 from terrestrial ecosystems, fossil fuel use and the oceans, and for long-term monitoring of atmospheric CO2 concentrations.
Keywords: Carbon Tracker system, CO2 sinks and sources, Latin America and the Caribbean, biosphere, fossil fuel, forest fires.
1. Introduction
Atmospheric measurements show that the global average of atmospheric carbon dioxide (CO2) concentration is currently above 398 parts per million (ppm) and rising. Gaining a more accurate understanding of the CO2 fluxes involved in the global carbon cycle will require a greenhouse gas monitoring system with adequate accuracy and precision to objectively quantify progress in reducing CO2 emissions. The current sparse network of observation sites across North America and elsewhere is suitable for calculating annual continental fluxes of CO2; but evaluating the success of mitigation measures requires fluxes to be resolved within much smaller regions. Current ground-based measurement technologies can provide the required precision, but the number of measurements is still insufficient. A powerful way to use these data is through a data assimilation system, which can utilize diverse types of data to develop a unified description of the modeled physical/biogeochemical system, consistent with the observations. The current grid scale for assimilation systems -such as the Carbon Tracker, the first data assimilation system to provide CO2 flux estimates- is limited to a resolution of about 100 km or larger, primarily due to computer resource limitations (Marquis and Tans, 2008).
Knowledge of current carbon sources and sinks, their spatial distribution, and their variability in time is essential for predicting future atmospheric CO2 concentrations, and therefore the anthropogenic perturbation of radiative forcing by CO2 (Denman et al., 2007; Hougton, 2007). To that end, we analyze a unique vertical profile sampling strategy using the Carbon Tracker (CT) 2011 system, which was implemented by the National Oceanic and Atmospheric Administration/Earth System Research Laboratory (NOAA/ESRL) to extract signatures of the exchange of CO2 and trace gases at continental scales and their associated variability (Crevoisier et al., 2010).
As a scientific tool, together with long-term monitoring of atmospheric CO2 concentrations CT will help to improve our understanding of how carbon uptake and release from terrestrial and ocean ecosystems is responding to a changing climate, increasing atmospheric CO2 and other environmental changes, including management strategies. CT will play a major role as a tool for monitoring, diagnosing, and possibly predicting the behavior of the global carbon cycle and the climate system. It can also monitor annual carbon fluxes at regional and global scales, even though its accuracy is lower than other methods, as shown in Table I (Hiroshi et al., 2013).
CT can also become a policy support tool, since it can accurately quantify natural and anthropogenic CO2 emissions and uptake at regional scales, which are currently limited by sparse observational networks. With adequate observations, CT can be used to track regional emissions over long time periods, including those from fossil fuel use; this will provide an independent control on emission amounts and estimates of fossil fuel use, based on economic inventories. With CT, responses to policies aimed at limiting greenhouse gases emissions can be evaluated. This independent measure of the effectiveness of policy choices can help improve mitigation strategies. CT is intended to be a tool for the community. Policy makers, industry, scientists, and the general public can use information from CT to make informed decisions on limiting greenhouse gases levels in the atmosphere.
Our ability to accurately track carbon with improved spatial and temporal resolution depends on our ability to analyze an appropriate number of samples in order to characterize atmospheric variability. CTs ability to accurately quantify natural and anthropogenic emissions and uptake at regional scales with a 1° x 1° spatial distribution in surface fluxes is currently limited by a sparse observational network outside North America. Observation sites collect flask air samples at 81 sites, continuously measured samples at 13 sites, and tower samples at nine locations across the world. We expect that the finer-scale estimates will become more robust with future expansion of the CO2 observing network.
CT could be used as a tool for understanding other atmospheric species and their possible roles in relation to the global carbon cycle. CT North America, CT Europe, and CT Asia are already operating, and Methane Tracker and CT Australia are being developed (NOAA/ESRL, 2013). CT 2011 is the sixth and latest release of the NOAA CO2 measurement and modeling system; it is designed to keep track of sources (emissions to the atmosphere) and sinks (removal from the atmosphere) of carbon dioxide around the world, using atmospheric CO2 observations from a host of collaborators. CT 2011 provides global estimates of these surface fluxes of CO2 from January 2000 through December 2010 (NOAA/ESRL, 2013).
Latin America and the Caribbean, bordering on the Pacific and Atlantic oceans, have abundant natural resources and important ecological landforms. In South America, the Amazon River, with the largest drainage basin in the world (around 7 050 000 km2) accounts for approximately one-fifth of the world's total river flow, and the Amazon basin has lost an area of about 78 000 km2 since 1960 mainly due to economic development. Even though, carbon emissions in 2009 from fossil fuel use in South America accounts for around 2% of the global emissions. Atmospheric CO2 concentration in South America is only 2 ppm lower than the global average CO2 concentration (Park et al., 2012). Deforestation and ecosystem degradation have increased anthropogenic CO2 emissions, which have resulted in climate change during the last decades (Ellsaesser, 1990).
CT for Latin America and the Caribbean will play a major role in analyzing carbon fluxes from terrestrial photosynthesis (CO2 sink) and respiration (CO2 source), uptake of other greenhouse gases, gas exchange between the atmosphere and oceans, and gas emissions from forest fires and fossil fuel use. This analysis presents a discussion of the trends in carbon fluxes in the biosphere, oceans, and emissions from forest fires and fossil fuel use in Latin America and the Caribbean using the CT system.
2. Introduction to CT
CT is a system that calculates carbon dioxide uptake and release at the Earth's surface over time, and is composed of seven modules as shown in Figure 1 (NOAA/ESRL, 2013). It estimates carbon dioxide exchange from an "atmospheric point of view".
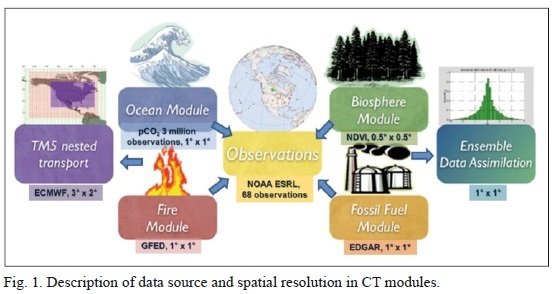
2.1 Ocean module
The oceans play an important role in the Earth's carbon cycle. They are the largest long-term sink for carbon and have an enormous capacity to store and redistribute CO2 within the Earth system. Ocean-ographers estimate that about 48% of the CO2 from fossil fuel burning has been absorbed by the ocean (Sabine et al., 2004). Although much progress has been made in recent years to understand and quantify ocean sink, considerable uncertainties remain about the distribution of anthropogenic CO2 in the ocean. It was reported that 20 to 35% of anthropogenic CO2 emissions were sequestered by the ocean (Samar et al. , 2009). The annual changes in oceanic sinks are small and well constrained (Gruber et al., 2009). The dissolution of CO2 in seawater shifts the ocean's carbonate equilibrium towards a more acidic state with a lower pH. This effect is already measurable (Caldeira and Wickett, 2003), and is expected to become an acute challenge to shell-forming organisms over the coming decades and centuries. Although oceans as a whole have been a relatively steady net carbon sink, CO2 can also be released from oceans depending on local temperatures, biological activity, wind speeds, and ocean circulation. These processes are all considered in the CT system, since they can have significant effects on the ocean sink. Improved estimates of air-sea exchange of carbon help us in turn to understand variability of both the atmospheric burden of CO2 and terrestrial carbon exchange. Oceanic uptake of CO2 in CT is computed using air-sea differences in the partial pressure of CO2, inferred either from ocean inversions or from a compilation of direct measurements of seawater pCO2. These air-sea partial pressure differences are combined with a gas transfer velocity computed from wind speeds in the atmospheric transport model to compute fluxes of carbon dioxide across the sea surface (NOAA/ ESRL, 2013).
2.2 Biosphere module
The biosphere component of the terrestrial carbon cycle consists of all the carbon stored in biomass, which includes trees, shrubs, grasses, carbon in soils, dead wood, and leaf litter. These reservoirs of carbon can exchange CO2 with the atmosphere. Exchange starts when plants take up CO2 during the growing season through photosynthesis (CO2 sink). Some of this carbon is released to the atmosphere throughout the year through respiration (CO2 release); this includes both the decay of dead wood and litter and the metabolic respiration of living plants. Vegetation also returns carbon to the atmosphere when biomass is burned. The biosphere model currently used in CT is the Carnegie-Ames Stanford Approach (CASA) biogeochemical model, which calculates global carbon fluxes using input from weather models to drive biophysical processes, and a satellite-observed normalized difference vegetation index (NDVI) to track plant phenology. The version of the CASA model used so far was run using year-by-year climate data and satellite observations, including the effects of fires on photosynthesis and respiration (Giglio et al., 2006). This simulation renders 0.5° x 0.5° global fluxes on a monthly time resolution.
2.3 Fire module
Forest and grassland fires are an important part of the carbon cycle and have been so for many millennia. Even before human civilization began to use fires to clear land for agricultural purposes, most forest ecosystems were subject to natural fires that would renovate old forests and add nutrients to the soils. When fires consume part of the landscape in either controlled or natural burning, carbon dioxide (together with other gases and aerosols) is released in large quantities. Each year, vegetation fires emit around 2 PgC as CO2 into the atmosphere, mostly in the tropics. Currently, a large fraction of these fires are started by humans, and most are intentionally used to clear land for agriculture, or to re-fertilize soils before a new growing season. This important component of the carbon cycle is monitored mostly from space, while sophisticated biomass burning models are used to estimate the amount of CO2 emitted by each fire. These estimates are then used in the CT system to prescribe the emissions, without further refinement by our measurements. The fire module currently used in the CT is based on the Global Fire Emissions Database (GFED), which uses the CASA biogeochemical model to estimate the carbon fuel in various biomass pools. The dataset consists of a monthly 1° x 1° gridded burned area, fuel loads, combustion completeness, and fire emissions (C, CO2, CO, CH4, NMHC, NOx, N2O, PM2.5, total particulate matter, total carbon, organic carbon, black carbon) for the period spanning from January 1997 to December 2009 (NOAA/ESRL, 2013).
2.4 Observations
Observations of the CO2 mole fraction by NOAA/ ESRL and partner laboratories are at the heart of the CT system. They report changes in the carbon cycle, whether they are regular (such as the seasonal growth and decay of leaves and trees), or irregular (such as the release of carbon by forest fires). The results of the CT system depend directly on the quality, amount and location of available observations, and the degree of detail at which we can reliably monitor the carbon cycle increases with the density of the observation network. CT uses measurements of air samples collected at surface sites in the NOAA/ ESRL Cooperative Global Air Sampling Network, the Commonwealth Scientific and Industrial Research Organization (CSIRO) Air Sampling Network and the Nuclear and Energy Research Institute /Environmen-tal and Chemistry Centre (IPEN/CQMA) sampling program where available, except those flagged for analytical or sampling problems, or those thought to be influenced by local sources. The sites for which data are available thus vary each week depending on successful sampling and analysis and the sampling frequency at each site. In South America, three stations in Arembepe, Bahia (12.77° S, 38.17° W) Brazil, Easter Island (27.15° S, 109.45° W) Chile, and Tierra del Fuego, Ushuaia (54.87° S, 68.48° W) Argentina are used by the CT system (NOAA/ESRL, 2013).
2.5 Fossil fuel module
Human beings first influenced the carbon cycle through land use change. Early humans used fire to control animals and later to clear the forest for agriculture. Over the last two centuries, following the industrial and technical revolutions and the increase in world population, fossil fuel combustion has become the largest anthropogenic source of CO2. Coal, oil and natural gas combustion are the most common energy sources in both developed and developing countries. Various sectors of the economy rely on fossil fuel combustion: power generation, transportation, industrial processes, and residential/commercial building heating. In 2008, the world emissions of CO2 from fossil fuel burning, cement works, and gas flaring reached 8.7 PgC/yr; in 2009 and 2010, they amounted to 8.6 PgC yr-1 and 9.1 PgC yr-1, respectively (Boden et al. , 2011). The fossil fuel emission inventory is derived from independent global total and spatially-resolved inventories, whereas the annual global total CO2 emissions in fossil fuel were taken from the Carbon Dioxide Information and Analysis Center (CDIAC) (Boden et al., 2011), which covers the year 2008. In order to extrapolate these fluxes to 2009 and 2010, the percentage increase or decrease for each fuel type (solid, liquid, and gas) and country, we used the 2011 BP Statistical Review of World Energy for 2009 and 2010. The fossil fuel CO2 fluxes are spatially distributed in two steps: first, the coarse-scale flux distribution country totals from Boden et al. (2011) are mapped on 1° x 1° resolution grids; next, the country totals are distributed within each country according to the spatial patterns provided by the Emission Database for Global Atmospheric Research (EDGAR) v4.0 inventories, which are annual estimates also at a 1° x 1° resolution (EC, 2009).
2.6 TM5 nested transport
The link between measurements of CO2 concentration in the atmosphere and the exchange of CO2 at Earth's surface is the transport in the atmosphere. Storm systems, cloud complexes, and various weather conditions cause winds that transport CO2 around the world. As a result, local events like fires, forest growth, and ocean upwelling can have impacts at remote locations. To simulate winds and weather, CT uses numerical models driven by the daily weather forecasts from specialized meteorological centers of the world. Since CO2 does not decay or react in the lower atmosphere, the influence of emissions and uptake in locations such as North America and Europe are ultimately seen in our measurements even at the South Pole. To represent atmospheric transport, the Transport Model 5 (TM5) is used. This is a community-supported model whose development is shared among many scientific groups with different areas of expertise. TM5 is used for many applications other than CT, including forecasting air quality, studying the dispersion of aerosols in the tropics, tracking biomass burning plumes, and predicting pollution levels that future generations might face. TM5 is based on its predecessor TM3 model, with improvements in the advection scheme, vertical diffusion parameterization, and meteorological preprocessing of the wind fields (Krol et al., 2005). The model is developed and maintained jointly by the Institute for Marine and Atmospheric Research Utrecht (IMAU, Netherlands), the Joint Research Centre (JRC, Italy), the Royal Netherlands Meteorological Institute (KNMI, The Netherlands), and NOAA/ESRL (USA). In the CT system, TM5 separately simulates advection, convection (deep and shallow), and vertical diffusion in the planetary boundary layer and free troposphere. The winds that drive TM5 come from the European Center for Medium range Weather Forecast (ECMWF) operational forecast model. This "parent" model currently runs with ~25 km horizontal resolution and 60 layers in the vertical prior to 2006 (and 91 layers in the vertical from 2006 onwards). The carbon dioxide levels predicted by CT do not feed back into the wind predictions.
For use in TM5, the ECMWF meteorological data are preprocessed into coarser grids. In CT, TM5 is run at a global 3° x 2° resolution with a nested regional grid over Latin America at 1° x 1° resolution. TM5 runs at an external time step of three hours, but due to the symmetrical operator splitting and the refined resolution in nested grids, processes at the finest scale are repeated every 10 min. The vertical resolution of TM5 in CT is 34 hybrid sigma-pressure levels (from 2006 onwards; 25 levels for 2000-2005), unevenly spaced with more levels near the surface (NOAA/ESRL, 2013).
2.7 Ensemble data assimilation
Data assimilation has been used to estimate the state of a dynamic system by merging sparse data into a numerical model of the system (Kao et al., 2004). An example of data assimilation is a weather model that is updated every few hours with measurements of temperature and other variables to improve the accuracy of its forecast for the following days. Data assimilation is usually a cyclical process, as estimates get refined over time and more observations about the actual conditions become available. Mathematically, data assimilation can be done with any number of techniques. For large systems, so-called variation and ensemble techniques have gained most popularity. Because of the size and complexity of the systems studied in most fields, data assimilation projects inevitably include supercomputers that model the known physics of a system. Success in guiding these models in time often strongly depends on the number of observations available to update information on the true system state. In CT, the model that describes the system contains relatively simple descriptions of biospheric and oceanic CO2 exchange, as well as fossil fuel and fire emissions. The four surface flux modules drive instantaneous CO2 fluxes in CT according to:
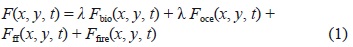
where 1 represents a set of linear scaling factors applied to the fluxes to be estimated in the assimilation. These scaling factors are the final product of the assimilation and together with the modules determine the fluxes in CT. It is important that no scaling factors are applied to the fossil fuel and fire modules (NOAA/ESRL, 2013). Also, FHo, Foce, Fff and Ffire represent the flux in biosphere, ocean, fossil fuel and fire, respectively.
2.8 Description of the CT operation
The CT system calculates carbon dioxide uptake and release at the Earth's surface over time. It estimates the carbon dioxide exchange from an "atmospheric point of view". Since CO2 mole fractions in the atmosphere reflect the sum of all CO2 exchange at the surface, they form the ultimate record of the combined human and natural influence on greenhouse gases levels. CT produces model predictions of atmospheric CO2 mole fractions, to be compared with the observed atmospheric CO2 mole fractions. The difference between them is attributed to differences in the sources and sinks used to make the prediction (a "first-guess") and the sources and sinks affecting the actual atmospheric CO2 concentration. Using numerical techniques, these differences are used to solve for a set of sources and sinks that most closely matches the observed CO2 in the atmosphere. CT has a representation of atmospheric transport based on weather forecasts, and modules representing air-sea exchange of CO2, photosynthesis and respiration by the terrestrial biosphere, and release of CO2 to the atmosphere by fires and combustion of fossil fuels (NOAA/ESRL, 2013).
A long-term global monitoring strategy is necessary to improve our knowledge of carbon cycling processes. One critical element in such strategy is provided by the so-called "top-down atmospheric inversion" method, which is based on atmospheric concentration measurements from a global network of observation stations. The CO2 concentration in air samples represents information from the net effect of sources and sinks. The sources and sinks of CO2 can be calculated from measured CO2 concentration and known transport processes.
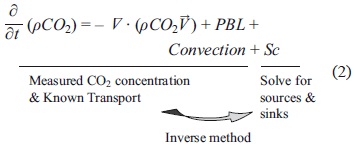
First, prior knowledge of the spatial-temporal distribution of the fluxes to estimate is necessary. Fluxes are base components provided from fossil fuel use, forest fires, vegetation and the oceans. These are inserted into an atmospheric model that simulates the mixing of air over the entire globe. Simulated concentrations are compared with the observed atmospheric CO2 mole fractions at the location and time when measurements are available. Finally, inverse modeling in CT is used to optimize the sources and sinks of CO2 to reduce the differences between the simulated CO2 values and the measurements (NIMR, 2009).
3. Results from CT
From 2000 to 2009, terrestrial ecosystems in Latin America and the Caribbean had an average sink of 0.03 PgC/yr (Table II). This natural sink offsets about 7% of the 0.41 PgC/yr emissions that result from burning of fossil fuels. Whereas fossil emissions were generally steady over this period, ranging between 0.37 and 0.45 PgC/yr (Fig. 2), the amount of CO2 taken up in Latin America and the Caribbean varied significantly from year to year. In terrestrial biosphere models, interannual variability in land uptake can be related to anomalies in large-scale temperature and precipitation patterns (NOAA/ESRL, 2013). The year with the smallest annual uptake by terrestrial ecosystems was 2003 with 0.199 PgC /yr, which resulted from the El Niño events of 2002/2003. In 2006, the year with the largest land sink, terrestrial uptake was 0.203 PgC/yr, about seven times higher than the mean value. Fossil fuel emissions from Latin America and the Caribbean were also slightly reduced in 2009 compared to earlier years as a result of the economic downturn. Thus, 2009 showed the lowest net input of CO2 into the atmosphere from Latin America and the Caribbean since 2002. The 2009 net annual emission was 0.46 PgC/yr, about 29% smaller than the mean (0.65 PgC /yr). Trends in carbon fluxes in Mexico were similar to those in Latin America and the Caribbean (Table II, Fig. 2).
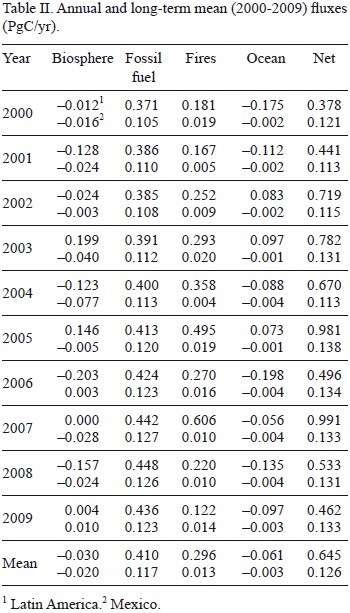
The amount of net carbon flux was about one-fifth of0.645 PgC/yr for Latin America and the Caribbean. Emissions from burning of fossil fuels in Mexico are mostly responsible for the net carbon flux (Fig. 2). The mean net carbon flux in Latin America and the Caribbean, and Mexico, was responsible for about 48 and 9% of the 1.34 PgC/yr (NOAA/ESRL, 2013) total net flux in North America (United States, Canada, Mexico).
Figure 3 shows the spatial pattern in net ecosystem exchange (NEE) of CO2 in the free troposphere of the terrestrial biosphere, averaged over 2000-2009, as modeled by CT. This NEE represents land-to-atmosphere carbon exchange from photosynthesis and respiration in terrestrial ecosystems, and the contribution from fire. It does not include fossil fuel emissions. The units are GgC/yr, and the values are given by the color scale depicted to the right of the figure. Negative fluxes (blue colors) represent CO2 uptake by the terrestrial biosphere, whereas positive fluxes (red colors) indicate regions where the terrestrial biosphere is a net source of CO2 to the atmosphere. The free troposphere corresponds to about 1.2 to 5.5 km above the ground (about 850-500 hPa in pressure terms). Gradients in CO2 concentration in this layer are due to exchange between the atmosphere and the Earth's surface, including fossil fuel emissions, air-sea exchange, photosynthesis, respiration, and forest fire emissions from the terrestrial biosphere. These gradients are subsequently transported by weather systems, even as they are gradually erased by atmospheric mixing (NOAA/ESRL, 2013). The CT approach can confirm that sinks in Latin America and the Caribbean are mainly located in the forest regions of Campina Grande and Natal bordering the Atlantic Ocean, and agricultural/grass/shrub regions around Anapu-Altamira, in Brazil; forest regions along the Gulf of Mexico; and forest regions in the Andes mountain range along the Pacific Ocean, in Peru. Terrestrial ecosystems which act as net sources of CO2 released to the atmosphere are mainly located in the deforested areas along the Amazon river, regions along the Equator, border regions between Guatemala and Mexico, and regions undergoing land use change in the Mamore River watershed, north of the Andes mountain range in lowland Bolivia (Fig. 3).
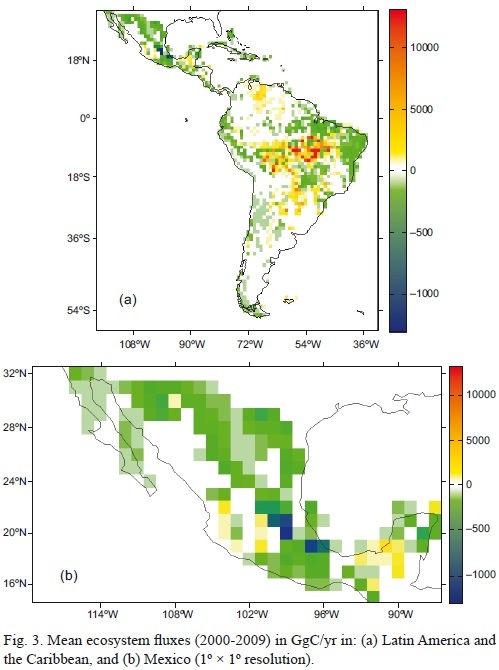
Figure 4 shows the spatial pattern of land fluxes in the total net surface-atmosphere flux -including fossil fuel emissions- in Latin America and the Caribbean. Seven major emission regions in Latin America and the Caribbean are highlighted: regions around Mexico City and the Mexico-Guatemala border, northern urban regions in Venezuela, deforested areas along the Amazon River, northwestern regions in Bolivia, coastal regions of Sao Paulo and Paraná along the Atlantic Ocean in Brazil, regions around Santiago de Chile, and regions around Buenos Aires in Argentina. Particularly, emissions are dominated mainly by fossil fuel emissions in the regions around Mexico City, northern urban regions in Venezuela, deforested regions along the Amazon River, and the coastal regions of Sao Paulo and Paraná in Brazil (Fig. 4).
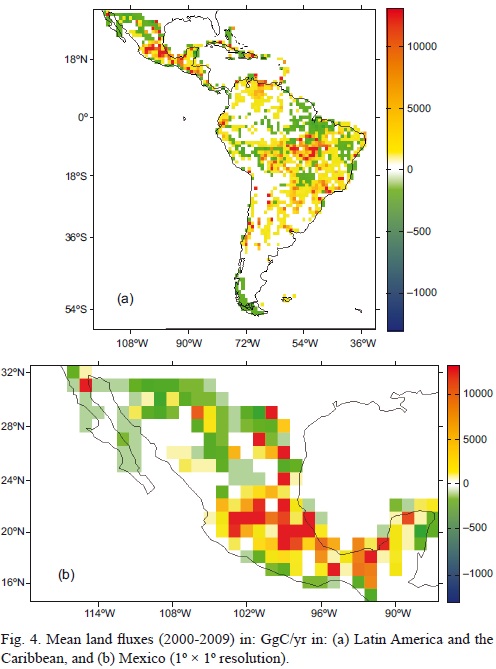
Figure 5 shows the nine zonal summed carbon fluxes in Latin America and the Caribbean averaged over the period 2000-2009: (1) the Gulf of California; (2) central Mexico; (3) southern regions in Mexico; (4) the Caribbean across Nicaragua; (5) the Pacific Ocean along South America; (6) the Caribbean, eastern Colombia, central Peru, and a transection over the Pacific Ocean; (7) Suriname, central Brazil, Paraguay, Uruguay and a transection over the Atlantic Ocean; (8) western Brazil and a transection over Sao Paulo; (9) the Atlantic Ocean along South America. As shown in Figure 5, there are two distinct sinks: the sink in zones 5, 6, and 9, which is dominated by the ocean, and the sink in zones 1, 2, 3, 7 and 8, which is dominated by the biosphere. It is remarkable that the biosphere in zones 4 and 6 plays a role as the source of atmospheric CO2. CO2 emissions from forest fires occur in all zones except 5 and 9. We know that the major source of atmospheric CO2 in Latin America and the Caribbean is forest fires, especially in zones 2, 7, and 8. The source of atmospheric CO2 from fossil fuels can be seen in zones 2, 3 and 8 particularly in zone 3 and 8.
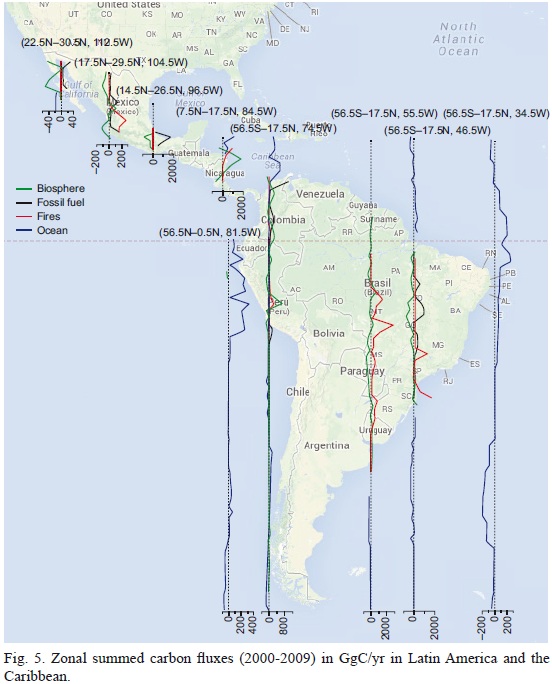
As shown in Table III, we know that total carbon sink from the biosphere in Mexico increased greatly from -995 PgC/yr in 2007 to -1810 PgC/yr in 2008, but decreased to 1306 PgC/yr in 2009. As for carbon from fire sources, it increased from 303 PgC/yr in 2007 to 545 PgC/yr in 2008, but decreased to 335 PgC/yr in 2009. We can generally assume that carbon sinks from biosphere and carbon from fires sources in Mexico have been scarcely affected by policies of deforestation slowing and biodiversity conservation since 2007, even though estimated carbon flux was limited to the given zonal (104.5° W), located in the center of Mexico. We know that total carbon from fossil fuel sources in central Brazil (55.5° W) transported over the Atlantic Ocean decreased from 2135 PgC/yr in 2008 to 2048 PgC/yr in 2009, and carbon from the same sources transported over Sao Paulo (46.5° W) from western Brazil decreased from 14 858 PgC/yr in 2008 to 14 067 PgC/yr in 2009. We can confirm that carbon from fossil fuel sources in Brazil has been affected by policies of ethanol use by light vehicles since 2008.
4. Review of carbon reduction policies in Latin America and the Caribbean
The approach used in this study confirmed that major carbon emission fluxes in Latin America and the Caribbean are derived from the terrestrial biosphere in South America, and fossil fuel use in megacities, especially in Mexico and Brazil. Other sources of carbon emissions are land clearance and forest fires in Brazil. Besides quantifying carbon fluxes, the carbon tracker methodology can suggest policy options for reducing carbon emissions and mitigation measures. Many previous studies by expert policy makers have suggested that the following policy options show the greatest potential: (1) reducing fossil fuel use and increasing the use of renewable energy, and (2) reducing deforestation by fostering biodiversity conservation and preventing forest fires.
1. Reducing fossil fuel use and increasing the use of renewable energy sources. Major countries in Latin America and the Caribbean have introduced different variations of regulatory policies and economic incentives to encourage renewable energy development, climate change mitigation and clean technology investment. These tools will increase the supply ratio of renewable energy and improve the energy efficiency of the region's domestic energy matrix. In 2002, the Brazilian government reduced the industrial production tax for manufacturers of ethanol-powered cars and subsidies were introduced for the purchase of new ethanol-powered vehicles. The government also introduced credits for the sugar industry to cover storage costs in order to guarantee ethanol supplies. As a consequence, by the end of 2008, ethanol in Brazil accounted for more than 52% of fuel consumption by light vehicles and almost 90% of Brazil's new cars blended fuel with around 25% ethanol in 2009 (Arcadia Market Commentary, 2009). In 2011, Brazil was the second biggest producer of bioethanol and Argentina the third. Costa Rica is the world leader in renewable energy with massive investment in windmill technologies. Of the total primary energy supply, 99.2% comes from renewable sources (NRDC, 2007). In addition efforts in Central America are underway to add 130 MW of geothermal energy supplies. Mexico, Chile, Peru and other countries are moving swiftly to facilitate solar development (BNEF, 2012). Uruguay has transformed its national energy policy with a focus on renewable energy. In 2008, this country launched a 25-year plan aiming to diversify its energy mix and reduce reliance on fossil fuels. Wind energy is expected to provide 15% of electricity in Uruguay by 2015 (UPI, 2013). To encourage investment and promote governmental policy changes, Mexico introduced a "wheeling tariffs" system in 2010 aimed at lowering the transmission wheeling fees, and Brazil developed a "bidding system with auction" for the wind, hydro and biomass sectors. Central American countries developed a quota obligation in 2007 to substitute 15% of the consumption of fossil fuels in the transportation sector with biofuels. Chile also established a renewable energy law in 2008 and instituted a renewable portfolio standard to encourage investment and subsidies. Finally, Peru used fiscal measures and introduced a bidding system for all sectors (Olivas, 2010). The development of low-carbon transportation infrastructure and related sustainable urban transportation policies also presents challenges, requiring many policy initiatives for each individual country. For example, Argentina introduced a 2008 railway reorganization act as a starting point and improved traffic signs to reduce travel times. The expansion of the subway system was also designed with low-carbon goals in mind. During the years 2011-2012, the Chilean government planned a new framework for tougher emissions regulations for all motor vehicles. The Mexican government adopted the international vehicle emissions standard in 2008. Nicaragua instituted a Vehicle Emission Inspection Act, restricting importation of vehicles more than 10 years old and replacing the fleet of urban buses beginning in 2009 (ECLAC, 2010). The examples listed here, related to the development of sustainable transportation infrastructures, are only some of the recent policy efforts in Latin America and the Caribbean. Other efforts have also started to promote "less polluting and more energy efficiency" solutions as a new challenge.
2. Reducing deforestation and biodiversity conservation policies. Since the beginning of the 21st century, climate change policies in Latin America aimed at reducing deforestation and increasing biodiversity conservation have been put in place in a number of countries such as Brazil, Paraguay, and Costa Rica. However, deforestation and land use change have continued with the desire to increase the production of soybean, sugar, coffee, and cattle pasture for beef products. Forest fires and land clearance associated with these changes have continued, but at slower rates (De la Torre et al., 2010). For example, during the past 20 years, Brazil has emerged as an agricultural superpower in the world and currently is the largest exporter of many agricultural products. Brazil is now the 2nd largest global producer of soybeans. But economic incentives driving deforestation still challenge forestry conservation efforts in South America. While this trend and controversy continues, other forest conservation efforts and forest policies have changed in Latin America and the Caribbean. For instance, in 2012, the Brazilian congress passed the latest version of a forest conservation code, which has been assessed as an advance for this purpose and is giving Brazil a new set of rules for restricting land use change for agricultural and livestock production. Implementing this code will continue to be a challenge; however, this kind of policy changes aimed at domestic forest preservation, especially for the Brazilian Amazon region, will be required as important priorities for climate change mitigation.
In Mexico, forest protection agencies have identified a number of programs related to the forestry sector. Among many forest protection programs, the Proárbol program (a tree-protection campaign in Mexico) was a dominant policy in 2007 with the objective of consolidating different federal support mechanisms to enhance the forestry sector. This program started with 1.4 million hectares under conservation contracts and then expanded to two million hectares in 2008. The policy issues competitive grants, paying landowners to conserve existing forests, and requests improvements in forest planning, forest protection, reforestation, developing commercial activities in wood processing, soil conservation and other areas (World Bank, 2009).
Other mitigation policy challenges at the international level include the United Nations Reducing Emission from Deforestation and Forest Degradation in Developing Countries program (UN-REDD), which was designed as a useful option for forest protection under a new Kyoto protocol. Currently, Argentina, Bolivia, Colombia, Costa Rica, Mexico, Nicaragua, Panama, Paraguay and Peru cooperate with these projects and benefit from their participation. According to De la Torre et al. (2010), Argentina, Mexico and Nicaragua are establishing alternative forest management practices to create alternative livelihoods for forest-dependent communities. Bolivia and Mexico are promoting community forestry. Costa Rica, Mexico, Nicaragua and Panama provide incentives for reforestation and plantations to relieve pressure on natural forests. However, as Hall (2011) has stated, this policy must be considered a main challenge in the process of policy implementation, with questions of efficiency versus equity in the competition over REDD funding with many players acting as beneficiaries. To eliminate free riders and support indigenous communities in forest areas, more efforts will be needed. For instance, indigenous people can play an important role in protecting biodiversity. Indigenous lands occupy one-fifth of the Brazilian Amazon -five times the area under protection in parks- and are currently the most important barrier to Amazon deforestation (Kronik and Verner, 2010).
In summary, continued policy innovations and enforcement of carbon reducing policies will be a challenge in the region. One of the most difficult obstacles is the government budget. In each individual country in this region there is still a limited budget for the implementation of policy options. In this regard, the best way to promote the introduction of new mitigation measures is to develop incentive-based policies that have the potential to allow for more cost-effective policies (West and Wolverton, 2005). Institutional aspects, such as the related laws, and organizations for reducing carbon emissions and international cooperation mechanisms (CDM and REDD) are still being developed at the moment. It is difficult to assess the performance of the measures discussed here. Many other challenges remain, such as the lack of clean technology and most importantly, the need to rapidly develop the skills and technical abilities of the human capital needed to lead further efforts towards a low-carbon society.
5. Conclusions
The CT system can play a major role as a scientific tool that can monitor, diagnose, and possibly predict the behavior of the carbon cycle at global or regional scales. CT North America, CT Europe, and CT Asia are operating, and Methane Tracker and CT Australasia are being developed. The CT system in Latin America and the Caribbean will play a major role in analyzing the sink and source of CO2, gas exchange between atmosphere and oceans, and gas emissions from wildfires and fossil fuel use.
From 2000 to 2009, the mean carbon fluxes for the biosphere, fossil fuel, fires and oceans in Latin America and the Caribbean were -0.03, 0.41, 0.296 and -0.061 PgC/yr, and -0.02, 0.117, 0.013 and -0.003 PgC/yr in Mexico, respectively. The mean carbon fluxes for the biosphere, fossil fuel, and oceans in Latin America and the Caribbean were 43, 23 and 13%, and 29, 6 and 0.6% in Mexico, with regard to the fluxes in North America. In the case of forest fires, the mean carbon flux in Latin America and the Caribbean was 30 times higher than the flux in North America. Mexico was responsible for about 48% of the mean net carbon flux in Latin America and the Caribbean, and for about 9% of the total net flux in North America (1.34 PgC/yr). Whereas fossil emissions were generally steady over this period, the amount of CO2 taken up by the biosphere in Latin America and the Caribbean was related to anomalies in large-scale temperature and precipitation patterns with significant variation from year to year.
This preliminary analysis confirms that sinks in the biosphere of Latin America and the Caribbean are mainly located in the forest/agricultural/grass/shrub regions bordering the Atlantic Ocean in Brazil, forest regions along the Gulf of Mexico, and the Andes mountain range. The terrestrial ecosystems which act as a net source of CO2 to the atmosphere are mainly located in the deforested regions along the Amazon River, regions along the Equator, the border of Guatemala, and Mexico and regions undergoing land use change in the Mamore River water shed north of the Andes mountain range, in lowland Bolivia. The year with the smallest annual uptake by terrestrial ecosystems was 2003 (0.199 PgC/yr), which resulted from the El Niño events of 2002-2003. The net surface-atmosphere fluxes including fossil fuel in Latin America and the Caribbean are dominated by regions around Mexico City, northern urban regions in Venezuela, deforested regions along the Amazon River, northwestern regions in Bolivia, coastal regions of Sao Paulo and Paraná along the Atlantic Ocean in Brazil, and areas around Santiago de Chile. The major source of CO2 released to the atmosphere in Latin America and the Caribbean is fire, with remarkable emissions in South America across Brazil, Paraguay and Uruguay. Forest fires are an important source of CO2 in Latin America and the Caribbean. We can confirm that policies encouraging the use of ethanol by light vehicles in Brazil have diminished carbon emissions from fossil fuel sources, and assume the effects of the Proárbol program on carbon sinks from the biosphere and from fire sources in Mexico.
The analysis in this document confirms that the CT system in Latin America and the Caribbean can play a major role as a scientific tool to understand the uptake and release of carbon from terrestrial and ocean ecosystems, as well as fossil fuel use, and as a long-term monitoring tool for atmospheric CO2 concentrations.
Natural and anthropogenic emissions and uptake at regional scales is currently limited by a sparse observational network. Measurements alone are insufficient to realize the social benefits. The number of monitoring stations around the world is very small in comparison with the heterogeneity of the terrestrial and oceanic carbon sources. With enough observations, it will be possible to keep track of regional emissions over long periods of time. Ultimately, satellites will be involved in evaluating the efforts to reduce GHGs global emissions. Although not as precise and accurate as surface measurements, these data will fill the spatial gaps in surface networks. A combination of satellite and ground-based measurements in CT should be applied in order to reduce uncertainty in regional carbon flux estimations and improve the temporal and spatial resolution of fluxes. CT outputs and satellite retrievals have to be validated with Fourier transform infrared spectrometry (FTIR), in situ measurement of flask air sampling by aircrafts, and tower measurements. Validation will allow quantifying uncertainties of the CT system and satellites, and will provide feedback for the improvement of CT procedures and retrieval algorithms of satellite data. In order to obtain the minimum level of uncertainty, an effort to improve modeling is required.
Acknowledgements
This work was supported by the National Research Foundation of Korea (NRF-2009-413-B00004) and funded by the Korean Ministry of Education, Science and Technology.
References
Arcadia, 2009. Renewable Energy Development in Emerging Markets. Arcadia Market Commentary. Available at: http://www.arcadia4u.com/commentaries/200908-Arcadia%20Market%20Commentary.pdf. [ Links ]
BNEF, 2012. Climate scope 2012: Assessing the climate for climate investing in Latin America and the Caribbean. Multilateral Investment Fund/Bloomberg New Energy Finance, London, 103 pp. [ Links ]
Boden T. A., G. Marland and R. J. Andres, 2011. Global, regional, and national fossil-fuel CO2 emissions. Carbon Dioxide Information Analysis Center, Oak Ridge National Laboratory, U. S. Department of Energy, Oak Ridge, Tennessee, doi:10.3334/CDI-AC/00001 V2011. [ Links ]
Caldeira K. and M. E. Wickett, 2003. Anthropogenic carbon and ocean pH. Nature 425, 365. [ Links ]
CEPAL, 2010. Low-carbon transport infrastructure: Experiences in Latin America. FAL Bulletin 291, 1-8. Comisión Económica para América Latina y el Caribe, Santiago de Chile. [ Links ]
Crevoisier C., C. Sweeney, M. Gloor, J. L. Sarmiento and P. Tans, 2010. Regional US carbon sinks from three-dimensional atmospheric CO2 sampling. P. Natl. Acad. Sci. U.S.A. 107, 18348-18353. [ Links ]
De la Torre A., P. Fajnzylber, J. Nash, 2010. Low-carbon development: Latin American responses to climate change. World Bank, Washington D.C., 175 pp. [ Links ]
Denman, K. L., G. Brasseur, A. Chidthaisong, P. Ciais, P. M. Cox, R. E. Dickinson, D. Hauglustaine, C. Heinze, E. Holland, D. Jacob, U. Lohmann, S. Ramachandran, P. L. da Silva Dias, S. C. Wofsy and X. Zhang, 2007. Couplings between changes in the climate system and biogeochemistry. In: Climate change 2007: The physical science basis. Contribution of Working Group I to the Fourth Assessment Report of the Intergovernmental Panel on Climate Change (S. Solomon, D. Qin, M. Manning, Z. Chen, M. Marquis, K. B. Averyt, M. Tignor and H. L. Miller, Eds.). Cambridge University Press, Cambridge and New York, pp. 499-587. [ Links ]
EC, 2009. Emission Database for Global Atmospheric Research (EDGAR), release version 4.0. European Commission Joint Research Centre/Netherlands Environmental Assessment Agency (PBL). Available at: http://edgar.jrc.ec.europa.eu/index.php. [ Links ]
Ellsaesser H. W., 1990. A different view of the climatic effect of CO2 - updated. Atmósfera 3, 3-29. [ Links ]
Giglio L., G. R. van der Werf, J. T. Randerson, G. J. Collatz and P. Kasibhatla, 2006. Global estimation of burned area using MODIS active fire observations. Atmos. Chem. Phys. 6, 957-974. [ Links ]
Gruber N., Gloor M., Mikaloff Flecther S. E., Doney S. C., Dutkiewicz S., Follows M. J., Gerber M., Jacobson A. R., Joos F., Lindsay K., Menemenlis D., Mouchet A., Muller S. A., Sarmiento J. L., Takahashi T. 2009. Oceanic sources, sinks, and transport of atmospheric CO2. Global Biogeochem. Cy. 23, GB1005. doi:10.1029/2008GB003349. [ Links ]
Hall A., 2011. Getting REDD-Y: Conservation and climate change in Latin America. Lat. Am. Res. Rev. 46, 184-210. [ Links ]
Koizumi H., H. Muraoka and S. Mariko, 2013. Measurement of carbon flux with ecological methods. Available at: http://asiaflux.net/members/dlfiles/tctext/5.MeasurementOfCarbonFluxWithEcologicalMethods.pdf. Houghton R. A., 2007. Balancing the global carbon budget. Ann. Rev. Earth Planet Sci. 35, 3131-347. [ Links ]Kao J., D. Flicker, R. Henninger, S. Frey, M. Ghil, K. Ide, 2004. Data assimilation with an extended Kalman filter for impact-produced shock-wave dynamics. J. Comput. Phys. 196, 705-723. [ Links ]
Krol M., S. Houweling, B. Bregman, M. van den Broek, A. Segers, P. van Velthoven, W. Peters, F. Dentener and P. Bergamaschi, 2005. The two-way nested global chemistry-transport zoom model TM5: Algorithm and applications. Atmos. Chem. Phys. 5, 417-432. [ Links ]
Kronik J. and D. Verner, 2010. Indigenous peoples and climate change in Latin America and the Caribbean. The World Bank, Washington D. C., 131 pp. [ Links ]
Marquis M. and P. Tans, 2008. Carbon Crucible.SCI-ENCE.320, 460-461. [ Links ]
NIMR, 2009. Development and application of methodology for climate change prediction. National Institute of Meteorological Research, Korea Meteorological Administration, p. 596. [ Links ]
NOAA/ESRL, 2013. Carbon Tracker CT2011_oi. Available at: http://www.esrl.noaa.gov/gmd/ccgg/carbontracker/. [ Links ]
NRDC, 2007. Costa Rica: Setting the pace for reducing global warming pollution and phasing out oil. Natural Resources Defense Council. Available at: http://www.nrdc.org/international/costa.pdf.Olivas R., 2010. [ Links ] Latin American policy changes: Investing in renewable energy, climate change and clean technology. Latin American Private Equity and Venture Capital Association. Available at: http://lavca.org/2010/07/13/latin-american-policy-changes-investing-in-renew-able-energy-climate-change-and-clean-technology/. [ Links ]
Park I. S., Y. W. Jang, Y. J. Choi, E. J. Lee, G. W. Lee, 2012. The analyses for variation trend of greenhouse gases concentrations in South America: Focus on CO2 and CH4. Korean Association of Luso-Brazilian Studies 9, 30-47. [ Links ]
Sabine C. L., R. A. Feely, N. Gruber, R. M. Key, K. Lee, J. L. Bullister, R. Wanninkhof, C. S. Wong, D. W. R. Wallace, B. Tilbrook, F. J. Millero, T. H. Peng, A. Kozyr, T. Ono and A. F. Rios, 2004. The oceanic sink for anthropogenic CO2. Science 305, 367-371. [ Links ]
Samar K., F. Primeau and T. Hall, 2009. Reconstruction of the history of anthropogenic CO2 concentrations in the ocean. Nature 462, 346-349. [ Links ]
UPI, 2013. Energy resources: Uruguay deal boosts S. America Wind Power. United Press International. Available at: http://www.upi.com/Business_News/Energy-Resources (last accessed on March 18, 2013). [ Links ] West S. E. and A. Wolverton, 2005. Market-based policies for pollution control in Latin America. In: Environmental Issues in Latin America and the Caribbean (A. Romero and S. E. West, Eds.). Springer, Netherlands, 121-147. [ Links ]
World Bank, 2009. Climate Change Aspects in Agriculture. Mexico country note. Available at: http://siteresources.worldbank.org/INTLAC/Resources/257803-1235077152356/Country_Note_Mexico.pdf. [ Links ]

