


Services on Demand
Journal
Article
 English (pdf)
 Article in xml format
 Article references
 Send this article by e-mail
Indicators
-
 Cited by SciELO
 -
 Access statistics
Related links
-
 Similars in
SciELO
Similars in
SciELO
Share

 Permalink
Atmósfera
Print version ISSN 0187-6236
Atmósfera vol.27 n.1 Ciudad de México Jan. 2014
Dispersion of atmospheric coarse particulate matter in the San Luis Potosí, Mexico, urban area
LUIS F. PINEDA-MARTÍNEZ
Ciencias de la Tierra, Universidad Autónoma de Zacatecas, Jardín Juárez 147, Centro Histórico, 98000 Zacatecas, Zacatecas, México Corresponding author; e-mail: luisfpm23@gmail.com
NOEL CARBAJAL
Instituto Potosino de Investigación Científica y Tecnológica, A. C., Camino a la Presa San José 2055, Lomas 4a Sección, 78216 San Luis Potosí, S.L.P., México
ARTURO CAMPOS-RAMOS and ANTONIO ARAGÓN-PIÑA
Instituto de Metalurgia, Universidad Autónoma de San Luis Potosí, Avenida Sierra Leona 550, Lomas 2a Sección, 78210 San Luis Potosí, S.L.P., México
AGUSTÍN R. GARCÍA
Centro de Ciencias de la Atmósfera, Universidad Nacional Autónoma de México, Circuito de la Investigación s/n, Ciudad Universitaria, 04510 México, D.F., México
Received January 14, 2013; accepted August 11, 2013
RESUMEN
La contaminación atmosférica en áreas urbanas de México se ha convertido en un problema grave. Por ello, el estudio de la evolución espacial y temporal de las concentraciones del material particulado es un asunto importante. En el periodo de mayo de 2003 a abril de 2004 se recolectó un total de 188 muestras diarias con un equipo de alto volumen en el área urbana de San Luis Potosí, ubicada en la parte centro-norte de México, usando filtros de fibra de cuarzo. Se realizó una serie de experimentos de modelación numérica en el mismo periodo que las mediciones, para investigar las concentraciones de material particulado (PM) en dicha área urbana. Aunque hay una considerable variabilidad anual en la circulación atmosférica, el análisis de los resultados indica patrones de circulación estacionales preferenciales: vientos del suroeste en invierno y vientos del sureste en verano. Los altos valores de concentración de material particulado estuvieron estrechamente vinculados con características locales de la circulación atmosférica. El transporte neto de la zona industrial es una de las más importantes conclusiones de la investigación.
ABSTRACT
Atmospheric pollution in urban areas of Mexico has become a serious problem. The study of spatio-temporal evolution of concentrations of particulate matter is an important issue. A total of 188 samples were randomly collected at 24-hour running time within the period from May 2003 to April 2004 for the San Luis Potosí urban area, located in the central-north part of Mexico, using quartz fiber filters. A series of numerical modeling experiments were conducted for the same period of measurements to investigate particulate matter (PM) concentrations in the above-mentioned urban area. Although there is a considerable annual variability in the atmospheric circulation, the analysis of results indicates preferential seasonal circulation patterns: southwesterly winds during winter and southeasterly during summer. High concentration values of particulate matter were closely associated to local characteristics of the atmospheric circulation. A net transport from the industrial zone into the urban area is one of most important outcomes of the investigation.
Keywords: Particulate matter, dispersion model, particle characterization, air quality.
1. Introduction
There is considerable uncertainty about the effects of atmospheric particulate matter (PM) on the global climate. Hence, it is important to know the physical and morphological characteristics of PM and to evaluate the dispersion phenomena that contribute to the presence of high concentrations of particulate matter in the atmosphere and particularly in urban areas (Campos-Ramos et al., 2011). Atmospheric particles may be solid or liquid particles that are incorporated into the atmosphere by natural and anthropogenic emission sources. Atmospheric processes and multi-source origins tend to generate a complex mixture of aerosol components of different chemical and physical characteristics. The origin and transport mechanisms of particles give information about final properties, since the particles are continuously controlled by physical and chemical processes that influence composition, shape and distribution (Korhonen et al., 2004). PM effects on atmospheric pollution have been documented in fields including health, physics and chemistry, which highlight the relation between the exposure to these contaminants and various health impacts, such as cardiovascular and respiratory diseases (WHO, 2002).
Previous studies on the urban area of San Luis Potosí (UASLP), Mexico, have revealed some morphological characteristics and chemical composition of particles that originate from mining-metallurgical activities (Aragón-Piña et al., 2000, 2002) and from the industrial zone (Aragón-Piña et al., 2006). In these studies, high concentrations of heavy metals such as lead and arsenic surrounding the metallurgical industrial zone have been reported. Additionally, high concentrations of calcium sulfate and fluorite coming from industrial wastes have been documented. Nevertheless, these studies do not consider atmospheric circulation, pollutant dynamics or the effects of the topography.
The regional circulation and wind patterns are important factors in the particles dispersion that determine their main mechanisms of transport and deposition. The final product of these processes is a heterogeneous spatial distribution (Querol et al., 2004). Atmospheric circulation should be considered whenever an air quality monitoring location is selected. In this study, we applied the Mesoscale Model of fifth generation (MM5) (Grell et al., 1994) and the Multiscale Climate Chemistry Model (MCCM) (Grell et al., 2000) to investigate air quality aspects of an urban area in Mexico.
The UASLP comprises a population of more than one million, a large number of vehicles and an industrial zone (IZ) of around 253 factories (Fig. 1b). In the western part of the city there are several foundries with an intense melting activity. In the industrial zone, located in the southern side of the UASLP, there is an important number of companies, such as automotive assembly plants, foundries, steel and non-ferrous metal manufacturing, and chemical industries. Recently, both industrial activities and the expansion of the urban zone have increased, which stresses the importance of air quality concerns. The emission of airborne particulate matter represents a complex mixture of organic and inorganic substances. Nevertheless, there are only a few studies on air quality in the UASLP that propose strategies to control pollution problems associated with the emission of particulate matter (Leyva et al., 1996). Thus, there is interest in understanding the emission, dispersion, deposition, and physicochemical characteristics of atmospheric particulate matter. There is evidence that atmospheric particle concentrations exceed the Mexican standards several times each year (Aragón-Piña et al., 2006; SINAICA, 2008). In this research work, a numerical study was carried out in order to calculate the spatial distribution of atmospheric particles generated in the industrial zone from May 2003 to April 2004. Considering sources that affect and influence air quality, calculated and observed, data were compared for several points of the UASLP.
2. Experimental setup and modeling
2.1 Study area
The UASLP is located at 22.15° N and 100.98° W in the central part of Mexico (Fig. 1a), within the San Luis Potosí valley, which is surrounded by two mountain ranges that work as natural barriers channeling wind between Sierra San Miguelito on the west side of the city and Sierra de Alvarez to the east. Its climate is arid with a rainy season in the summer. The valley is approximately 1877 masl; it is topographically flat and orientated in a southwest-northeast direction (Fig. 1b) (Pineda-Martínez et al., 2007).
2.2 Measurements and characterization of PM10
Four sampling sites were established for monitoring in the UASLP. Three stations were established in the industrial zone: Bachoco (B), Ximonco (X), and Profepa (P), and another one was installed in an area with extensive vegetation inside the Tangamanga Park (TG) (Aragón-Piña et al., 2006). This last station was located in a zone without direct influence of the principal pollutant sources (Fig. 1b). Samples were randomly collected at 24-hour running time with an airflow capacity of 76-78 m/h, within the period from May 2003 to April 2004. The number of collected samples in the above mentioned period, at the different sites, was the following: TG = 44, P = 46, X = 54, and B = 44. Samples were collected with a high volume Andersen equipment using quartz fiber filters. The filters were stabilized before and after sampling at 23 ± 2 °C and 40 ± 5% relative humidity. Bulk PM10 levels were obtained by weighing the filters with standard procedures (NOM-035-ECOL, 1993).
A fraction of the total collected samples was obtained with a Total Suspended Particle (TSP) air sampling system (Staplex®). Since our aim is to model the PM10 fraction, it was necessary to obtain a size distribution. To determine the contribution of particles with aerodynamic diameter smaller than 10 pm by means of a scanning electron microscope (SEM), 65 samples were randomly selected from the total set. Each filter was analyzed separately in four quadrants for individual counting of approximately 40 000 particles of all analyzed samples, as described by Campos-Ramos et al. (2010). The particles were classified in three different sizes of aerodynamic diameter: < 2.5, 2.5-10 and > 10 μm.
In these samples we determined the most abundant anthropogenic particles. To assess the chemical composition and morphology of individual particles, we applied the methodology described by Aragón et al., (2002). This process consists of an analysis using a SEM (Phillips XL30) coupled with an energy dispersed spectrometry (EDS) microanalysis (EDAX DX4), with a detection limit lower than 0.1%. Additionally, we used a sensor of energy dispersive X-ray microanalysis (EDX) coupled with a SEM to characterize the most important crystalline phases present in the collected atmospheric dust. The main objective was to identify particles already observed by Aragon et al., (2006) in our samples collected at the TG station within the industrial zone. This will give us information about the influence of industrial emissions on the urban area.
2.3 Air quality model
We calculated atmospheric circulation using the Mesoscale Model version 5 (MM5) developed by the Pennsylvania State University and the National Center for Atmospheric Research (NCAR). The MM5 is a non-hydrostatic, three-dimensional and prognostic numerical model (Grell et al., 1994). The sigma (<j) coordinate is considered in the basic equations of the model to determine vertical levels. MM5 settings included the parameterization for convection by Grell et al. (1994), the Blackadar boundary layer scheme, the radiation scheme of Dudhia (1989), and the microphysics of Schultz (1995).
In order to obtain information on the distribution of particles under the prevailing meteorological conditions in the UASLP, we applied the Multi-scale Climate Chemistry Model (MCCM), which is coupled with the MM5 (Grell et al., 2000). With the exception of the soil scheme included in the MCCM, the circulation and in general the dynamics are calculated with the MM5 model. All transport of chemical species is done on-line. The MCCM model includes two detailed mechanisms of the gas phase for chemical species (Stockwell et al., 1995). Particulate matter is included as a passive tracer. The model simultaneously calculates meteorological and chemical changes in the model domain and generates three-dimensional time-dependent distributions of major inorganic and organic species. The regional acid deposition model version 2 (RADM2) included in MCCM (Stockwell et al., 1990) is widely used in atmospheric models to predict concentrations of oxidants and other air pollutants (Grell et al., 2000). The on-line coupling of meteorology and chemistry provides fully consistent results with no interpolation of data in contrast to off-line coupled chemistry and transport models. This means that the model simultaneously calculates meteorological and chemical changes in the domain model and generates the time-dependent three-dimensional distributions of major organic and inorganic compounds.
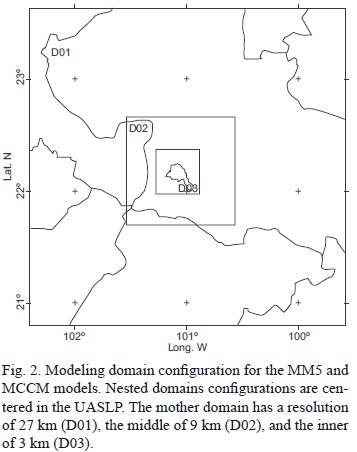
2.4 Model domains
A one-way nested mother domain (D01 in Fig. 2) was established at central coordinates 21° 30' N and 101° 15' W, with a horizontal grid resolution of 27 km on 30 x 30 grid points. A second domain (D02) was defined, nested with a 9 km horizontal resolution on 31 x 31 grid points. The inner domain (D03) had a resolution of 3 km on 37 x 37 grid points. The PM10 dispersion was computed for domain D03. We applied a vertical high resolution of 27 sigma levels with emphasis in a better resolution near the surface and with an increasing thickness until a pressure level of 100 mb.
The model was initiated with the National Centers for Environmental Prediction (NCEP) reanalysis data (Kalnay et al., 1996). This dataset is based on observational and global reanalysis models with temporal resolutions of 6 h and 28 sigma vertical levels. The numerical simulation was initialized at 00Z with a duration of 15 days and outputs every 3 h. Additionally, daily averages were calculated. The original land use categories (25-Land USGS) in the model were modified to include the entire UASLP in the inner domain (D03).
2.5 Emission model
Due to lack of information about emissions and principal sources of pollutants in the UASLP, it was necessary to apply a better way to introduce emission data into the model. The Inventario Nacional de Emisiones (national emissions inventory, NEI) was carried out in 1999 (INE, 2006), where a value of 2053.4 Mg/year of PM10 was reported for UASLP without natural sources included. These data were a simple estimation of emissions based on the number of inhabitants. Values of the NEI were introduced in every model grid of urban land categories as an initial condition. A preliminary run of 15 simulated days for April 2004 was performed to validate the measurements and inventory data. This period was selected because the atmospheric dynamic is more stable in terms of wind circulation and thermal contrast. These conditions allow to evaluate the PM10 concentration, which is largely controlled by local circulation (Pineda-Martínez and Carbajal, 2009). The NEI estimated emission rate for UASLP was 16.2 (kg/km2/h). This value, given as an initial condition in the model, yielded a maximum concentration of about 62 μg/m3 in the evolution of concentrations. This value was very low in comparison with the estimated means of measured data. An additional adjustment was carried out in the initial conditions for hourly emission data (Fig. 3a). In the UASLP, the data show a bimodal distribution, but only a major concentration early in the morning and a lower peack during the afternoon. The behavior mostly depends on the traffic conditions in urban areas. The behavior displayed in Figure 3a is expected in Mexico, as discussed by Tzintzún-Cervantes et al. (2005).
Information about individual sources is an important component for emission estimates. Unfortunately, there is not enough information about emission rates for individual points and linear (roads) sources, therefore this research attempts to give a point of reference for future research and air quality concerns. Accordingly, an increased emission rate was introduced for those grids corresponding to the industrial area and major high traffic roads (Fig. 3b). The results of these experiments are described below.
3. Results
3.1 Atmospheric circulation
To contextualize atmospheric circulation in the UASLP, it is necessary to consider two fundamental features: the synoptic circulations and local factors. In the first case, winter cold fronts propagate through the plains of the central-southeast region of the USA in a cyclonic motion, advancing southwards into Mexico (Fig. 4a). Some cold fronts reach Mexico through the coastal plains of the Gulf of Mexico, moving forward through the eastern Sierra Madre to the highlands. This synoptic situation is dominated by westerly circulation causing regional winds flowing from the southwest in the valley of San Luis Potosí (Schultz et al., 1998; Cavazos, 1999). Guided by the foothills of the San Miguelito mountain range, the flow of cold air masses is channeled and intensified by the complex topography in the highlands as the front progresses to the central part of Mexico. Another important feature is that the circulation associated with most of these cold air masses coincides with the direction ofthe westerly jets in the upper troposphere, producing a channeling in lower levels into the central plains through the lowlands of the Sierra Madre. Thus, channeled winds flow dominantly from the west-southwest, although this feature varies for each event (Pérez 1996; Magaña et al., 1999; Pineda-Martínez et al., 2007).
In summer, the upper westerly jet disappears (Cavazos and Hastenrath, 1990) and trade winds are dominant, flowing into the highland through the eastern Sierra Madre in the lower layers of the atmosphere. This prevailing synoptic configuration is intermittently modified by cyclonic systems and tropical waves propagating along the coastal areas of the Gulf of Mexico and affecting the circulation patterns landwards (Fig. 4b). From this general circulation analysis, we state that in summer, southerly and southeasterly winds flow consistently through the UASLP. Therefore, the hypothesis of a preferential transport of PM10 from the southeast to the northwestern part of the UASLP, guided by the foothills of the San Miguelito mountain range, is presented.
A second and even more dominant circulation pattern is related to local effects like convergence and divergence processes produced by mountain-valley circulation in the UASLP. The convergence induced by that circulation causes regional easterly winds and a recirculation in the UASLP that is unfavorable for the dispersion and transport of atmospheric particulate matter beyond the urban area.
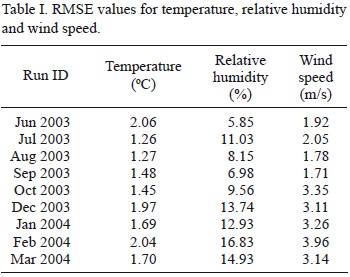
3.2 Evaluation of model performance for meteorological fields
Results of the numerical modeling have been compared with measurements carried out at a surface meteorological station placed in the UASLP (22°10' N, 100° 59' W). The root mean square error (RMSE) and mean bias (MB) were calculated for the inner domain (D03). To do this, we calculated daily means from hourly values of temperature, relative humidity and wind speed. Table I presents a summary of RMSE values among model outputs and observed data. The estimated RMSE for monthly averages are ofthe same order as those reported in other works (Jazcilevich et al., 2002). Taking into account all numerical experiments, the RMSE means were: 2.7 m/s for wind speed, 1.66 °C for temperature, and 11.11% for relative humidity. Considering the results showed in Table I, all parameters showed an acceptable precision.
In Figure 5 we present the mean bias deviation for modeled meteorological data (temperature, relative humidity and wind speed) for the modeling period.
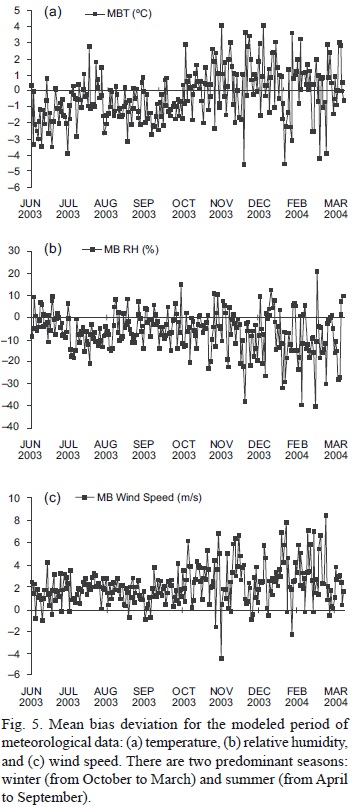
It is possible to distinguish two predominant behaviors: winter and summer. We have already mentioned that circulation in these two periods is influenced by synoptic motion and local and regional effects on dynamics and thermodynamics. For instance, while in summer the thermal contrast is small: from 10-15 °C at night to 28-31 °C during the day (~15 °C), in winter it is considerably larger: from 2-8 °C at night to 20-26 °C during the day (~20 °C). Numerical models are deficient in capturing these sudden variations due mainly to surface properties such as soil moisture availability (Hanna and Yang, 2001; Pineda-Martínez and Carbajal, 2009). This feature is observed in MB values for the two principal seasons in the UASLP, with larger variations during the dry-cold months.
Wind direction has been treated in a different way. Several authors have discussed that validation of calculated wind directions with numerical models is quite complicated (Lee and Fernando, 2004). In general, wind statistics and particularly wind direction are calculated for wind velocities higher than 0.5 m/s, since wind direction is not reliable for lower velocities. The computation of statistical parameters is straightforward for wind speed and temperature, but the circular nature of wind direction makes it difficult to obtain the corresponding statistics. To avoid this problem, we have used a qualitative comparison of wind roses based on frequencies of modeled and observed data from hourly values (Fig. 6).
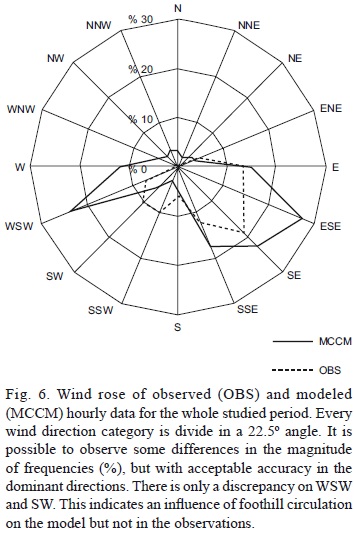
The large wind values on the WSW component indicate a great influence of the mountain-valley circulation in the model. In addition, the high variability and low wind speeds in Figure 6 suggest the presence of an active convective mixing (Lee and Fernando, 2004). As pointed out by Hanna and Yang (2001), due to random (stochastic) or turbulent fluctuations, the reduction of uncertainties of near-surface wind modeling is a difficult task, even with significant improvements in models.
3.3 Evaluation of the dispersion model
Statistical metrics for the dispersion model are calculated for surface PM10 concentrations at six measurement sites in the grid-modeling domain D03. The model results were evaluated using statistical parameters such as root mean square error (RMSE),
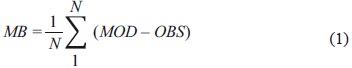
the mean bias (MB),
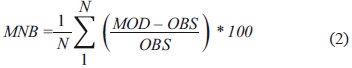
the mean normalized bias error (MNB),
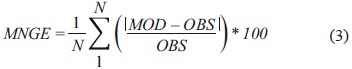
the mean normalized gross error (MNGE),
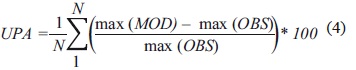
and the unpaired peak accuracy (UPA) (Boylan and Russell, 2006; EPA, 2007). These statistics are summarized in Table II.
4. Discussion
4.1 Observed data
The PM10 annual mean concentration was of 107.9 μg/m3, which exceeds the maximum recommended guideline values of the Mexican official standard and the World Health Organization of 90 and 75 μg/m3, respectively (NOM-035-ECOL, 1993; WHO, 2002). This value also exceeds PM10 annual concentrations reported in the same period for large urban agglomerations like the Mexico City metropolitan area (66 μg/m3), the city of Guadalajara (51 μg/m3), and the Monterrey metropolitan area (81 μg/m3) (SINAICA, 2008). As expected, high concentrations of particulate matter are observed in dry cold periods from November 2003 to February 2004 (Fig. 7). This is probably associated with high wind intensity (> 7 m/s), which favors fugitive dust and, mainly, local re-suspension.
Figure 7 shows a time series of modeled and measured particulate matter at TG, P, X, and B stations (Fig. lb). Daily data of PM10 give us important information about the relationship among concentrations and geographic and circulation conditions. Overall, PM10 levels are significantly lower during the summer (May to September) than in the winter cold period (November to April). Since additional sources were not considered in the numerical modeling, this result may be attributed to the influence of local weather conditions. Figure 7 includes distinctive events with very high concentrations measured during the summer rainy season. By analyzing this period, the events were related to low values of wind speed and to the influence of a warm and humid air mass coming from the west. In general, in this warm and wet period, the behavior was well captured by the numerical simulation at the different control points, except at Xi-monco site, where the model failed to simulate the very high concentration observed (Fig. 7c). There are more high concentrations events in winter than in summer, a fact the model is able to reproduce. Particularly, a series of isolated events of very high concentrations measured under strong winds conditions from November 2003 and February 2004 were reasonably well captured by the model. Although it is very difficult to establish exactly the specific sources, an additional PM10 background concentration in the model produced an increase of concentrations (not shown). This indicates the need for simulating every single event separately in order to establish the contribution of fugitive dust and of re-suspension processes. Probably, it would be convenient to establish an additional inventory of external sources, but that was not the aim of this study.
4.2 Horizontal distribution of PM10
The San Luis Potosí valley shows a complex pattern of wind currents that converge and diverge due to topographic effects and regional atmospheric circulation. For example, on October 27 and November 5, 2003, high concentration events occurred under northerly winds. Low temperatures and high values of relative humidity indicated the presence of an incoming cold front. This circulation favors the accumulation of particle matter in the southern part of the city, mostly due to the mountain barrier and to easterly winds that converge with the northerlies. PM10 concentration values on December 2003 were above 200 μg/m3 during seven days of the month (Fig. 7). At this time of the year there are more events with strong winds and gusts that reach speeds higher than 10 m s-1 in short intervals, but sufficiently strong to re-suspend large amounts of suburban dust, originating very high concentrations of these materials. These winds are channeled in the northeast direction towards the city by the topographical configuration at the southwestern side of the UASLP (Fig. 8; see also Fig. 1b). Maximum atmospheric concentrations occurred during calm periods, caused by accumulation and entrainment processes.
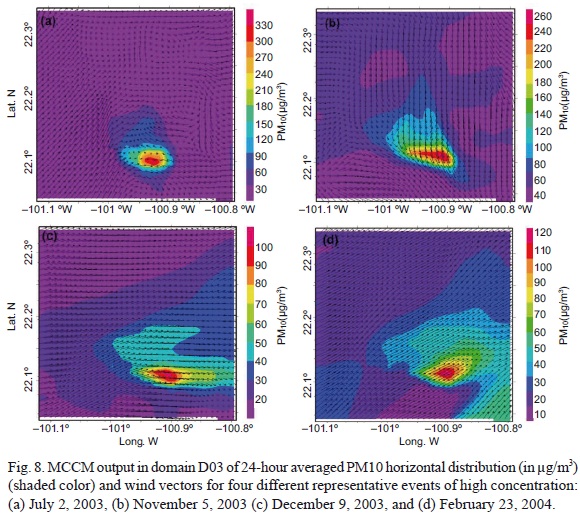
Maximum wind speeds occur regularly in January and February (Fig. 8d), and winds with less intensity and frequency take place in March (Pineda-Martínez and Carbajal, 2009). At this time of the year there is a major incidence of dust in the northern region of Mexico. Since it is a period of drought, the incidence of strong winds significantly increases the re-suspension of agricultural and suburban dust in the surroundings of the UASLP (Fig. 8b, c, d). Statistically, the largest numbers of extreme wind events take place in February (Pineda-Martínez et al., 2007). An example of these events occurred on February 23, 2004. The numerical simulation of this event showed that westerly winds flowed strongly through the UASLP. This phenomenon is prevalent and dominates over local circulation contributions. Under these conditions, convergence and divergence processes induce high turbulence and vorticity by friction in the urban area, characterized by a thermal contrast with bare soil properties. The generated turbulence contributes to the urban dispersion of emissions (Jazcilevich et al., 2002; Choi and Fernando 2008). In summer, convergence and divergence areas occur most frequently (Fig. 8a).
4.3 Vertical dispersion
Figure 9 shows two examples of how vertical dispersion occurs under different seasonal conditions. In summer there is a major dispersion of pollutants because the turbulence and thickness of the boundary layer is much larger than in winter (Fig. 9a). In winter, the atmospheric stability in presence of cold air masses leads to accumulation of PM10 in lower layers (Fig. 9b). Clearly, the height of the PM10 plume is higher in summer than in winter.
The annual overall atmospheric pollutant background concentrations in the UASLP are caused mainly by industrial activities, transportation and re-suspension from roads by vehicular traffic (Leyva et al., 1996; Aragón-Piña et al., 2006). Measurements reveal that this situation is enhanced in the dry season from October to March by suburban sources.
Results of the numerical modeling show that atmospheric stability increases and the boundary layer decreases in height during this period, caused mainly by the presence of cold air masses and the reduction of incoming solar radiation. This leads to accumulation and higher concentrations of PM10. As has been established, atmospheric circulation in the UASLP is quite variable throughout the year, but shows seasonal preferential patterns: southwesterly winds in winter and southeasterly winds during the summer (Fig. 6) (Pineda-Martínez and Carbajal, 2009). However, monthly averages for the two specified seasons reveal that overall prevailing winds flow from the southeast during winter (Fig. 10a) and summer (Fig. 10b). Presenting monthly means is important to focus this research in terms of the spatio-temporal distribution of urban PM 10 and its relation to regional circulation.
4.4 Characterization of atmospheric particles
We carried out a characterization of physical and chemical properties of collected atmospheric particles. These samples are compared with those reported by Aragón-Pina et al. (2006), who collected particles directly at chimneys and indoors in some specific industries such as the metal-mechanic industry, paint production, automotive assembly, steel processing, steelmaking, and electronic devices manufacturing. These sub-samples were previously collected simultaneously with those of the monitoring stations. The main objective of analyzing this supplementary information was to obtain a reference point for comparing samples of PM found in the sampling field stations, in order to distinguish particles of anthropogenic origin from natural ones. In previous studies done in San Luis Potosí, some characteristics of collected particulate matter have been reported from SEM analysis (Aragón-Piña et al., 2006). They showed that natural particles exhibited morphological characteristics such as pollen and spores or mineral particles with well-defined angles, while the anthropogenic ones presented irregular or spherical morphology and were generally associated with heavy elements. In addition, particles such as quartz (SiO2), calcite (CaCO3), and fluorite (CaF2) have been reported from wastes of mining activities. Similarly, anthropogenic particles rich in iron, carbon-sulfur, calcium, copper, lead and arsenic are generated by sources such as steel manufacturing, copper smelters, and the tire industry.
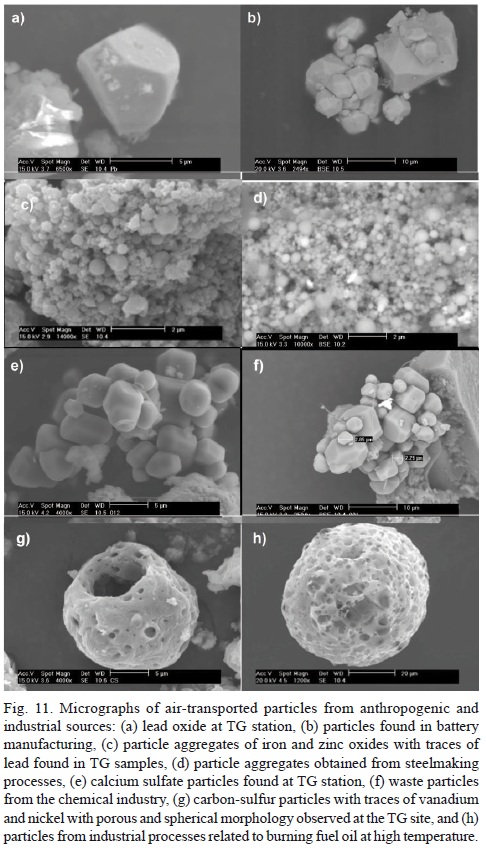
Figure 11 shows a series of micrographs of airborne particles found at the TG station (left side) and emitted particles from specific industrial sources (right side) (Aragón-Piña et al., 2006). The analyzed particles in samples collected at the TG site agree quite well with those captured in sub-samples from industrial sources. Some particles of metallic lead were found at the TG station presenting typical sharp edges and angles, which originate in the manufacture of batteries (Fig. 11a, b). The particle aggregates of iron and zinc oxides with ultrafine sizes (less than 0.5 pm) were also observed at the TG station. These originate in steelmaking processes (Fig. 11c, d). Particles of calcium sulfate showing a prismatic morphology that originate in the chemical industry and produce sulfuric acid were also found out at the TG station (Fig. 11e, f). Finally, particles of carbon-sulfur with traces of vanadium and nickel with porous and spherical morphology were also observed at the TG site (Fig. 11g, h). These particles are related to burning fuel oil at high temperatures in industrial processes. The presence of all these particles at the TG station is explained by the transport from the IZ to the UASLP, since no other industrial sources could generate these kinds of pollutants near the TG sample station. This transport agrees well with our estimations.
5. Conclusions
In this study we present a detailed analysis of the transport and concentrations of PM10 in the urban area of San Luis Potosi, Mexico. Not much is known about the effects of atmospheric circulation on the transport of pollutants, particularly atmospheric particulate matter, in the fast growing urban areas of Mexico. The annual mean concentration of PM10 in the UASLP was of the order of 107.9 μg/m3. The characteristics of anthropogenic particles found at the TG station are directly related to the particles originating in the IZ. It was possible to identify and to relate particles by SEM-EDS techniques with specific sources. Additionally to vehicular and geological sources, the UASLP industrial zone contributes significantly to air pollution in the city through high concentrations of PM10. The local atmospheric circulation plays an important role in the transport of particles from the IZ towards the UASLP. Topographic natural forcings, induced convergence and divergence motions may produce an increase in PM10 concentration and greater dispersion. The numerical modeling of atmospheric circulation and of the high concentration of PM10 leads us to conclude that the effects of unfavorable air circulation cause a decrease in air quality in the UASLP. As a final remark, a real emission inventory is necessary to understand the atmospheric particle dynamics. This study attempts to give a point of reference for future research.
References
Aragón Piña A., G. Torres Villaseñor, M. Monroy Fernández, A. Luszczewski Kudra and R. Leyva Ramos, 2000. Scanning electron microscope and statistical analysis of suspended heavy metal particles in in San Luis Potosí, Mexico. Atmos. Environ. 34, 4103-4112. [ Links ]
Aragón Piña A., G. Torres Villaseñor, P. Santiago Jacinto and M. Monroy Fernández, 2002. Scanning and transmission electron microscope of suspended lead rich particles in the air of San Luis Potosi, Mexico. Atmos. Environ. 36, 5235-5243. [ Links ]
Aragón-Piña A., A. A. Campos Ramos, R. Leyva Ramos, M. Hernández Orta, N. Miranda Ortiz and A. Luszczewski Kudra, 2006. Influencia de emisiones industriales en el polvo atmosférico de la ciudad de San Luis Potosí, México. Rev. Int. Contam. Ambient. 22, 5-19. [ Links ]
Boylan J. W. and A. G. Russell, 2006. PM and light extinction model performance metrics, goals, and criteria for three-dimensional air quality models. Atmos. Environ. 40, 4946-4959. [ Links ]
Campos-Ramos A. A., A. Aragón Piña, A. Alastuey, I. Galindo Estrada and X. Querol, 2011. Levels, composition and source apportionment of rural background PM10 in western Mexico (state of Colima). Atmospheric Pollution Research, doi:10.5094/APR.2011.046. [ Links ]
Campos Ramos A. A., A. Aragón Piña, X. Querol and A. Alastuey, 2010. Methodology for the characterization and identification by SEM-EDS of atmospheric particles from different pollutions emission. Microscopy: Science, Technology, Applications and Education 1, 329-333. [ Links ]
Cavazos T. and S. Hastenrath, 1990. Convection and rainfall over Mexico and their modulation by the Southern Oscillation. Int. J. Climatol. 10, 377-386. [ Links ]
Cavazos T., 1999. Large-scale circulation anomalies conducive to extreme precipitation events and derivation of daily rainfall in northeastern Mexico and southeastern Texas. J. Climate. 12, 1506-1523. [ Links ]
Choi Yu-Jin and H. J. S. Fernando, 2008. Implementation of a windblown dust parameterization into MODELS-3/CMAQ: Application to episodic PM events in the US/Mexico border. Atmos. Environ. 42, 6039-6046. [ Links ]
Dudhia J., 1989. Numerical study of convection observed during the winter monsoon experiment using a mesoscale two-dimensional model. J. Atmos. Sci. 46, 3077-3107. [ Links ]
Grell G. A., J. Dudhia and D. R. Stauffer, 1994. A description of the fifth-generation Penn State/NCAR meso-scale model (MM5). NCAR Technical Note NCAR/ TN-398+STR. Boulder, Colorado. [ Links ]
Grell G. A., S. Emeis, W. R. Stockwell, T. Schoenemeyer, R. Forkel, J. Michalakes, R. Knoche and W. Seild, 2000. Application of a multiscale, coupled MM5/ chemistry model to the complex terrain of the VOLTAP valley campaign. Atmos. Environ. 34, 1435-1453. [ Links ]
Hanna S. R. and R. Yang, 2001. Evaluations of mesoscale models' simulations of near-surface winds, temperature gradients, and mixing depths. J. Appl. Meteor. 40, 1095-1104. [ Links ]
INE, 2006. Inventario Nacional de Emisiones 1999. Secretaría de Medio Ambiente y Recursos Naturales, Instituto Nacional de Ecología, Mexico, 380 pp. [ Links ]
Jazcilevich A. D., A. R. García and L. G. Ruiz-Suárez, 2002. A modeling study of air pollution modulation through land-use change in the Valley of Mexico. Atmos. Environ. 36, 2297-2307. [ Links ]
Kalnay E., M. Kanamitsu, R. Kistler, W. Collins, D. Deaven, L. Gandin, M. Iredell, S. Saha, G. White, J. Woollen, Y. Zhu, A. Leetmaa, B. Reynolds, M. Chelliah, W. Ebisuzaki, W. Higgins, J. Janowiak, K. Mo, C. Ropelewski, J. Wang, R. Jenne and D. Joseph, 1996. The NCEP/NCAR 40-year reanalysis project. Bull. Amer. Meteor. Soc. 77, 437-471. [ Links ]
Korhonen H., K. Lehtinen and M. Kulmala, 2004. Aerosol dynamics model UHMA: Model development and validations. Atmos. Chem. Phys. 4, 757-771. [ Links ]
Lee S. M. and H. J. S. Fernando, 2004. Evaluation of meteorological models MM5 and HOTMAC using PAFEX-I data. J. Appl. Meteor. 43, 1133-1148. [ Links ]
Leyva R. A., A. Luszczewski Kudra, J. M. Monsiváis, H. C. Flores and M. G. Hernández, 1996. Muestreo local de aire en San Luis Potosí (zona industrial minera). Proceedings of the Second Inter-American Environmental Congress. ITESM, Mexico, pp. 180-183. [ Links ]
Magaña V., J. Amador and S. Medina, 1999. The mid-summer drought over Mexico and Central America. J. Climate. 12, 1577-1588. [ Links ]
NOM-035-ECOL, 1993. Métodos de medición para determinar la concentración de partículas suspendidas totales en el aire ambiente y el procedimiento para la calibración de los equipos de medición. SEDESOL, Mexico. [ Links ]
Pérez G. I., 1996. Major cold air outbreaks affecting coffee and citrus plantations in the eastern and northeastern Mexico. Atmósfera. 9, 47-68. [ Links ]
Pineda-Martínez L. F., N. Carbajal and E. Medina-Roldán, 2007. Regionalization and classification of bioclimatic zones applying principal components analysis (PCA) in the central-northeastern region of México. Atmósfera. 20, 111-222. [ Links ]
Pineda-Martínez L. F. and N. Carbajal, 2009. Mesoscale numerical modeling of meteorological events in a strong topographic gradient in the northeastern part of Mexico. Clim. Dyn. 33, 297-312. [ Links ]
Querol X., A. Alastuey, S. Rodríguez, M. M. Viana, B. Artiñano, P. Salvador, E. Mantilla, S. García do Santos, R. Fernyez Patier, J. de la Rosa, A. Sanchez de la Campa and M. Menéndez, 2004. Levels of PM in rural, urban and industrial sites in Spain. Sci. Tot. Environ. 334-335, 359-376. [ Links ]
Schultz P., 1995. An explicit cloud physics parameterization for operational numerical weather prediction. Mon. Wea. Rev. 123, 3331-3343. [ Links ]
Schultz D. M., W. E. Bracken and L. F. Bosart, 1998. Planetary and synoptic-scale signatures associated with Central American cold surges. Mon. Wea. Rev. 126, 5-27. [ Links ]
SINAICA, 2008. Sistema Nacional de Información de la Calidad del Aire. Instituto Nacional de Ecología, Mexico. Available at: http://sinaica.ine.gob.mx. [ Links ]
Stockwell W. R., R. P. Middleton, J. S. Chang and X. Tang, 1990. The second-generation regional acid deposition model chemical mechanism for regional air quality modeling. J. Geophys. Res. 95, 16343-16367. [ Links ]
Tzintzún Cervantes M., L. Rojas Bracho and A. Fernández Bremauntz, 2005. Las partículas suspendidas en tres grandes ciudades mexicanas. Gaceta Ecológica 74, 15-28. [ Links ]
EPA, 2007. Guidance on the use of models and other analysis for demonstrating attainment of air quality goals for ozone, PM2.5 and regional haze. US Environmental Protection Agency. Research Triangle Park, North Carolina, 253 pp. [ Links ]
WHO, 2002. Guidelines for concentration and exposure-response measurement of fine and ultra fine particulate matter for use in epidemiological studies (D. Schwela, L. Morawska, D. Kotzias, Eds.). World Health Organization, Geneva, 184 pp. [ Links ]

