


Servicios Personalizados
Revista
Articulo
 Inglés (pdf)
 Artículo en XML
 Referencias del artículo
 Enviar artículo por email
Indicadores
-
 Citado por SciELO
 -
 Accesos
Links relacionados
-
 Similares en
SciELO
Similares en
SciELO
Compartir

 Permalink
Atmósfera
versión impresa ISSN 0187-6236
Atmósfera vol.26 no.4 Ciudad de México oct. 2013
Variability of precipitation and temperature in Guanajuato, Mexico
B. S. BARRETT
Oceanography Department, U. S. Naval Academy, 572C Holloway Rd., Annapolis, MD 21402 Corresponding author; e-mail: bbarrett@usna.edu
M. I. ESQUIVEL LONGORIA
Centro de Ciencias Atmosféricas, Universidad de Guanajuato, Guanajuato, México
Received January 7, 2013; accepted July 24, 2013
RESUMEN
Se analizó la variabilidad de precipitación y temperatura en múltiples escalas de tiempo utilizando datos de cinco estaciones de observación en superficie localizadas en el centro del estado de Guanajuato, México, así como datos del reanálisis regional de Norteamérica (NARR, por sus siglas en inglés). Los resultados indican que no se encontró incremento en la frecuencia del número de días con precipitación que excedan el percentil 90 durante el periodo 1979-2011; sin embargo, la frecuencia del número de días con temperatura máxima superior al percentil 90 se incrementó más de dos veces en ese mismo periodo, y la frecuencia en el número de días con temperatura máxima inferior al percentil 10 disminuyó casi a la mitad en el mismo periodo, lo que da como resultado la escasa disponibilidad de agua para la actividad económica basada en la agricultura. Se encontró además que la precipitación dentro de la temporada varía de acuerdo con la fase en la que se encuentre la oscilación Madden-Julian (MJO, por sus siglas en inglés). Se observó que cuando se presentan las fases 1-3 de la MJO la precipitación es superior a la normal y cuando se presentan las fases 4-7 de la MJO es inferior a la normal. Las anomalías de precipitación, presión, viento y temperatura tanto a nivel superficial como a una altura geopotencial de 700 mb mostraron que los días con lluvia en Guanajuato se asocian con flujo ascendente y costero, así como disminuciones en la temperatura superficial y la evaporación potencial. Las fases 1-3 y 8 de la MJO muestran una buena correlación con estas anomalías. De manera similar, las anomalías observadas en los días sin lluvia en Guanajuato consistieron en temperatura superficial más elevada, flujo anticiclónico que cubre el norte de México, y evaporación potencial intensificada. Las fases 4-7 de la MJO muestran una buena correlación con esas anomalías.
ABSTRACT
Variability of precipitation and temperature was examined on multiple time scales using data from five surface observing stations in the center of Guanajuato state, Mexico, as well as gridded data from the North American Regional Reanalysis (NARR). Frequency of days with total precipitation exceeding the 90th percentile was not found to have increased from 1979-2011. However, frequency of days with maximum temperature above the 90th percentile more than doubled from 1979-2011, and frequency of days with maximum temperature below the 10th percentile decreased by almost half over the same period, an important result given the scarcity of water resources for the agriculture-based economy. Precipitation within the growing season was found to vary by phase of the Madden-Julian oscillation (MJO), with MJO phases 1-3 associated with above-normal rainfall and MJO phases 4-7 with normal or below normal rainfall. Composite anomalies of precipitation, surface pressure, surface wind, surface temperature, and 700 mbar height showed that days with rainfall in Guanajuato were associated with on-shore, upslope flow, reduced surface temperatures, and reduced potential evaporation. Composites for MJO phases 1-3 and 8 agreed well with these anomalies. Similarly, composite anomalies for days without rainfall in Guanajuato showed warm surface temperatures, broad anticyclonic flow over much of northern Mexico, and enhanced potential evaporation. Composites for MJO phases 4-7 agreed well with these anomalies.
Keywords: Climatology of Guanajuato, rainfall, temperature, intraseasonal variability.
1. Introduction
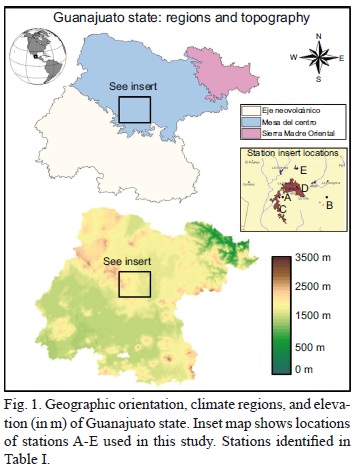
Guanajuato state, in the geographic center of Mexico, is located in one of the country's primary agricultural zones, with agriculture the largest single productive activity in the state in terms of both gross value and employment generated. The agricultural sector is a heavy user of water, utilizing up to 87% of all available surface and underground water in the state (Huerta et al., 2011). However, these water resources are scarce; therefore, it is vitally important to understand the hydrometeorological variability of the area, particularly variability in precipitation, temperature, evaporation, runoff, and associated atmospheric circulation. Like much of western subtropical North America, the western and central parts of Guanajuato state are characterized by a semi-arid monsoon climate, with 90% of the 600 mm annual precipitation falling between May and October, and the majority of that falling from June to September (García, 2004). Summertime precipitation is largely generated through interactions between the varied topography and atmospheric circulation cells associated with the North American Monsoon (Douglas et al., 1993), as well as the irregular passage oftropical cyclone remnants. The variability in precipitation of Guanajuato follows the topography, which naturally subdivides the state into three different regions: the Eje Neovolcanico in the southwest of the state, the Mesa del Centro in the central region, and the Sierra Madre Oriental in the northeast corner (Fig. 1). The Eje Neovolcánico region is the flattest of the three regions, with elevations around 1500 m over most of the area rising to near 3000 m in the far southeast (Fig. 1). The Mesa del Centro region is characterized by plateaus and escarpments, with elevations generally between 2000 and 2500 m. The Sierra Madre Oriental has the lowest elevations, below 500 m, but also the sharpest valleys and most varied topography, declining abruptly from over 2500 m to the valleys below.
This paper will focus on variability in the Mesa del Centro region. The Eje and Mesa del Centro regions were classified by García (2004) as a semi-arid monsoon climate zone because nearly all of the annual precipitation falls during the summer months. The Sierra Madre Oriental region also receives the majority of its precipitation during summer months, but unlike the two regions to its west, it also receives precipitation in other months of the year, primarily as a result of the passage of winter frontal systems. This transition in precipitation regimes was noted by Comrie and Glen (1998), who classified the Eje and Mesa del Centro regions as a "monsoon" precipitation regime, with a pronounced peak in precipitation between June and September, while classifying the Sierra Madre Oriental region, with its precipitation throughout the year, the same as the lowlands of northeastern Mexico. The western two-thirds of the state have also been classified into the "Central" climate zone, with the eastern part of the state included in the "East" zone (Giddings et al, 2005).
In addition to being situated in a transition between climate zones, Guanajuato state is also situated at the transition zone of the effects of the El Niño-Southern Oscillation (ENSO). Areas to the south, including southern and eastern Mexico and the Pacific coast of Central America, experience dry/wet summertime conditions during the warm/cool El Niño (La Niña) phase of ENSO (Peralta-Hernández et al, 2009). In contrast, areas around and to the north of Guanajuato experience very little co-variability in summertime precipitation with phase of ENSO (Magaña et al., 2003). Although total summer precipitation varies little by phase of ENSO (Englehart and Douglas, 2002), Guanajuato state does experience variability in extreme precipitation events, including both heavy rainfall and drought (Méndez-Pérez, 2005), and this variability has been connected to not only ENSO (e.g., Ropelewski and Halpert, 1986; Cavazos and Hastenrath, 1990) but also the Atlantic Multidecadal Oscillation (AMO) (Curtis, 2008). For example, Guanajuato suffered 68 extreme events from 20002009, with 37 of those associated with precipitation and the other 31 with temperature (Constantino and Dávila, 2011).
On time scales shorter than ENSO and the AMO, Barlow and Salstein (2006) found statistically significant modulations over all ofNorth American rainfall associated with the Madden-Julian Oscillation (MJO) (Madden and Julian, 1972). They found that during active local MJO, summer precipitation increased in central and southern Mexico, with many stations receiving 25% more than normal and some stations receiving in excess of 100% above normal. These increases were found to be driven primarily by changes in mean circulation, including a related increase in the frequency of tropical cyclones along the Pacific coast (Maloney and Hartmann, 2000; Barrett and Leslie, 2009). Stations in northern Mexico experienced similar decreases from normal, with Guanajuato state yet again situated in the transition zone between the modulations (Barlow and Salstein, 2006). This present study extends these findings by focusing on the variability of meteorology and hydrometeorology parameters in Mexico and Guanajuato on time scales of the MJO in both locations.
Because of its agriculture-based economy and heavy water usage, regional and local governing bodies have recently become very concerned with both the short- and long-term variability of precipitation and the subsequent management of water resources. Like much of central Mexico, the amount of extraction of groundwater—particularly for irrigation during the arid growing season—is unsustainable (Alley et al., 1999), and groundwater levels have declined up to 3 m per year in some parts of Guanajuato (Cortés et al., 2007). Evaporation is maximized in the summer months, with daily values ranging from 1.5 mm day-1 in the eastern part of the state to 2 mm day-1 in the western part of the state (Sheffield et al., 2010). Potential evaporation is even higher, exceeding 1500 mm year-1. Considering that precipitation averages only 600 mm year-1, high agricultural and urban demands for water, combined with annual evaporation that exceeds annual precipitation, result in a net water deficit and recurring low reservoir storage levels (Scott et al., 2000). In the short term, concerns center on the availability of irrigation water for the duration of the agricultural cycle, especially as most of the groundwater is extracted in the dry season and the number of consecutive days with less than 1 mm of rainfall has seemingly increased (Aguilar et al., 2005). Additionally, the southern part of Guanajuato state lies at the northern range of the region susceptible to the mid-summer dry spell, whereby precipitation begins quickly and heavily in June, slows in July and August, only to end again heavily in September (Magaña et al., 1999). Short-term planning is also concerned with both daytime minimum and maximum temperatures, particularly given preliminary evidence of an increase in the number of days with temperatures in the 90th percentile (Peterson et al., 2008). In the long term, beyond six months, concerns center on both rainfall and potable water storage (Huerta et al., 2011).
Despite these concerns, however, the precipitation and temperature climatology for Guanajuato state remains understudied (Ramírez et al., 2007), particularly from a hydrometeorological perspective. Furthermore, the variability of precipitation, temperature, evaporation, and potential evaporation, as well as accompanying variability in atmospheric circulation, within the agricultural cycle—that is, on the intraseasonal time scale—has been studied on a large-scale but needs to be narrowed to the state of Guanajuato itself. As a response to these concerns, the Servicio Meteorológico Nacional (National Weather Service) of Mexico, in partnership with the World Meteorological Organization (WMO), installed a network of automated atmospheric observing stations, the CLImate COMputing Project (CLICOM), throughout the country, and several of these stations were placed in Guanajuato state. However, the variability of temperature and precipitation measurements in this database has not yet been robustly examined for Guanajuato. Therefore, the goals of this paper are two-fold: (1) present a hydrometeorological climatology of the city of Guanajuato, with particular focus on precipitation, temperature, evaporation, runoff, and lower-tropospheric circulation, that relates surface observations with synoptic-scale conditions found to be associated with heavy precipitation and extreme temperature events; and (2) examine the intraseasonal variability—important on the agricultural time scale—of these same hydrometeorological variables during June-September in Guanajuato state by phase of the leading mode of atmospheric intra-seasonal variability, the MJO.
2. Data and methodology
Precipitation, temperature, surface pressure, evaporation, potential evaporation, runoff, and upper-air height and circulation data used in this study came from three primary sources. Daily temperature maxima, minima, and accumulated precipitation for Guanajuato state were taken from five surface observing stations: three stations, 11007, 11094, and 11103, with the most complete daily records from 1979-2008, were selected from the CLICOM data base; one station, 76577, with daily data for the summer season, June-September 1979-2011, was selected from the NCEP "Global Summary of the Day" data base; and data from one station, CCAUG, with 10-min data for the period 2008-2012, was provided by the Centro de Ciencias Atmosféricas of the Universidad de Guanajuato. The station locations, commonplace names, elevations, and periods of record are summarized in Table I, and their approximate locations are denoted by letters A-E on Figure 1. Station numbers (letters) are consistent with numbering (naming) conventions of the source network.
Gridded values of temperature, surface pressure, upper-level geopotential height, 10 m u- and v-wind components, 2 m temperature, daily evaporation, daily potential evaporation, and daily surface runoff were obtained from the North American Regional Reanal-ysis (NARR) (Mesinger et al, 2006) for the period from 1979-2011. The NARR, a regional reanalysis developed to support hydrometeorological research, has 32 km horizontal grid spacing, 45 vertical layers, and covers North America from 1979 to present at 3 h intervals. The NARR 3 h precipitation reanalyses vary geographically and temporally, and Bukovsky and Karoly (2007) reminded users to apply caution when analyzing NARR precipitation fields that come from multiple, blended sources, particularly those crossing national borders. Over Mexico, the assimilated precipitation data were based on a gridded analysis of 24 h rain gauge data and temporally and spatially down-scaled to the NARR grid using the National Centers for Environmental Prediction/Department of Energy (NCEP/DOE) Global Reanalysis (GR2) 1-hourly precipitation forecasts. Similar to the findings of Bu-kovsky and Karoly (2007), during this study, precipitation discontinuities were noted at the U.S.-Mexico border and along the land-water interface ringing the Gulf of Mexico. However, gridded precipitation over Mexico and in Guanajuato state in particular, did not exhibit any noticeable discontinuities. Other authors have cautioned that, for Mexico, the NARR evaporation and potential evaporation may be off by as much as 25% (Sheffield et al, 2010), and that runoff may have errors of similar magnitude (Zhu and Let-tenmaier, 2007), both attributable to the land-surface scheme in the NARR. These weaknesses were taken into account when considering composite anomalies analyzed for this study; however, as will be shown, anomalies agreed well with other physical parameters, increasing confidence in the hydrometerological results. Daily gridded precipitation was computed by summing the eight 3 h NARR totals for that day. Analyses of daily temperature, evaporation, potential evaporation, surface runoff, and 700 mbar circulation patterns were based on NARR data from 2100 UTC, corresponding to 4 p.m. local time, around the typical starting time of afternoon convective precipitation during the summer monsoon season.
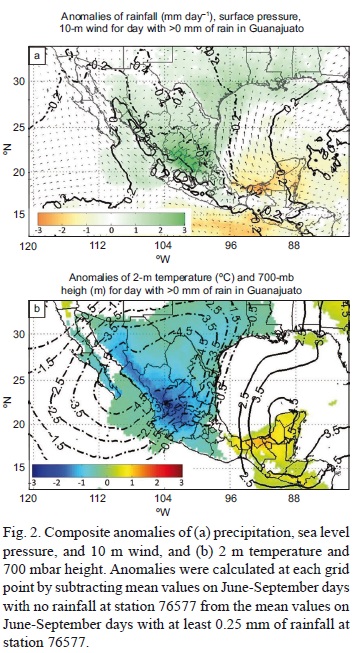
To understand the regional- and synoptic-scale circulation patterns prevalent on days with summer-season rainfall in Guanajuato, composite anomaly charts of NARR precipitation, surface pressure, 10 m u- and v-wind components, 2 m temperature, 700 hPa geopotential height, evaporation, potential evaporation, and surface runoff were examined for the summer-season June-September. Summer-season anomalies were calculated at each grid point by subtracting the mean on June-September days with zero precipitation at station 76577 (letter A in Fig. 1) from the mean for June-September days with at least 0.25 mm of rainfall. To examine the intraseasonal variability of precipitation within the summer-season in Guanajuato, daily rainfall totals at station 76577 and CLICOM stations 11007, 11094, and 11103 from June-September were first binned by phase of the MJO as measured by the widely adopted Wheeler and Hendon Multivariate MJO Index (Wheeler and Hendon, 2004). Then, daily rainfall anomalies for each of the eight MJO phases were calculated by subtracting, at each station, the mean daily rainfall for the months of June-September between 1979-2011 from daily rainfall average for each of the eight MJO phases. Composite anomalies of gridded NARR data were created following the methodology of Barrett et al. (2012), and June-September were considered together. For percentile and diurnal cycle analyses, anomalies were calculated separately for each month.
3. Results
3.1 Composite anomalies
Days with at least 0.25 mm of rainfall in Guanajuato were characterized by a broad positive rainfall anomaly over central and northern Mexico, extending into the southern U.S. (Fig. 2a), with positive rainfall anomalies between 1 and 4 mm day-1. Negative rainfall anomalies were located to the south, over the Pacific, southern Mexico, and the Yucatan Peninsula. Accompanying this dipole in daily rainfall anomalies was an east-west dipole in surface pressures. On days with rainfall in Guanajuato, small positive surface pressure anomalies (0.2 mbar) were located to the west of the state along the Mexican Pacific coast, while below-normal surface pressures were located to the east over the Gulf of Mexico. These surface pressure anomalies were associated with 10 m wind anomalies from the southwest over much of central Mexico on days with rainfall. Because of the orientation of the topography, these wind anomalies were primarily upslope in character and in good agreement with the rainfall dipole. Surface temperatures (Fig. 2b) were up to 3 °C cooler in west-central Mexico on days with rainfall in Guanajuato, and this negative anomaly extended across much of northern Mexico and the southern U.S. Positive surface temperature anomalies, between 0.5 and 1.0 °C above normal, were located across the Yucatan Peninsula and northern Central America. Accompanying the surface temperature anomalies, on days with rain in Guanajuato, 700 mbar geopotential heights were up to 5 m below normal across a broad area including all of western, central, and northern Mexico. Positive 700 mbar height anomalies, up to 5 m above normal, were centered over the Yucatan Peninsula. These height anomalies would be associated with an anomalous on-shore wind component over Guanajuato state, with its origins in the moist tropical East Pacific Ocean south of Mexico.
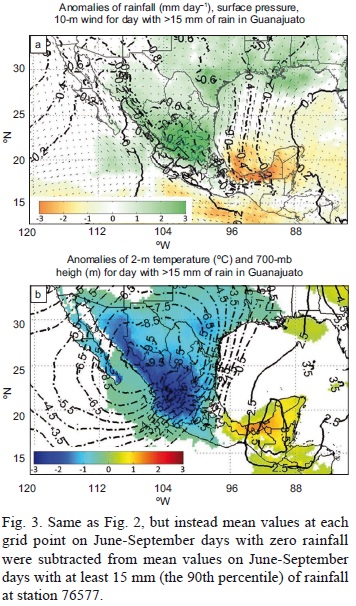
When the comparison threshold was increased to 15 mm, which corresponded to the 90th percentile in daily rainfall amount from 1979-2011, the patterns shown in Figure 2 of rainfall rates, surface pressure, 10 m winds, 2 m temperature, and 700 mbar heights all were amplified (Fig. 3). Positive rainfall anomalies, as much as 5 mm day-1, concentrated in the states bordering Guanajuato, and positive surface pressure anomalies were found along the central Mexican west coast. Negative surface pressure anomalies were located over northern Mexico and the Gulf of Mexico. Surface wind anomalies, in agreement with the sea level pressure pattern, were westerly in the northern and central parts of Guanajuato state, indicating an enhanced upslope flow wind component along the topography. The dipole in surface temperatures and 700 mbar geopotential heights also amplified, with temperature anomalies of -3 °C co-located with 700 mbar height anomalies of -10 m over and north of Guanajuato, and temperature anomalies of 1.5 °C and positive 700 mbar height anomalies over the Yucatan Peninsula.
Composites of hydrometeorological variables of evaporation, potential evaporation, and surface runoff were also examined, both for the mean state (Fig. 4a-c) and rainy days (Figs. 4d-f). Guanajuato state was found to be situated in a transition between climatologically low evaporation (0.2-0.4 mm), high potential evaporation (2-3 mm), and low surface run-off (0.01-0.04 mm) over northern Mexico and high evaporation (0.7-1.0 mm), low potential evaporation (1.0-1.5 mm), and high surface runoff (0.06-0.1 mm) over southern Mexico (Fig. 4a-c). Composite anomalies for days with rainfall in Guanajuato show that positive evaporation anomalies, up to 0.1 mm, were located north, east, and south of the state, with near zero anomalies over western Guanajuato state (Fig. 4d). On rainy days in Guanajuato, potential evaporation decreased substantially, with negative anomalies of -0.2 mm over much of central and northern Mexico (Fig. 4e), as well as positive anomalies up to 0.1 mm over the Yucatan Peninsula and northern Central America. Rainy days in Guanajuato were associated with slightly increased runoff, up to 0.02 mm, over and east of Guanajuato state, with negative anomalies of -0.04 mm over the Yucatan Peninsula (Fig. 4f).
3.2 Time series
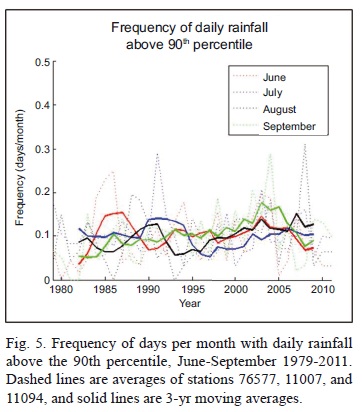
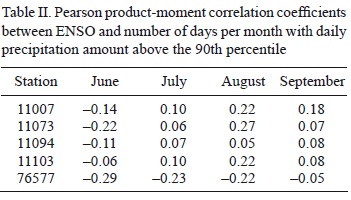
A time series of daily precipitation totals at WMO station 76577 and CLICOM stations 11007 and 11094 (all three stations are marked on Fig. 1a) revealed no significant trend from 1979-2011 in the fraction of days per month with total daily precipitation above the 90th percentile for the months of June-September (Fig. 5; monthly time series in dashed lines and 3-year moving average in bold). Fraction of days per month was selected as the metric to control for small gaps in precipitation data coverage for each station. In addition to having no long-term trend, monthly fraction of days with precipitation above the 90th percentile was also found to have no statistically significant linear correlation with sea surface temperatures in the Niño3.4 region, with Pearson product-moment correlation coefficients ranging from -0.22 to +0.27 for each of the three stations between June and September (Table II). This lack of correlation between frequency of heavy rainfall and Niño3.4 sea surface temperatures agrees with other studies, including Magaña et al. (2003), who noted that Guanajuato state was situated north of the transition zone between southern Mexico, where daily precipitation does vary by ENSO phase, and the northern part of Mexico where it does not.
Time series of daily maximum temperature above the 90th percentile and below the 10th percentile were found to have positive and negative long-term trends, respectively (Fig. 6), for all months June-September. Mean fraction of days in the early 1980s with maximum temperature above the 90th percentile was around 0.05, while by the late 2000s, the fraction had climbed to 0.25 (Fig. 6a). Similarly, mean fraction of days in the early 1980s with minimum temperature below the 10th percentile was around 0.15, while by the late 2000s, the fraction had decreased to below 0.10. Temperatures were examined for WMO station 76577 and CLICOM station 11094, the two stations with the most complete maximum temperature records.
3.3 MJO variability
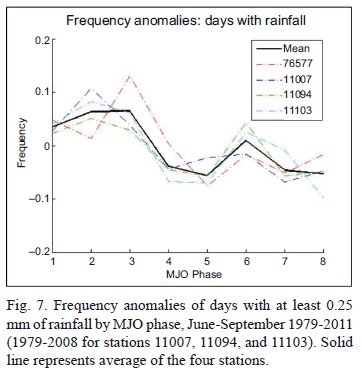
When the MJO was in phases 1-3 (as described in section 2, MJO phase for this study defined by the metric of Wheeler and Hendon [2004]), daily rainfall was up to 0.05 mm day-1 above normal (Fig. 7). Similarly, when the MJO was in phases 4 and 5, daily rainfall was around 0.05 mm day-1 below normal. The sinusoidal variability pattern exhibited by these rainfall anomalies, whereby several consecutive phases of above-normal rainfall were followed by near-normal rainfall and then several phases of below-normal rainfall, indicates that the rainfall anomalies were in agreement with the general propagation of the MJO (e.g., Zhang, 2005). The anomalies in phases 3 and 5 are statistically significantly above and below normal, respectively, at the 95% confidence level using the Student t-test. To test the physical plausibility of the variability by phase in Figure 7, composite anomalies of surface pressure, precipitation, surface wind, surface temperature, 700 mbar height, and potential evaporation were created for each MJO phase, and then compared to the composite patterns for rainy days in Guanajuato state, presented in Figure 2. Composite anomalies of precipitation for each MJO phase (Fig. 8) agreed reasonably well with the pattern of variability in Figure 7, whereby phases 1-3 were associated with positive rainfall anomalies over central Mexico, phases 4-6 with neutral to negative anomalies over and south of Guanajuato state, phase 7 with near-normal anomalies, and phase 8 returning toward positive anomalies (Fig. 8). Surface pressures were lower than normal over central and northern Mexico during MJO phases 1-3 and higher than normal over the same area during phases 5-7. The largest pressure and rainfall anomalies associated with the MJO were centered offshore to the south of Mexico in the tropical Pacific. Surface temperature anomalies (Fig. 9) agreed well with both the precipitation composite anomalies in Figure 8 as well as the climatology for rainy days in Guanajuato (Fig. 3). Negative temperature anomalies, as large as -3 °C, were located over southern and central Mexico during MJO phases 1-3 (which were found to be the rainy phases). Positive temperature anomalies as large as 3 °C extended from Guanajuato state to the southwest along the Mexican Pacific coast during phases 6-7 (which were found to be the dry phases). During MJO phases 1-2, 700 mbar geopotential heights were up to 10 m below normal, with largest negative anomalies centered over north-central Mexico. During MJO phases 4-7, positive height anomalies up to 12 m above normal were centered west and southwest of Guanajuato state (Fig. 9). By phase 8, the anomaly pattern had switched, with negative 700 mbar height anomalies again located northwest of Guanajuato. Anomalies in potential evaporation (Fig. 10) show that during the colder, rainier phases in central Mexico (phases 1 and 2), potential evaporation over southern and central Mexico was as much as 0.15 mm below normal (Fig. 10). During the warmer, drier phases in Guanajuato (phases 6 and 7), potential evaporation anomalies were positive over much of central Mexico, with anomalies as much as 0.15 mm above normal.
Temperature, relative humidity, station pressure, maximum around 2000 UTC and a daily minimum rainfall, and insolation from 2008-2012 at CCAUG around 1400 UTC, and were highest in June and station (letter E in Fig. 1) exhibited both diurnal lowest in September (Fig. 11a). Relative humidity and seasonal variability from June to September reached a daily maximum around 1400 UTC and (Fig 11a-e). Surface temperatures reached a daily a daily minimum around 2000 UTC, in agreement with surface temperatures, and was highest in July and lowest in June (Fig. 11b). Station pressures were bimodal, reaching daily maxima around 0500 and 1700 UTC and daily minima around 2400 and 1100 UTC, and were highest in July and lowest in June (Fig 11c). Rainfall rates reached a daily maximum between 2000 and 0500 UTC and a daily minimum around 1400 UTC, with highest late evening rainfall rates (from 00-06 UTC) in July and August and highest late afternoon (18-00 UTC) rainfall rates in June and September (Fig. 11d). Solar radiation was highest in June and reached a local peak around 1700 UTC (Fig. 11e).
Despite the shorter time series for the CCAUG station data (only a 5-year period was available for analysis), the diurnal cycles did exhibit variability by phase ofthe MJO (Fig. 11f-j). Daytime temperatures were highest in phases 6 and 8 and lowest in phases 1, 3, and 4 (Fig. 11f). Nocturnal temperatures showed little variability by phase of the MJO. Afternoon relative humidity also varied by phase of the MJO, with highest relative humidity occurring in phase 4, in agreement with lower temperatures, and lowest relative humidity occurred in phases 5, 6, and 8, also agreeing with higher temperatures (Fig. 11g). Surface pressure anomalies were highest in phases 1, 6, and 8 and lowest in phase 3 (Fig. 11h). Rainfall rate anomalies were generally highest in phases 1 through 3, in agreement with Fig. 7, although high late evening rainfall rates were also observed in phase 4 (Fig. 11i). Anomalously low rainfall occurred during phase 6, particularly during the late evening hours. Incoming solar radiation was highest in phases 4, 5, 6, and 8 and lowest in phases 1 and 3 (Fig. 11j) in agreement with the temperature anomalies in Figure 11f.
4. Discussion
In this paper, we examined anomalies of atmospheric and hydrometeorological variables associated with precipitation in Guanajuato, as well as time series of precipitation and temperature at five surface observing stations in the central part of the state. These variables were chosen for study because of Guanajuato state's location in a transition between key climate zones, including seasonality of annual precipitation and association with major climate oscillations, and its over-use of scarce water resources. It was found that on days when precipitation was recorded at the WMO station in Guanajuato, precipitation was above normal across a broad area of central and southern Mexico. Accompanying these rainfall anomalies, surface pressures were up to 1 mbar higher along Mexico's Pacific coast and 1 mbar lower over the Gulf of Mexico, driving an anomalous, upslope surface wind component. Surface temperatures were up to 2 °C cooler over much of the western, central, and northern Mexico, and 700 mbar geopotential heights were up to 10 m below normal over much of central and northern Mexico. For days with total precipitation exceeding the climatological 90th per-centile, the patterns in precipitation, temperature, height, and pressure identified above all amplified. This agreement in anomalies between central and northern Mexico suggests that, for summer-season temperature and precipitation, the climate of Guanajuato behaves similarly to that of northern and central Mexico. Hydrometeorological variables also generally agreed with these patterns, whereby days with rain in Guanajuato were associated with evaporation up to 0.1 mm higher over much of Mexico and potential evaporation as much as 0.2 mm lower over Guanajuato and northern Mexico. With more precipitation, more water was available for evaporation, and with cooler temperatures, the potential for evaporation was reduced. Surface runoff was found to be above normal over central and northern Mexico on days with rain in Guanajuato, again in agreement with the patterns of precipitation and temperature and suggesting that Guanajuato's summer-season climate behaves similarly to that of northern and central Mexico.
Precipitation was found to vary by phase of the MJO, with phases 2-3 associated with above-normal rainfall and phases 4, 5, and 8 with below-normal rainfall. Phases 1 and 6 were associated with near-normal rainfall. Composite anomalies by MJO phase showed above-normal precipitation over much of central and southern Mexico in phases 1 and 2, with above-normal precipitation in central Mexico in phase 3 switching to near- and below-normal precipitation in phases 4-7. Phase 8 was associated with above-normal precipitation along Mexico's southern Pacific coast and near- to below-normal precipitation near Guanajuato state. Surface temperatures agreed well with this pattern, whereby cooler (warmer) than normal temperatures were found in the same geographic areas and during the same phases as the wetter (drier) precipitation anomalies. Surface pressure and 700 mbar geopotential heights also varied by MJO phase, with below-normal pressures and heights over northern Mexico in phases 1-3 and 8, near-normal pressures and heights in phase 4, and above-normal pressures and heights in phases 4-7. It is interesting to note that the increase in rainfall during MJO phase 6 in Guanajuato (Fig. 7) was not generally supported by the composite anomalies of precipitation (Fig. 8) or temperature (Fig. 9). However, closer examination reveals that phase 6 is associated with large positive surface temperature anomalies over much of southwestern Mexico, including Guanajuato state. It is possible that this increase in temperature, and the locally enhanced mountain-valley convergent circulations that would result in Guanajuato, drive a local increase in precipitation that is not reflected on the larger scale. The diurnal cycles of temperature, relative humidity, surface pressure, rainfall, and solar radiation were all found to vary by phase of the MJO, generally in good agreement with the composites in Figures 8-9. For example, the wettest phases, particularly phases 2 and 3, were associated with cooler late-afternoon surface temperatures, higher afternoon relative humidities, and reduced insolation. Similarly, the driest MJO phases, particularly phases 4, 5, and 7, were associated with higher afternoon temperatures, lower afternoon relative humidities, and higher insolation.
The frequency of days per month with precipitation exceeding the 90th percentile was not found to have increased from 1979-2011. Maximum surface temperatures, however, were found to generally have increased, with the fraction of days with maximum temperatures above the 90th percentile more than tripling from 1979-2011 and the fraction of days with maximum temperatures below the 10th percentile decreasing by more than 50%. This has important implications for water resource management. Warmer temperatures cause increased evaporation, which both reduces the water available for use from reservoirs and watersheds and increases the demand for water from different sectors, particularly the agricultural sector. Two possible mitigation strategies come from the MJO results. First, during phases with enhanced rainfall, water users can expect more natural input and thus would need to draw less from reservoirs or watersheds, possibly reducing waste. Second, during phases with reduced temperatures and evaporation, water users can expect to lose less water to the atmosphere and thus can reduce their drawdown from reservoirs or watersheds.
5. Conclusions
On June-September days with rain in Guanajuato, cooler than normal temperatures, above-normal precipitation, and lower pressures at 700 mbar heights are found over a broad region of northern and central Mexico. Higher than normal evaporation, and below normal potential evaporation, were also found over much of northern and central Mexico on June-September days with rain in Guanajuato. Precipitation was not found to vary interseasonally, for example, by phase of ENSO. Nor was there a trend in the frequency of heavy precipitation, with daily amounts that exceeded the long-term 90th percentile threshold not changing from 1979-2011. However, maximum temperatures have increased from 1979-2011, with the frequency of maximum temperatures exceeding the 90th percentile increasing to near 30% at the end of the period, and the frequency of maximum temperatures below the 10th percentile decreasing to near 5%. Precipitation, temperature, and circulation, both in Guanajuato and over much of Mexico, were found to vary intraseasonally by phase of the MJO. Phases 2-3 were associated with above-normal rainfall, and phases 4, 5, and 8 were associated with below-normal rainfall. Surface temperatures had similar variability, with cooler (warmer) than normal temperatures found in the same geographic areas during wetter (drier) precipitation phases.
Acknowledgements
The authors would like to thank the Servicio Meteorológico Nacional for providing the CLICOM data, as well as two anonymous reviewers for helpful comments to improve the manuscript. Partial support for this work came from a grant from the U.S. Naval Academy Research Council.
References
Aguilar E. T. C. Peterson, P. Ramírez Obando, R. Frutos, J. A. Retana, M. Solera, J. Soley, I. González García, R. M. Araujo, A. Rosa Santos, V. E. Valle, M. Brunet, L. Aguilar, L. Álvarez, M. Bautista, C. Castañón, L. Herrera, E. Ruano, J. J. Sinay, E. Sánchez, G. I. Hernández Oviedo, F. Obed, J. E. Salgado, J. L. Vázquez, M. Baca, M. Gutiérrez, C. Centella, J. Espinosa, D. Martínez, B. Olmedo, C. E. Ojeda Espinoza, R. Núñez, M. Haylock, H. Benavides and R. Mayorga, 2005. Changes in precipitation and temperature extremes in Central America and northern South America, 1961-2003. J. Geophys. Res. 110, D23107, doi:10.1029/2005JD006119. [ Links ]
Alley W. M., T. E. Reilly and O. L. Franke, 1999. Sustainability of ground-water resources. U.S. Geological Survey Circular 1186. U.S. Geological Survey, Denver, CO, 79 pp. [ Links ]
Barlow M. and D. Salstein, 2006. Summertime influence of the Madden-Julian Oscillation on daily rainfall over Mexico and Central America. Geophys. Res. Lett. 33, L21708. [ Links ]
Barrett B. S. and L. M. Leslie, 2009. Links between tropical cyclone activity and Madden-Julian Oscillation phase in the North Atlantic and Northeast Pacific basins. Mon. Weather Rev. 137, 727-744. [ Links ]
Barrett B. S., J. F. Carrasco and A. P. Testino, 2012. Madden-Julian Oscillation (MJO) modulation of atmospheric circulation and Chilean winter precipitation. J. Climate 25, 1678-1688. [ Links ]
Bukovsky M. S. and D. J. Karoly, 2007. A brief evaluation of precipitation from the North American Regional Reanalysis. J. Hydrometeor. 8, 837-846. [ Links ]
Cavazos T. and S. Hastenrath, 1990. Convection and rainfall over Mexico and their modulation by the Southern Oscillation. Int. J. Climatol. 10, 377-386. [ Links ]
Comrie A. C. and E. C. Glen, 1998. Principal components-based regionalization of precipitation regimes across the southwest United States and northern Mexico, with an application to monsoon precipitation variability. Clim. Res. 10, 201-215. [ Links ]
Constantino R. M. and H. R. Dávila, 2011. Una aproximación a la vulnerabilidad y la resiliencia ante eventos hidrometeorológicos extremos en México. Política y Cultura 36, 15-44. [ Links ]
Cortes A., J. Durazo and S. Kralisch, 2007. Rapid isotopic changes in groundwater, upper Rio Guanajuato catchment, Mexico. Geofis. Int. 46, 75-82. [ Links ]
Curtis S., 2008. The Atlantic multidecadal oscillation and extreme daily precipitation over the US and Mexico during the hurricane season. Clim. Dynam. 30, 343-351. [ Links ]
Douglas M. W., R. A. Maddox, K. Howard and S. Reyes, 1993. The Mexican monsoon. J. Climate 6, 1665-1677. [ Links ]
Englehart P. J. and A. V. Douglas, 2002. Mexico's summer rainfall patterns: an analysis of regional modes and changes in their teleconnectivity. Atmósfera 15, 147-164. [ Links ]
García E., 2004. Modificaciones al sistema de clasificación climática de Kóppen. Serie Libros, 6. Instituto de Geografía, Universidad Nacional Autónoma de México, 90 pp. [ Links ]
Giddings L., M. Soto, B. M. Rutherford and A. Maarouf, 2005. Standardized precipitation index zones for Mexico. Atmósfera 18, 33-56. [ Links ]
Huerta J., M. Esquivel-Longoria, F. Arellano-Lara, S. Domínguez-Ruiz and F. Rosales-Flores, 2011. A system dynamics approach to examine climate change impacts: the case of the State of Guanajuato, Mexico. Proceedings of the 29th International Conference of the System Dynamics Society. Washington, DC, 20 pp. [ Links ]
Madden R. A. and P. R. Julian, 1972. Description of global-scale circulation cells in the tropics with a 40-50 day period. J. Atmos. Sci. 29, 1109-1123. [ Links ]
Magaña V., J. A. Amador and S. Medina, 1999. The midsummer drought over Mexico and Central America. J. Climate 12, 1577-1588. [ Links ]
Magaña J. L. Perez and J. B. Perez, 2003. Impact of El Nino on precipitation in Mexico. Geofis. Int. 42, 313-330. [ Links ]
Maloney E. D. and D. L. Hartmann, 2000. Modulation of eastern North Pacific hurricanes by the Madden-Julian Oscillation J. Climate 13, 1451-1460. [ Links ]
Méndez-Pérez J. M., 2005. Un estudio de eventos hidro-meteorológicos extremos en la República Mexicana. MSc. Thesis. Universidad Nacional Autónoma de México, 56 pp. [ Links ]
Mesinger F., G. DiMego, E. Kalnay, K. Mitchell, P. C. Shafran, W. Ebisuzaki, D. Jovic, J. Woollen, E. Rogers, E. H. Berbery, M. B. Ek, Y. Fan, R. Grumbine, W. Higgins, H. Li, Y. Lin, G. Manikin, D. Parrish and W. Shi, 2006. North American Regional Reanalysis. Bull. Amer. Meteor. Soc. 87, 343-360. [ Links ]
Peralta-Hernández A. R., R. C. Balling Jr. and L. R. Barba-Martínez, 2009. Comparative analysis of indices of extreme rainfall events: variations and trends from southern Mexico. Atmósfera 22, 219-228. [ Links ]
Peterson T. C., X. Zhang, M. Brunet-India and J. L. Vázquez-Aguirre, 2008. Changes in North American extremes derived from daily weather data. J. Geophys. Res. 113, D07113, doi:10.1029/2007JD009453. [ Links ]
Ramírez L. G., O. Oropeza-Orozco, J. Jugo-Hubp, M. Cortez-Vázquez and E. Jáuregui-Ostos, 2007. Análisis de las principales causas de las inundaciones de septiembre de 2003 en el sur del estado de Guanajuato, México. Investigaciones Geográficas 64, 7-25. [ Links ]
Ropelewski C. F. and M. S. Halpert, 1986. North American precipitation and temperature patterns associated with the El Niño/Southern Oscillation (ENSO). Mon. Weather Rev. 114, 2352-2362. [ Links ]
Scott C. A., J. A. Zarazúa and G. Levine, 2000. Ur-ban-wastewater reuse for crop production in the water-short Guanajuato river basin, Mexico. Research Report 41. International Water Management Institute, Colombo, Sri Lanka, 35 pp. [ Links ]
Sheffield J., E. F. Wood and F. Muñoz-Arriola, 2010. Long-term regional estimates of evaportranspiration for Mexico based on downscaled ISCCP data. J. Hy-drometeorol. 11, 253-275. [ Links ]
Wheeler M. and H. H. Hendon, 2004. An all-season real-time multivariate MJO index: Development of an index for monitoring and prediction. Mon. Wea. Rev. 132, 1917-1932. [ Links ]
Zhang C., 2005. Madden-Julian oscillation. Rev. Geophys. 43, 1-36. [ Links ]
Zhu C. and D. P. Lettenmaier, 2007. Long-term climate and derived surface hydrology and energy flux data for Mexico: 1925-2004. J. Climate 20, 193-1946. [ Links ]

