


Servicios Personalizados
Revista
Articulo
 Inglés (pdf)
 Artículo en XML
 Referencias del artículo
 Enviar artículo por email
Indicadores
-
 Citado por SciELO
 -
 Accesos
Links relacionados
-
 Similares en
SciELO
Similares en
SciELO
Compartir

 Permalink
Atmósfera
versión impresa ISSN 0187-6236
Atmósfera vol.26 no.4 Ciudad de México oct. 2013
Greenhouse gases mitigation against climate change: United States-Mexico border study case
N. SANTILLÁN SOTO, O. R. GARCÍA CUETO, S. OJEDA BENÍTEZ, N. VELÁZQUEZ LIMÓN, M. QUINTERO NÚÑEZ and M. SCHORR
Instituto de Ingeniería, Universidad Autónoma de Baja California, Blvd. Benito Juárez S/N, Col. Insurgentes Este, 21280 Mexicali, Baja California, México Corresponding author: N. Santillán Soto; e-mail: nsantillan@uabc.edu.mx
Received November 15, 2011; accepted May 29, 2013
RESUMEN
La radiación solar es una de las fuentes de energía más importantes de nuestro planeta. El interés por su uso como energía renovable y limpia para mitigar los efectos de los gases de efecto invernadero (GEI) se ha incrementado de manera significativa. Este artículo presenta una evaluación de las mediciones de radiación solar y la estimación del potencial energético, así como una comparación de ambas, como ejemplo del esfuerzo para reducir los GEI. Las mediciones fueron realizadas con piranómetros instalados en la ciudad de Mexicali, Baja California, localizada en el noroeste de México, y en la ciudad de Yuma, Arizona, en el suroeste de EUA, que están separadas por una distancia de 96 km. Ambas ciudades muestran un desarrollo sostenido y características climáticas similares con numerosos días soleados, elevadas temperaturas extremas y escasa precipitación. Los resultados muestran diferencias tanto en su comportamiento como en las mediciones de radiación solar global, especialmente durante las estaciones críticas primavera y verano, con valores 15.73% (0.042 KW/m2) superiores en Mexicali con respecto a Yuma a pesar a pesar de su cercanía. Esto indica que los flujos de mesoescala parecen dominar los sistemas sinópticos prevalentes en la región. Se estima el potencial energético, y se analiza con algunas variables como radiación solar global, precipitación, temperatura del aire, humedad relativa y climatología de los días claros, parcialmente nublados y nublados. Con esto se estima la energía proyectada para Mexicali en caso de que se utilizara el recurso solar, y se calcula que se evitarían 291 ton de GEI. Los valores de energía potencial obtenidos en Mexicali son mayores que los registrados en Yuma, por lo que este estudio comparativo de radiación solar y energía contribuye al desarrollo de estas tecnologías en México. Los resultados de las mediciones en la región demuestran la importancia de la estrategia propuesta para mitigar el cambio climático.
ABSTRACT
Solar radiation is one of the most important energy resources of our planet. The interest in its use as a renewable and clean energy to mitigate the greenhouse gases (GHG) effects has increased significantly. This paper evaluates the measurements of global solar radiation and its energy potential and presents a comparison between both of them, as an example of the effort to reduce GHG emissions. The measurements were made with pyranometers installed in the city of Mexicali, Baja California, located in northwestern Mexico, and the city of Yuma, Arizona, located in the southwestern United States. Separated by a distance of 96 km, both cities have a sustained development and are climatically similar, since they present numerous sunny days, extreme hot temperatures and little precipitation. The results presented show differences in their behavior and in the solar radiation measurement values, especially for the critical spring and summer seasons, with values 15.73% (0.042 kW/m2) higher in Mexicali with respect to Yuma. Energy power is estimated, and it is discussed with some variables as global solar radiation, rainfall, air temperature, relative humidity and climatology of clear, partly cloudy, and cloudy days. With this estimation, the solar energy used and GHG avoided is projected for Mexicali. It is assessed that 291 tons of GHG are prevented. The Mexicali values of potential energy are higher than those of Yuma; therefore, this solar and energy comparative study provides reasons to develop these technologies in Mexico, but solar technologies should be deployed also in Yuma. The measured data at the regional level demonstrate their importance, and the relevance of the proposed mitigation strategy for climate change.
Keywords: Solar radiation, climate change, greenhouse gases mitigation, climatological variables, solar resource.
1. Introduction
Mexicali is located in the Sonoran Desert of northwestern Mexico, at 32.55° N, 115.47° W (Fig. 1). It has a dry, arid climate, with extremely hot summers and cold winters, being one of the hottest cities of Mexico, with an average July high temperature of 42.2 °C, and an average January high of 21 °C. Mexicali receives 90% of the maximum potential hours of daylight each year. In average, it receives annually 75 mm of rain; on July 28, 1995, it reached an all-time high temperature of 52 °C (García-Cueto and Santillán, 2012); the minimum temperatures over the past 30 years have been reflected in increments (García-Cueto et al., 2009). This city reached a population of 936 826 in 2010 (INEGI, 2010) and it will have 1 276 038 inhabitants by 2030, at the current growth rate (CONAPO, 2010). In the border node, formed by Baja California, California, Arizona and Sonora, strong relationships exist among the region's cities. Mexicali is strategically located (Fig. 1) along the border. It is a very important port between Mexico and the United States due to its agricultural and industrial activities. Water from the Colorado River is available, generating economic and social benefits for this area and promoting urban growth. The acceleration of the urbanization process has imposed enormous demands for expensive productive infrastructure, equipment and services, which in turn have placed strong pressures on the environment and natural resources. Climate change, global warming and GHG emissions (all interrelated and complex phenomena) affect these infrastructure assets, mainly due to extreme events such as torrential rains and flooding, dry and wet seasons, high and low humidity and solar radiation (Valdez et al., 2010).
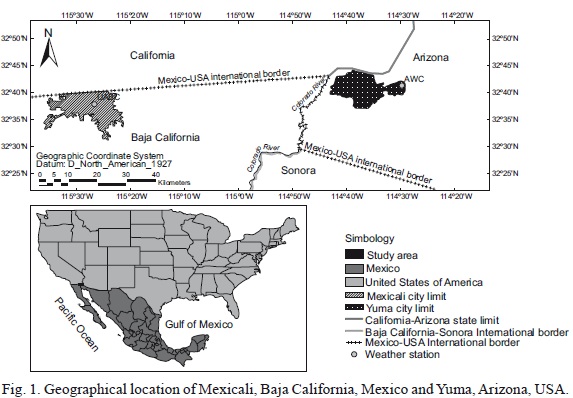
Yuma is located 96 km from Mexicali at 32.73° N, 114.62° W and 35.9 meters above sea level (Fig. 1); has 293 064 inhabitants (City-Data.com, 2010), and according to the Guinness Book of World Records, is the sunniest place on earth. Currently the GHG emissions are mitigated using solar energy resources in an efficient and scientific approach. The Arizona Western College has installed on its science buildings a solar energy system for lighting, producing 5 MW, enough annual energy to cover 100% of a college's energy needs during daylight hours (AWC, 2011a). A short distance separates Mexicali from Yuma, yet some differences arise, since each zone has its own microclimate. Compared with the aforementioned average, Yuma maximum temperatures are 41.6 °C and 20.2 °C in July and January respectively, and it has annual precipitation of 72.6 mm (WRCC, 2011).
The Intergovernmental Panel of Climate Change proposes mitigation strategies at a global level (IPCC, 2007); also, academics and the private sector develop important studies of climate scenarios and emission inventories to generate and implement mitigation strategies (Conde et al., 2011; Sánchez-Torres et al., 2011; Trejo et al., 2011). No real, strong efforts have been implemented in this regard in the Mexicali region due to economical limitations and legal frame (INE-SEMARNAT, 2009), and on the other hand, social and human behaviors are the least-understood aspects of the climate change situation. Worldwide, GHG emissions that occur largely caused by human activities continue to rise despite official efforts to promote mitigation and initiatives from many citizens who take steps to overcome the problem (Gifford et al., 2011). Since the global problem is complex, this paper addresses and justifies the implementation of clean technologies in cities that have climatic advantages to reduce GHG emissions.
2. Methods and equipment
This comparative study was developed in Mexicali utilizing the instruments of the Instituto de Ingeniería de la Universidad Autónoma de Baja California (UABC; Engineering Institute of the Autonomous University of Baja California). The radiometric information was gathered with the following equipment:
• Pyranometer 240-8101.
• Pyranometer LI200X.
• Datalogger CR10 (Campbell Scientific).
A software was used to configure the sensors, the values were registered in a CR10 datalogger, a PC200W 4.0 was applied to monitor and collect the data; all instruments were supplied by Campbell Scientific, USA. Periods representative of the year's season were selected: December 28, 2009 to January 28, 2010 for winter; April 2 to May 2, 2010, for spring; July 3 to July 30, 2010, for summer; and November 9 to December 9, 2010, for fall.
Measurements at Yuma were carried out with the system installed on the main campus of the Arizona Western College; the equipment was provided by Fat Spaniel Technologies, made by Customer Monitoring Independent Energy Solutions, Inc. Information is available at the college website (AWC, 2011b).
Sensors and monitoring equipment were installed and programmed in the facilities of the main campus weather station of the UABC, located in Mexicali; the data was collected during the aforementioned periods, and transferred to Excel for handling, using graphics to visualize its behavior and magnitude. Moreover, the radiometric information of Yuma was taken from the web site of Arizona Western College and then compared with data from Mexicali in similar periods.
3. Results and discussion
Figure 2 displays the graphic comparison between Mexicali and Yuma in January. It shows that on a daily basis the pattern observed in both cities is similar, but higher values are documented in Yuma, since it has more solar resource potential. The black lines correspond to Yuma measurements, which present peaks over the gray lines of Mexicali measurements that are supported with the average comparison; Yuma January average is 0.150 kW/m2 and Mexicali January average is 0.129 kW/m2.
This trend changes in April in both cities because solar potential is greater in Mexicali. Figure 3 shows pronounced peaks of the gray line over Yuma's measurements (black lines). Similarly, the comparison clearly defines the differences: Mexicali April-May average is 0.289 vs. 0.270 kW/m2 for Yuma.
Figure 4 indicates the prevailing trend for Mexicali to generate more energy than Yuma with higher values in the month of July. The gray line of Mexicali measurements has constant and outstanding peaks over Yuma black line values. Again, Mexicali July average of 0.330 kW/m2 is above Yuma July average of 0.264 kW/m2.
A new trend emerges in the winter period with increasing Yuma values (Fig. 5). The Yuma graph (black line) shows records above Mexicali readings. Similar to January (Fig. 1), Yuma November average is 0.189 kW/m2 and Mexicali November average is 0.166 kW/m2.
The monthly average in Mexicali for April and July is greater than the solar potential in January and November. In the months of January and November, Yuma has a greater potential than Mexicali (Fig. 6). Summarizing, the annual average (0.228 kW/m2 for Mexicali and 0.218 kW/m2 for Yuma) is 4.58% (0.01 kW/m2) higher in Mexicali, but particular results can be detected when coupling the averages in season pairs; for example, higher values prevail for Mexicali in spring-summer, with 15.73% (0.042 kW/ m2) up with respect to Yuma; in fall-winter, the advantage is for Yuma with 14.96% (0.022 kW/m2) up.

Moreover, Figure 6 displays differences in the order of hundredths except for July, with differences in the order of tenths. These differences are 0.021, 0.019, 0.066, and 0.039 kW/m2, an average of 0.036 kW/m2, which represents less than the 17% annual average of any location studied.
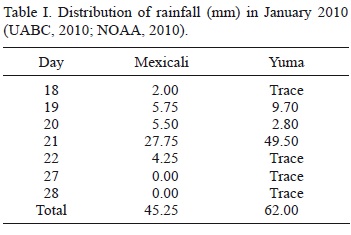
Both cities have a semi-desert climate, with mostly sunny days year round, low rainfall, and extreme temperatures. The differences observed could be partially explained by cloudiness and precipitation that occur particularly in January (Table I). Yuma underwent 62 mm of rainfall, versus the 45.25 mm measured in Mexicali. In April, rain was registered only twice in both cities, but on different days. In Mexicali it rained 5.0 mm the first day, whereas in Yuma only traces of precipitation were observed on April 12. In July and November no precipitation was recorded in either city.
The air temperature behavior is very similar in both cities, especially in April (Fig. 7), with a daily variation characterized by the passage of frontal systems, particularly observed on days 12, 21 and 29, which have the lowest values recorded; but the rebound is quite fast (see the increase between days 22 and 27), which can be explained by the intense solar radiation. The diurnal variation that occurs in both locations is characteristic of the regional semi-arid climate. For the same period, the values of relative humidity in Mexicali show more humid conditions than in Yuma (Fig. 8). The high atmospheric pressure that leads to very weak winds, or no wind at all and clear skies, highlights this difference. A comparison between the average values of air temperature and relative humidity shown in Figure 7 and 8 can be seen in Table II. These values are determined by the local environment around both sites, which is being analyzed.
Since Mexicali and Yuma are separated by a short distance (only 96 km) and both are located in the Sonoran Desert, the topography that sorrounds them is very similar.
The monthly rainfall values for both cities (Table III) and the annual rainfall are similar in both places, indicating that the solar resource is similar. However, monthly analyses show that Yuma receives more rainfall than Mexicali in the summer months, which is precisely the season when they have a greater energy demand by the massive use of air conditioning. This is corroborated by analyzing some climatic data from both cities (Table IV: clear days [CLD], partially cloudy days [PCD] and cloudy days [CD]), suggesting that Mexicali annually has 14.2% more clear days than Yuma. On the other hand Yuma has a double number of cloudy days than Mexicali, which is very important for the quantification of potential energy available from the local solar resource. Comparing Mexicali with Yuma in the summer season (June to September) it should be highlighted that Mexicali has 12% more clear days that Yuma, 36% fewer days partially covered, and 22 % less cloudy days, which confirm that solar energy potential in Mexicali is greater than in Yuma.
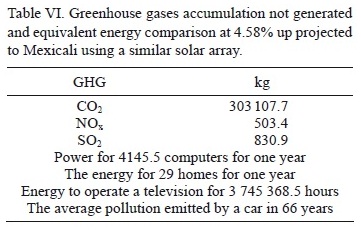
Table V shows the cumulative equivalent of GHG non-emitted from the installation at Arizona Western College by the use of renewable energy and environmental benefits. Table VI projects this low potential system under Mexicali conditions.

Even Mexico lags in issues of renewable energies. The Diario Oficial de la Federación (government gazette) published in September 2, 2009 the Reglamento de la Ley para el Aprovechamiento de Energías Renovables y el Financiamiento de la Transición Energética (law regulation for the exploitation of renewable energy and energy transition financing) that supports and promotes small-scale projects by giving economic and fiscal incentives (DOF, 2009). Otherwise, in the Mexicali Valley a novel pilot project is being developed in the Cerro Prieto Geothermal Plant Facilities, implemented by the Comisión Federal de Electricidad (CFE), which consists of a 5 MW photovoltaic plant with important environment proposals, among others, the estimated reduction in GHG carbon dioxide (CO2) into the atmosphere equivalent to 4000 tons per year. If this CO2 amount is traded in the CDM (Clean Development Mechanism), it would amount to an annual income of $40,000 facilitating the inclusion of this project in the Kyoto Protocol, and contributing to the promotion and installation of a photovoltaic national electrical system interconnected to the rest of the country (González-Escárcega, 2011). This is a useful example of a climate resource and an extension of land available for this type of plant in Mexicali and its valley. For this implementation it is necessary to adapt the legal and regulatory framework and also the economic and fiscal incentives. According to the previous results obtained and the pilot project now under construction by the Mexican Government, it should prove the certainty of both cities solar potential.
4. Conclusions
This comparative study demonstrates that both cities have a significant potential resource of solar energy and that the efficient installation and exploitation of a powerful solar system will avoid and/or minimize the energy dependence on fossil, contaminating fuels. The main objective of this study, from the climatology viewpoint and based on the variables discussed, is satisfied: it is now certain that the construction of a massive photovoltaic framework will serve both sunny cities: Mexicali and Yuma, which could save huge expenses and would no longer rely on fossil fuels for the generation of electricity. This study also highlights the importance of solar radiation measurements at a local scale to obtain a more accurate assessment of the energy potential, especially for a network that uses the solar resource. This study complements other researches on solar energy currently being developed in Mexicali and the state of Baja California, such as methane bioreactors, cooling systems for solar concentration, and desalination of seawater. Initial investment costs for solar systems are very expensive; however investment issues, profitability and legal framework have been resolved in other countries. These issues should not prevent the implementation of solar projects in Mexico. This study reaffirms the importance and relevance of implementing advanced technologies to harness renewable energy as part of the global commitment for action on climate change.
References
AWC, 2011a. Arizona Western College solar installation. Arizona Western College, Yuma, AZ. Available at: http://www.azwestern.edu/Marketing_and_PR/solar_array.html. [ Links ]
AWC, 2011b. Solar array system. Arizona Western College, Yuma AZ. Available at: http://www.azwestern.edu/online_services.html [last accessed on November 16, 2011] [ Links ].
City-Data.com, 2010. Yuma, Arizona. Available at: http://www.city-data.com/city/Yuma-Arizona.html. [ Links ]
CONAPO, 2010. Proyecciones de la población en México 2005-2050. Consejo Nacional de Población, Mexico. Available at: http://conapo.gob.mx/index.php?option=com_content&view=article&id=36&Itemid=234. [ Links ]
Conde C., F. Estrada, B. Martínez, O. Sánchez and C. Gay, 2011. Regional climate change scenarios for Mexico. Atmósfera 24, 125-140. [ Links ]
DOF, 2009. Reglamento de la Ley para el Aprovechamiento de Energías Renovables y el Financiamiento de la Transición Energética. Diario Oficial de la Federación. México, Secretaría de Energía, pp. 36-43. [ Links ]
García-Cueto O. R., A. Tejeda-Martínez and G. Bojórquez-Morales, 2009. Urbanization effects upon the air temperature in Mexicali, B.C., México. Atmósfera 22, 349-365. [ Links ]
García-Cueto O. R. and N. Santillán Soto, 2012. Modeling extreme climate events: Two case studies in México. In: Climate models (L. Druyan, Ed.). INTECH, Croatia, pp. 137-160. [ Links ]
Gifford R., C. Kormos and A. McIntyre, 2011. Behavioral dimensions of climate change: Drivers, responses, barriers, and interventions. Wiley Interdisciplinary Reviews: Climate Change 2, 801-827. [ Links ]
González-Escárcega O., 2011. México ve el potencial de fuentes renovables. El Universal, October 27, Mexico. Available at: http://www.eluniversal.com.mx/finanzas/90591.html. [ Links ]
IMTA, 2010. Extractor Rápido de Información Climatológica (ERIC) V. 3.0 [compact disc]. Mexico, Instituto Mexicano de Tecnología del Agua. [ Links ]
INE-SEMARNAT, 2009. México: Cuarta Comunicación Nacional ante la Convención Marco de las Naciones Unidas sobre el Cambio Climático. Mexico, Instituto Nacional de Ecología, Secretaría de Medio Ambiente y Recursos Naturales, 274 pp. [ Links ]
INEGI, 2010. Panorama sociodemográfico de México. Mexico, Instituto Nacional de Estadística y Geografía, p. 12. [ Links ]
IPCC, 2007. Climate Change 2007: Synthesis report. Contribution of Working Groups I, II and III to the Fourth Assessment Report of the Intergovernmental Panel on Climate Change (R. K. Pachauri and A. Reisinger, Eds.). IPCC, Geneva, 104 pp. [ Links ]
NOAA, 2010. National Weather Service. Washington, National Oceanic and Atmospheric Administration. Available at: http://www.nws.noaa.gov. [ Links ]
Sánchez-Torres E. G., J. E. Ospina-Noreña, C. Gay-García and C. Conde, 2011. Vulnerability of water resources to climate change scenarios. Impacts on the irrigation districts in the Guayalejo-Tamesí river basin, Tamaulipas, México. Atmósfera 24, 141-155. [ Links ]
Trejo I., E. Martínez-Meyer, E. Calixto-Pérez, S. Sánchez-Colón, R. Vázquez de la Torre and L. Villers-Ruiz, 2011. Analysis of the effect of climate change on plant communities and mammals in Mexico. Atmósfera 24, 1-14. [ Links ]
UABC, 2010. Reporte climatológico mensual. Universidad Autónoma de Baja California. Instituto de Ingeniería, Mexicali, B.C., Mexico. [ Links ]
Valdez B., M. Schorr, M. Quintero, R. García and N. Rosas, 2010. The effect of climate change on the durability of engineering materials in the hydraulic infrastructure. An overview. Corros. Eng. Sci. Techn. 45, 34-41. [ Links ]
WRCC, 2011. Arizona climate summaries. Western Regional Climate Center. Available at: http://www.wrcc.dri.edu/summary/climsmaz.html. [ Links ]

