


Serviços Personalizados
Journal
Artigo
 Inglês (pdf)
 Artigo em XML
 Referências do artigo
 Enviar este artigo por email
Indicadores
-
 Citado por SciELO
 -
 Acessos
Links relacionados
-
 Similares em
SciELO
Similares em
SciELO
Compartilhar

 Permalink
Atmósfera
versão impressa ISSN 0187-6236
Atmósfera vol.26 no.4 Ciudad de México Out. 2013
The properties of convective storms in central Mexico: A radar and lightning approach
S. NOVO and G. B. RAGA
Centro de Ciencias de la Atmósfera, Universidad Nacional Autónoma de México, Circuito de la Investigación Científica s/n, Ciudad Universitaria, 04510 México, D.F. Corresponding autor: S. Novo; e-mail: sadielnovo@gmail.com
Received October 9, 2012; accepted March 19, 2013
RESUMEN
Se emplean datos del radar de Cerro Catedral (una elevación cercana a la Ciudad de México) para investigar las propiedades de las tormentas convectivas que ocurren sobre el centro de México, una región de orografía compleja. La distribución espacial muestra que las tormentas tienden a formarse y moverse hacia el oeste del radar, sobre una banda estrecha de terreno elevado. No obstante, las tormentas con los mayores volúmenes y alturas en sus topes tienden a localizarse hacia el suroeste, sobre terrenos bajos. Cada elemento convectivo se enlazó con el número de descargas eléctricas a tierra producidas en su interior, según fueron detectadas por la World Wide Lightning Location Network (Red Mundial de Localización de Rayos). Las tormentas en las que se detectaron descargas y que tuvieron un promedio de más de seis rayos en su interior, fueron significativamente más grandes e intensas que las tormentas en las que no se detectaron descargas, y tendieron a localizarse sobre terrenos más bajos. La muestra de más de 98 000 celdas identificadas se dividió en cuatro grupos de acuerdo con la elevación, para investigar posibles tendencias de las propiedades medias relacionadas con la altura del terreno, como se ha informado para otras regiones en México. En tanto que el número de tormentas por unidad de área se incrementa con la elevación del terreno, los valores promedios de las propiedades relacionadas con el tamaño (área, volumen, tope del eco) y la intensidad (reflectividad máxima, número de descargas, altura de la reflectividad máxima, máxima altura del contorno de 30 dBZ), disminuyen. Estos resultados podrían vincularse con la posibilidad de que el espesor de la parte de la nube donde ocurren los procesos de lluvia caliente sea menor en terrenos más altos. Los ciclos diurnos de la convección y del número de descargas eléctricas al norte del radar muestran un régimen de precipitación típicamente continental, con máximos a las 18:00 LT en ambas variables. No obstante, al sur del radar el máximo de descargas se detectó cerca de la medianoche, lo cual se relaciona con la convección más profunda que ocurre sobre los terrenos bajos de esa zona durante altas horas de la noche y la madrugada.
ABSTRACT
Radar data from Cerro Catedral (a peak close to Mexico City) were used to investigate the properties of convective storms over central Mexico, a region with complex orography. The spatial distribution shows a preference for storms to form and move to the west of radar, over a narrow band of high terrain. However, the storms with the higher volumes and echo-top heights tend to be located southwestward over lower terrain. Each radar feature was matched with the number of cloud-to-ground (CG) lightning produced inside it, as retrieved from the World Wide Lightning Location Network dataset. The storms in which lightning was detected, with an average of more than six lightning bolts, clearly outperform in size and intensity the group of storms in which lightning was not detected, and tend to lie over lower terrain. The sample of over 98 000 identified cells was divided into four elevation groups to look for elevation trends in the mean properties, as reported for other Mexican regions. While the number of storms per unit area increases with terrain height, the average values for properties related to both size (area, volume, echo-top height) and intensity (maximum reflectivity, number of CG bolts, height of maximum reflectivity, maximum height of 30 dBZ echo) decrease. These results could be related to the possible shallower warm-cloud depths over the higher elevations. The diurnal cycles of convection and lightning north of the radar show a nearly typical continental regime of precipitation in that zone, with maxima at 18:00 LT in both variables. However, south of the radar, a maximum in lightning activity occurs during late night and early morning, which is linked with the deeper nocturnal convection over the lower terrain in that zone.
Keywords: Convective storms, radar reflectivity, cloud-to-ground lightning, central Mexico.
1. Introduction
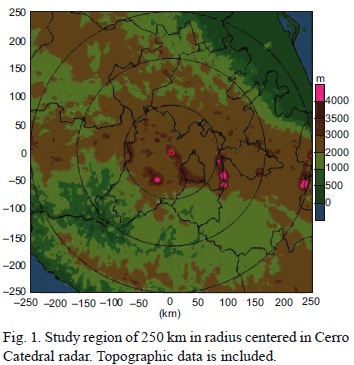
Central Mexico is a region characterized by a long belt of high terrain more than 2000 masl, which extends roughly in an east-west direction and covers a great portion of the so-called Mexican Plateau in its southernmost zone. There are places where the terrain descends abruptly to below 500 masl to the south (the Balsas River basin) and to the northeast (the coastal plain of the Gulf of Mexico), and zones with peaks more than 4000 masl (the Transversal Volcanic Axis, see Fig. 1). It also contains the greatest centers of population in the country including the State of Mexico and the Federal District, where large industrial zones exist.
The climate of central Mexico is well known and has been thoroughly described by many authors (Mosiño and García, 1974; Magaña et al., 1999; Cortez, 1999, 2000; Valdés et al., 2005; UNAM, 2007; Kucienska et al., 2010). Most of the annual precipitation in this zone comes mainly from convection during a well-defined wet season (May-October), when the number of thunderstorms increases noticeably. This is linked with the northward movement of the North Atlantic Subtropical High and the arrival of deep tropical moist air from the Gulf of Mexico over the region (Mosiño and García, 1974). Summer precipitation in the Mexico basin has been found to be mainly the result of deep convection with dominant ice phase (Kucienska et al., 2010; Montero et al., 2011). The seasonal cycle of cloud-to-ground lightning strokes over continental Mexico shows a broad maximum during the summer months from July to September (Kucienska et al., 2010).
However, there are very few studies using data with high temporal and spatial resolution. In particular, radar data have been scarcely utilized to characterize cloud systems in central Mexico. Most of the published studies are rather recent and have utilized radar in conjunction with rain-gauge data for a better estimation of surface rainfall over the Mexico basin (González, 1998; Méndez et al., 2009, 2011; Vilchis et al., 2011).
On the other hand, a comprehensive study on convective systems and precipitation has been done in northwestern Mexico in the context of the North American Monsoon Experiment (NAME) carried out during summer 2004 (Lang et al., 2007; Rowe et al., 2008, 2011). Utilizing data from the three-radar network during NAME, they found a marked diurnal cycle of convection, which begins early afternoon over the highest eastern peaks and moves westward over the coast of the Gulf of California during the late afternoon and early evening. They have also documented a marked elevation-dependent trend in convection, the latter being more frequent over higher terrain, but more intense over lower terrain.
In this study, we apply a feature identification algorithm to extract radar echoes associated with cloud systems in central Mexico during summer. Each radar feature was linked to cloud-to-ground (CG) lightning and topographic data to look for differences between CG and non-CG clouds and possible elevation-dependent trends of their properties. Spatial and diurnal distributions were obtained to determine the zones and time periods more frequently affected by severe weather.
2. Data and methods
2.1 Radar
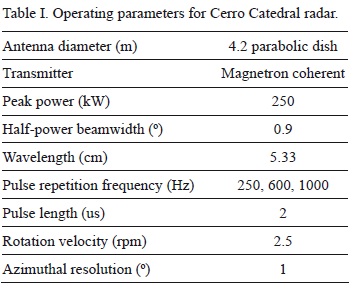
The Cerro Catedral radar is a Sigmet/Vaisala C-band Doppler radar, located at 19.55° N, 99.52° W, roughly 40 km from Mexico City, and 3790 masl. Table I lists its operating parameters. Figure 1 shows the study region of 250 km in radius centered on the Cerro Catedral radar, including topography.
The Servicio Meteorológico Nacional (SMN, Mexican Weather Service) supplied raw data from the Cerro Catedral radar for six months (July-August 2008, 2009 and 2011) with temporal resolution of 15 min. There were a total of 12 317 full radar observations for 157 days in the sample. Currently, a full volume scan is completed by this radar every 15 min through the following three steps:
• A surveillance plan position indicator (PPI) scan at elevation -0.5° with resolution 250 m up to 300 km range.
• A set of PPI scans at elevations 0, 0.9, 1.4, 2, 3, 4.5, 6, 7, 8, and 9°, with resolution from 125 m up to 250 km.
• A set of PPI scans at elevations 10, 12, 15, and 20°, with resolution from 125 m up to 125 km. Each one of these steps produces a raw file, and a full volume radar file has to be constructed merging the three parts.
The Radar Software Library (RSL) from NASA (http://trmm-fc.gsfc.nasa.gov/trmm_gv/software/rsl/) was used for the task of merging the raw files. This is a free-access suite of functions for radar data manipulation and processing, which includes code for reading a number of common data formats, Sigmet/Vaisala among them.
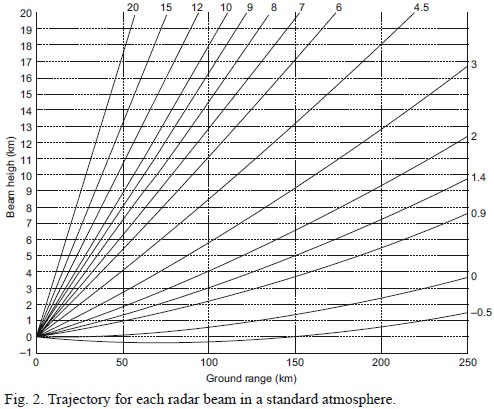
Due to the different structure of the raw files that composed a full radar scan, they were homogenized in a unique format, in which each PPI had a resolution of 125 m up to a maximum range of 250 km. Each ray of the PPI at -0.5° was interpolated linearly to double its resolution (originally 250 m) and then it was truncated at 250 km (original range was 300 km). The four highest elevations PPI (between 10 and 20°) were padded up to 250 km (originally up to 125 km) with the radar code of NODATA. This procedure does not affect the original data since the high elevations of these PPI scans do not allow them to retrieve information beyond 125 km. This can be seen in Figure 2, which shows the trajectory for each radar beam in a standard atmosphere (Battan, 1973). Even for the lowest PPI, the radar beam reaches roughly 1.5 km above the horizontal from the radar at a distance of 250 km.
In this way, a PPI matrix of size 360 x 2000 x 15 was obtained for each full volume, corresponding to 360 azimuth angles, 2000 range bins and 15 elevation angles. This matrix was then used to create constant altitude plan position indicator (CAPPI) maps. To produce CAPPI maps from PPI is equivalent to a change of basis in R3 which transforms the original spherical coordinates of the radar measurement into Cartesian coordinates, and constitutes a common practice in work with radar data because it makes it easier to interpret and post-process the data.
To create the CAPPI, we follow the interpolation method described in Mohr and Vaughan (1979) and Mohr et al. (1986). This method is also used by the software Reorder (developed at NCAR), which is widely used today (Lang and Rutledge, 2011; Rowe et al., 2011). Basically, the method interpolates the radar data on each Cartesian grid point by using the information from the four closest rays in space. In this study, we define a Cartesian grid centered on the radar with 1 km increments in the horizontal plane between -250 and 250 km and 1 km in the vertical between 0 and 20 km.
Each full volume CAPPI matrix had dimensions 501 x 501 x 21, and permitted the creation of basic radar products like maximum reflectivity (MZ), echo-top (ET, defined here as the maximum height of 0-dBZ echo) and height of maximum reflectivity (HMZ). These products were then used as input to a storm identification algorithm for extracting radar features and their properties. A storm was defined as any contiguous region in the MZ matrix for which the radar reflectivity exceeds 10 dBZ and whose maximum reflectivity exceeds 20 dBZ. Note this definition includes a large portion of the stratiform region of any storm and not only its convective core. A minimum area threshold of 4 km2 was also imposed for any region to be considered as storm.
Storm properties like the maximum reflectivity, maximum echo-top and height of maximum reflectivity were retrieved from the MZ, ET, and HMZ products, respectively, by searching for their maximum values inside the storm area. The storm volume was calculated by examining the entire echo in the vertical contained within the projection of the bi-dimensional area identified as a radar feature in the MZ map. Only grid points with reflectivity larger than, or equal to 0 dBZ were considered as part of the storm.
2.2 Cloud to ground lightning
Data from the World Wide Lightning Location Network (WWLLN) were used to link radar features with cloud-to-ground (CG) lightning strokes detected inside them. WWLLN is managed by the University of Washington (http://webflash.ess.washington.edu/) and has been shown to have a northward and westward bias, with average location errors of 4.03 km in the north-south and 4.98 km in the east-west directions, respectively (Abarca et al., 2010). Due to the rather coarse temporal resolution of radar data of 15 min, all the CG strokes detected inside each radar feature between 5 min before and 5 min after the actual volume scan were considered as produced by the same radar feature. The number of CG strokes thus detected at every 15 min interval was saved as part of the instantaneous properties of each radar feature.
2.3 Topography
Topographic data for the study region were obtained from the NASA Shuttle Radar Topographic Mission (SRTM) website (http://srtm.csi.cgiar.org/) with 90 m resolution. The closest terrain height to each radar grid point was chosen as representative of topography. Each radar feature was associated with the terrain height in its location.
2.4 Sounding
Data from the Mexico City International Airport sounding site (station #76679) were downloaded (http://weather.uwyo.edu/upperair/sounding.html) from the University of Wyoming website at 00 and 12 Z for every day during the study period. The mean heights for the freezing level, the -10 °C isotherm and the tropopause level for the six months analysis period were estimated from these data to be 4.9, 6.8 and 16.5 km asl, respectively.
2.5 Sensitivity tests
To take into account the biases that could be introduced by the complex topography of the study region, the location of the radar at high altitude and the widening of the radar beam with distance, several storm data sets were defined and sensitivity tests were carried out on them. Also, to avoid the underestimation of the maximum echo-top at short distances, each data set was required to start at 50 km from radar. A first dataset (Samplel) was composed by all the storms between 50 and 150 km from the radar whose echo tops surpassed the terrain height where each lied. Note the echo tops refer to the radar altitude because of the location of the radar at the origin of the coordinate system. The second dataset (Sample2) included all the storms detected between 50 and 200 km with echo tops higher than their associated terrain height plus 0.6 km. This last number corresponds to the approximate height for the center of the lowest radar beam at 200 km from the radar site (Fig. 2). The third dataset (Sample3) was formed by the storms detected between 50 and 250 km with echo tops taller than its terrain height plus 1.5 km, correspond ing to the approximate height of the lowest radar beam at 250 km. A fourth dataset (Sample4) was created only with the storms in Sample2 that produced CG lightning. The original and largest dataset with all the storms detected between 0-250 km without any distinction due to distance from the radar or due to echo top height, from which all the samples for sensitivity tests were obtained, will be called Sample0.
In general, the main features observed in Sample0 remained for each of the smaller samples described above. The sample with radar features detected between 50-200 km range (Sample2) was chosen as best representing the properties of convective clouds in the study region, and the storm properties are presented for this dataset. No attempt was made to correct for rain attenuation or for beam blocking effects. Absolute accuracy was less important in this study as it focused on relative differences between storm types.
3. Results
3.1 Spatial distribution
All the distributions in this section were obtained with Sample0, which covers the entire study region. As mentioned above, the main features were also observed when any other sample was chosen.
The spatial distribution of storm frequency in squares of 20 x 20 km2 (Fig. 3a) shows a storm is mainly detected along a rather narrow band near the center of the study region and oriented east-west, with higher frequency to the south of the radar. The decrease in storm detection with distance from radar can be a consequence of the high altitude of the radar location and the decrease in terrain height away from the radar. However, a relatively high storm frequency is observed to the west compared to the eastern and north-northwestern sectors.
All of these three regions (western, eastern and north-northwestern radar sectors) have roughly similar elevation (Fig. 1), which suggests that storms to the west of the radar could have higher echo-tops more frequently. In Fig. 3a the relatively higher proportion of storms over the western and southern borders of Mexico City (SSE from the radar), as well as over the western slopes of the volcano Nevado de Toluca (SW from radar) can also be seen. This has been reported before (Barros, 1994; Magaña et al., 2003; Mendez et al., 2009) and it is attributed to orographic forcing.
The spatial distribution of mean storm top (averaged over the number of storms in each grid square, Fig. 3b) shows that the zone to the west of the radar has the highest fraction of deeper storms. A secondary zone of high mean storm top is observed over the lower terrain to the southwest of the radar between roughly 140 and 210 km over the Balsas River basin. Two zones with the lowest mean storm tops are found to the north and south of the radar at approximately 125 km each, the southern one located close to a zone with much higher tops on average.
The spatial distribution of the mean area of storms is shown in Fig. 3c. There is a definite zone to the southwest of radar where the storms tend to have much larger areal extent. This zone is roughly found over the low terrain between 100 and 250 km from the radar, and in between the two observed main maxima in the spatial distribution of mean echo top height (Fig. 3b). The distribution of mean storm volume represents the combination of the two precedents (Fig. 3d). A big area with high density of large storm volume is observed to the southwest of the radar roughly between 100 and 250 km.
The mean of maximum reflectivity (Fig. 3e) distributes more uniformly with zones of slightly higher mean reflectivities to the west and south of the radar. This distribution seems to show the largest biases due to the high elevation of the lowest radar beam at long distances and the tendency for maximum reflectivity to be found at low levels in the cloud during its mature stage.
As shown in Figure 3f, the zone with the higher frequency of CG strokes coincides well with the low terrain zone where the storms are generally deeper and larger in horizontal extent, between azimuths 200° and 270° at approximately 100-250 km from radar. For comparison, another large zone with low terrain to the northeast of the radar between roughly 200-250 km range (along the coastal plains of Gulf of Mexico) has a much lower frequency of CG strokes during the period analyzed.
3.2 CG versus non-CG features
There were 71 907 radar features identified in Sample2 during the analysis period. Ofthis number, 11 368 (16%) produced at least one CG stroke and were labeled as CG storms. The rest (60 539) did not produce CG strokes and were labeled as non-CG storms. Note that some of the non-CG storms could have been producing other types of lightning like cloud-to-cloud or intra-cloud, particularly during days with high electrical activity. Table II lists the results of comparing the mean values for properties associated with CG and non-CG storms, while Table III lists the statistical significance level (calculated using the Wilcoxon two-sided rank sum test) for every difference in Table II.
CG storms were significantly larger and more intense than non-CG storms, with echotop heights about 4 km taller, five times more volume and higher values of maximum reflectivity. This suggests the existence of stronger updrafts and high concentrations of ice aloft in these clouds. Non-CG storms that produce intra-cloud lightning have been shown to be much more abundant and have a weaker reflectivity structure when compared to CG-lightning storms (Lang and Rutledge, 2011). This, in addition to the fact that the number of storms that do not produce lightning at all is usually much larger than those that produce any kind of stroke (Lang and Rutledge, 2011), possibly explains the high differences shown in Table II. The CG storms were also detected over lower terrain, as shown in Figure 3.
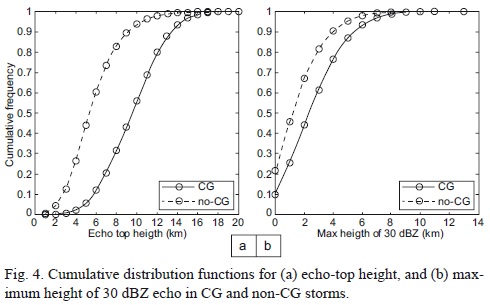
There were no evident threshold values for any variable beyond which only some type of storm could be observed. Figure 4 shows cumulative distribution functions for echo-top height (0 dBZ level) and maximum height reached by 30 dBZ echo. For any given value of these parameters, there are more CG storms proportionally, but it is also possible to associate non-CG storms with the same value. The CG storms with echo-tops reaching 10 km, or higher, represent about 45% of the total number of storms in Sample2, while non-CG storms in this range account for only ~5% (Fig. 4a). The same differences for CG and non-CG storms in samples 0, 1 and 3 were, respectively: 42-6, 43-6 and 41-7%. Moreover, about 60% of CG storms reached maximum reflectivities of 30 dBZ or more, but only 23% of non-CG storms. From these latter groups, 75% of CG storms had 30-dBZ echo at or above the freezing level (~ 4.9 km on average during the analysis period and ~1 km above radar in Fig. 4b), while only 55% of non-CG storms reached those heights. The corresponding differences for storms in Samples 0, 1 and 3 were, respectively: 74-54, 72-51 and 76-58%.
3.3 Elevation-dependent trends
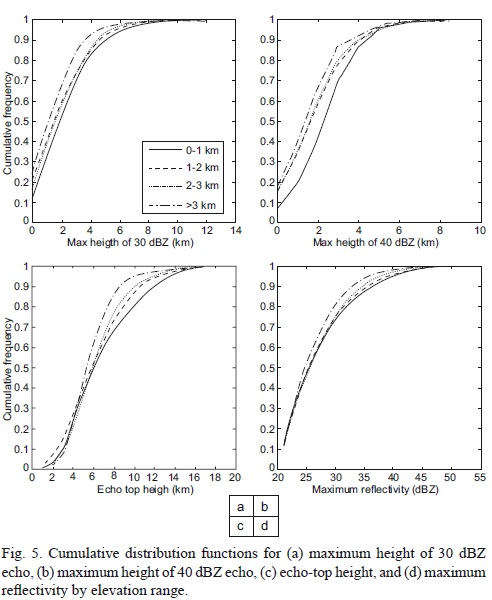
The radar features in Sample2 were divided in four groups according to the terrain height where they were detected. Mean values for the storm properties in each group are included in Table II and the significance level for their differences in Table III. The number of identified features increased with the terrain elevation, while the reflectivity structure of the storms seemed to become weaker. This latter trend was only clear from the data in Tables II and III for parameters like the number of CG strokes or the storm volume, while others like the maximum reflectivity, the echo-top height or the maximum height of 40 dBZ echo either have low statistical significance or are not always decreasing when elevation increases.
To further study the possible trend with the terrain height, Figure 5 shows cumulative distribution functions for maximum heights of 30 and 40 dBZ contours, echo-top height and maximum reflectivity. It is clear that there is an elevation-dependent trend in the behavior of these four parameters. In the case of the echo-top height (Fig. 5c) and the maximum reflectivity (Fig. 5d) the trend is observed beyond certain threshold values: 7 km and 30 dBZ, respectively. This behavior agrees with the average location of the strongest storms over low terrain observed in the spatial distribution (Fig. 3). A similar elevation-dependent trend was reported by Rowe et al. (2008) for the precipitation intensity over the rough terrain next to the eastern coast of the Gulf of California in northwestern Mexico, and it was associated with deeper above-freezing cloudy regions over the lower terrain as compared with over the higher.
3.4 Diurnal cycle
The diurnal cycle for the total number of storms in Sample2 and the total CG strokes associated are depicted in Figure 6. The total contribution from all the storms is represented by solid lines, whereas dashed lines and dotted lines show the contributions of storms located to the north or south of the radar, respectively. A marked lag is observed between the peaks of convective radar echoes and lightning activity in the study area, the former reaching its maximum at 18:00 LT and the latter at 1:00 LT (solid lines in Fig. 6a, b). This suggests that the most intense convection producing lightning does not coincide in time with the period during which precipitation is more frequent.
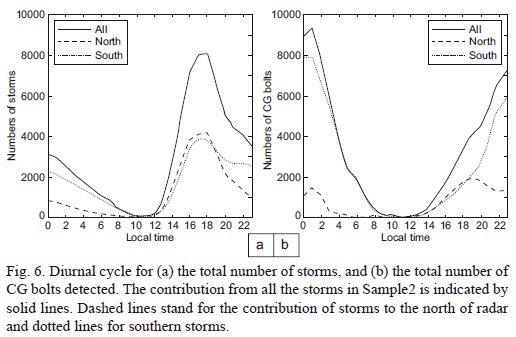
After the period with almost null convection between 10:00 and 12:00 LT, the number of storms and the lightning activity begin to rise near midday. Both parameters behave similarly in the two halves of the study region (north and south) up to near 19:00 LT, when they begin to diverge considerably, only converging again near 10:00 LT. After 19:00 LT, the number of storms in both regions continues decreasing after having reached its corresponding peaks at 18:00 LT. However, the decrease in con-vective activity for the northern half (dashed line in Fig. 6a) occurs much faster than for the southern half, resulting in the former in much less convection during late night and morning. This pattern resembles the continental regime for the diurnal cycle of precipitation in the tropics described by Kikuchi and Wang (2008), characterized by large amplitude with an afternoon peak between 15:00-18:00 LT. By contrast, the convective activity in the southern half (dotted line in Fig. 6a) decreases much more slowly during all night and the morning, and even reaches a secondary maximum near 22:00 LT. This relatively high convective activity during late night and early morning south of the radar is thought to be related with the movement of convection from the high terrain in the southern Mexican Plateau toward the lower terrain of the Balsas River basin.
Lightning activity reaches its absolute maximum at 19:00 LT in the northern half of the study region (dashed line in Fig. 6b), then decreases to a local minimum at 22:00 and reaches a secondary nocturnal maximum at 1:00 LT before decreasing rapidly between 1:00 and 3:00 LT, after which lightning activity remains at a very low value up to midday when the cycle starts again. To the south of radar, the cycle is quite different (dotted line in Fig. 6b). After 19:00 LT, the lightning activity increases very fast to reach its peak near midnight, then it begins to decrease monotonically and after 3:00 LT it is virtually the only component to the total lightning in all the study region up to 9:00 LT when the total lightning activity reaches its minimum for about 3 h. Thus, most of the lightning activity in the study region comes from the zone to the south of the radar during late night and early morning convection.
To further study the diurnal cycle of convection and its relation with terrain, Figure 7 shows the diurnal variability of echo-top height distributions through the number of occurrence of every echo-top height at 00:00, 06:00, 12:00 and 18:00 LT within the entire study region in Sample2.
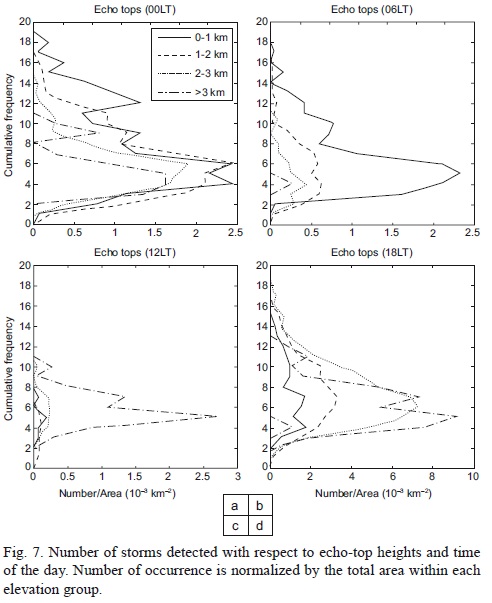
When convection starts at noon (Figs. 6a and 7c), the highest frequency of echo tops is located over the higher terrain at about 5 km. Six hours later the contribution from echo tops over lower terrain is increasing, but still convection over higher terrain dominates. Deep echoes (> 15 km) can be observed equally at high or low elevations, which explains the observed similar contribution from northern or southern convection at this time (18:00 LT, Fig. 6b). At midnight, when the lightning activity is maximum (Fig. 6b), the highest frequency of echo tops (Fig. 7a) is located over the lower terrain with deeper convection extending beyond 15 km height. By morning most of the deeper convection occurs over lower terrain with almost null convection over the highest peaks (> 3 km). This evolution is very similar to the description of diurnal convection during NAME in Rowe et al. (2008), and suggests, along with the results in Section 3a, that the observed higher-lightning activity to the south of the radar during late night and early morning (Fig. 6b) is associated with the deeper convection over the lower terrain of the Balsas River basin.
4. Summary and conclusions
The properties of convective storms in central Mexico have been scarcely studied with high spatial and temporal resolution. In this study, we use radar data during six summer months to identify and extract the storm properties associated with radar echoes. Each radar feature is linked with the number of cloud-to-ground strokes detected and with topographic data.
The convective activity in central Mexico occurs predominantly along a narrow band aligned in the east-west direction, nearly coincident with the southernmost part of the Mexican Plateau, with higher storm frequencies toward the west and south of the radar site. However, the bigger and more electrically active storms are mainly located over the low terrain of the Balsas River basin, covering a high portion of the region to the SW of the radar at long distances.
CG storms were shown to have a much stronger reflectivity structure when compared with non-CG storms, with five times more volume, 6 dBZ in excess of maximum reflectivity and 4 km taller in average. They also were detected more frequently over lower terrain, in agreement with the spatial distribution.
The comparison between radar features grouped by terrain height showed an elevation-dependent trend of their mean properties. The number of storms per area increases with the elevation, and the reflectivity structure becomes weaker. This could be related to cloud bases at higher altitudes over higher terrain, as reported for northwestern Mexico.
Diurnal cycles for the number of storms and the number of lightning bolts revealed notable differences between convection to the north and south of the radar site. To the north, both convective and lightning activity occurs mostly in phase with a peak at 18:00 LT. To the south of the radar the peak in lightning activity has a lag of near 4 h with respect to the time of maximum convective activity, suggesting a stronger reflectivity structure of the fewer storms during late night. Analysis of echo-top height distributions as a function of time and terrain show that the deepest convection during late night and early morning occurs over the lower terrain, helping to explain the very active nocturnal electrical activity to the south of the radar. This last result gives also support to the elevation-dependent trend suggested from the analysis of mean storm properties, as well as to the observed spatial distribution.
Acknowledgements
We thank Armando Rodríguez Dávila from the Servicio Meteorológico Nacional (SMN) for kindly supplying us the radar data. We are also grateful to Dr. Holzworth and his team from the University of Washington for constant data monitoring and improvements to the retrieval algorithms of WWLLN. This work was partially funded through an agreement between UNAM and the SMN.
References
Abarca S. F., K. L. Corbosiero and T. J. Galarneau Jr., 2010. An evaluation of the Worldwide Lightning Location Network (WWLLN) using the National Lightning Detection Network (NLDN) as ground truth. J. Geophys. Res. 115, D18206, doi:10.1029/ 2009JD013411. [ Links ]
Barros A. P., 1994. Dynamic modeling of orographically induced precipitation. Rev. Geophys. 32, 265-284. [ Links ]
Battan L., 1973. Radar observation of the atmosphere. University of Chicago Press, 324 pp. [ Links ]
Cortez M., 1999. Marcha anual de la actividad convectiva en México. Atmósfera 12, 101-110. [ Links ]
Cortez M., 2000. Variaciones intraestacionales de la actividad convectiva en México y América Central. Atmósfera 13, 95-108. [ Links ]
González F. J., V. Franco, G. E. Fuentes, B. Méndez and A. G. Esquivel, 1998. Estimación de la precipitación en la cuenca del Valle de México a partir de datos de lluvia captados por medio de radar. Reporte Técnico, Proyecto 8353, Instituto de Ingeniería, UNAM, México. [ Links ]
Kikuchi K. and B. Wang, 2008. Diurnal precipitation regimes in the global tropics. J. Climate 21, 2680-2696. [ Links ]
Kucienska B., G. B. Raga and O. Rodríguez, 2010. Cloud-to-ground lightning over Mexico and adjacent oceanic regions: a preliminary climatology using the WWLLN dataset. Ann. Geophys. 28, 2047-2057. [ Links ]
Lang T. J., D.A. Ahijevych, S. W. Nesbitt, R. E. Carbone, S. A. Rutledge and R. Cifelli, 2007. Radar-observed characteristics of precipitating systems during NAME 2004. J. Climate 20, 1713-1733. [ Links ]
Lang T. J. and S. A. Rutledge, 2011. A framework for the statistical analysis of large radar and lightning datasets: Results from STEPS 2000. Mon. Wea. Rev. 139, 2536-2551. [ Links ]
Magaña V., J. A. Amador and S. Medina, 1999. The midsummer drought over Mexico and Central America. J. Climate 12, 1577-1588. [ Links ]
Magaña V., J. Pérez and M. Méndez, 2003. Diagnosis and prognosis of extreme precipitation events in the Mexico City Basin. Geofis. Int. 41, 247-259. [ Links ]
Méndez B., V. Magaña, E. Caetano, R. B. Silveira and R. Domínguez, 2009. Analysis of daily precipitation based on weather radar information in Mexico City. Atmósfera 22, 299-313. [ Links ]
Méndez B., R. Domínguez, G. Soto, F. Rivera, V. Magaña and E. Caetano, 2011. Radars, an alternative in hydrolog-ical modeling. Lumped model. Atmósfera 24, 157-171. [ Links ]
Mohr C. G. and R. L. Vaughan, 1979. An economical procedure for Cartesian interpolation and display of reflectivity factor data in three-dimensional space. J. Appl. Meteorol. 18, 661-670. [ Links ]
Mohr C. G., L. J. Miller, R. L. Vaughan and H. W. Frank, 1986. The merger of mesoscale datasets into a common Cartesian format for efficient and systematic analyses. J. Atmos. Ocean. Technol. 3, 143-161. [ Links ]
Montero G., V Zarraluqui, E. S. Caetano and F. García, 2011. Hydrometeor vertical characterization of precipitating clouds over the Mexico Basin. Int. J. Rem. Sens. 32, 6367-6378. [ Links ]
Mosiño P. A. and E. García, 1974. The climate of Mexico. In: World survey of climatology, vol. 11 (R.A. Bryson and F. K. Hare, Eds.). Elsevier, 345-404. [ Links ]
Rowe A. K., S. A. Rutledge, T. J. Lang, P. E. Ciesielski and S. M. Saleeby, 2008. Elevation-dependent trends in precipitation observed during NAME. Mon. Wea. Rev. 136, 4962-4979. [ Links ]
Rowe A. K., S. A. Rutledge and T. J. Lang, 2011. Investigation on microphysical processes occurring in isolated convection during NAME. Mon. Wea. Rev. 139, 424-443. [ Links ]
UNAM, 2007. Nuevo Atlas Climático de México. Instituto de Geografía, UNAM, México. [ Links ]
Valdés-Manzanilla A., M. Cortez and J. J. Pastrana, 2005. Un estudio explorativo de los sistemas convectivos de mesoescala en México. Boletín del Instituto de Geografía 56, 26-42. [ Links ]
Vilchis I., E. Quentin and K. M. Ba, 2011. Estimación de precipitación diaria a través de un SIG con imágenes de radar meteorológico. Tecnología y Ciencias del Agua 2, 167-174. [ Links ]

