


Services on Demand
Journal
Article
 English (pdf)
 Article in xml format
 Article references
 Send this article by e-mail
Indicators
-
 Cited by SciELO
 -
 Access statistics
Related links
-
 Similars in
SciELO
Similars in
SciELO
Share

 Permalink
Atmósfera
Print version ISSN 0187-6236
Atmósfera vol.26 n.1 Ciudad de México Jan. 2013
Effects of weather types on hospital admissions for respiratory diseases in Castilla-La Mancha, Spain
F. De Pablo Dávila, L. Rivas Soriano, J. M. Sánchez LLorente
Departamento de Física de la Atmosfera, Facultad de Ciencias, Universidad de Salamanca, Salamanca, España Corresponding author: F. de Pablo; e-mail: fpd123@usal.es
A. Nájera López
Departamento de Ciencias Médicas, Facultad de Medicina, Universidad de Castilla-La Mancha, Albacete, España.
Received January 9, 2012; accepted August 28, 2012
RESUMEN
El objetivo de este estudio consiste en evaluar la relación entre el riesgo de ingreso hospitalario por enfermedades respiratorias habidos en hospitales de Castilla-La Mancha, España, y los tipos diarios de masas de aire (situaciones meteorológicas) presentes durante el periodo 2000-2006, utilizando un enfoque climatológico sinóptico. Se determinaron los principales tipos de circulación atmosférica presentes en la zona para el invierno y la primavera (estaciones en que las admisiones hospitalarias de carácter respiratorio son máximas), así como sus distribuciones de frecuencia. Se analizan las características principales de los ingresos hospitalarios y su distribución en los siete años estudiados, junto con las distribuciones de frecuencia clasificadas por sexo y edades, estaciones climáticas, meses y días de la semana. Además, se realiza un análisis entre la clasificación obtenida de masas de aire y los ingresos hospitalarios, mediante la utilización de un índice de admisión o tasa relativa. Los resultados revelan diferentes respuestas en la tasa de ingreso por enfermedades respiratorias frente a los ocho tipos de masas de aire identificados en invierno y en primavera. En invierno, las tres masas de aire dominantes que se asocian, las circulaciones del suroeste, las anticiclónicas y las híbridas anticiclónicas del suroeste, presentan valores 1.5 veces superiores al promedio de ingresos respectivos, mientras que en la primavera no se observan diferencias significativas en el número de admisiones frente a los tipos de tiempo.
ABSTRACT
The aim of this study is to evaluate the relationship between the risk of hospital admission for respiratory diseases (RD) and the daily weather types during the period 2000-2006. A synoptic climatological approach is used to investigate links between air-mass types (weather situations) and all respiratory hospital admissions in the Castilla-La Mancha (CLM) area in Spain. This afforded the main circulation weather types (CWTs) for the winter and spring periods (since respiratory hospital admissions reached their maximum during these seasons) and the frequency distributions of these types were analyzed. A summary of the main characteristics of the hospital admission series and their distribution over the seven years studied, together with the frequency distributions of the admissions classified by sex and ages, for season, month and for each day of the week, is reported. In addition, a comparison between air-mass classification and hospital admissions is made using an admission index (AI). The results reveal different responses of respiratory admission rates to the eight air-mass types identified in winter and in spring. In winter, three air massess southwesterly (SW), anti-cyclonic (A) and hybrid anti-cyclonic southwesterly (HASW), are associated with values 1.5 times higher than the respective average admission rates, while in spring no significant differences are seen.
Keywords: Air-mass types, respiratory diseases, hospital admission index, Castilla-La Mancha (Spain).
1. Introduction
Since diseases of the respiratory apparatus are one of the main causes of morbidity and mortality in most countries, studies addressing the relationship between this type of pathology and the determinant variables and factors of the climate have increased, varying results being reported. The seasonal causes of the increases in asthma have been explained in terms of meteorological and pollutant variables. Regarding the meteorological variables, different authors have concluded that the symptoms may be related to the temperature prevailing during cold periods (Beer et al., 1991; Yuksel et al., 1996), changes in temperature (Crighton et al., 2001), relative humidity and rainfall (Celenza et al., 1996), fog (Kashiwabara et al., 2002), wind speed (Hashimoto et al., 2004), and changes in barometric pressure and storms (Sutherland and Hall, 1994; Newson et al., 1997).
Regarding pollutants, not analyzed in the present paper, hospital admissions due to asthma may rise in periods of poorer air quality and, in particular, admissions due to rises in ozone concentrations may increase (Fusco et al., 2001; Tortolero et al., 2002). An association between daily ozone levels and respiratory symptoms has been reported (Romieu et al., 1996; Rabinovitch et al., 2004). Nevertheless, some authors have failed to note a significant relationship between ozone levels and morbidity (Atkinson et al., 1999; Farhat et al., 2005; Hinwood et al., 2006). Such differences are probably due to geographic reasons, although they may also be linked to the type of methodology employed. In Spain, similar analyses relating mortality to air pollution (Sunyer et al., 1996; Ballester et al., 2001; Díaz et al., 2004; de Pablo et al., 2006) or atmospheric variables (González et al., 2001; Linares et al., 2006) only date back to a few years ago.
The aim of this paper is to search for links between weather situations and health for the Castilla-La Mancha (CLM) region in central Spain. The approach adopted is a synoptic climatological one, whose usefulness has been clearly demonstrated for analyzing climate-morbidity relationships (de Pablo et al., 2009). This study will attempt: (1) to identify the major circulation weather types (CWTs) (weather situations) in winter and spring that affect the CLM area; (2) to examine the seasonal, monthly and day-of-the-week variations in the occurrence of respiratory diseases in the period 2000-2006; and (3) to assess whether links exist between the CWTs identified and daily respiratory admissions.
2. Methods
2.1 Study area
Castilla-La Mancha is made up of five provinces: Albacete, Ciudad Real, Cuenca, Guadalajara and Toledo (Fig. 1). This autonomous community is delimited by the Central Mountain Chain in the north, by the Iberian Mountain Chain in the northeast, and by the Mountains of Toledo, over a total surface of 79 395 km2. Temperatures are extreme, with very hot summers and very cold winters, with a thermal oscillation of18.5 °C. The summers are dry and the temperature often reaches more than 30 °C. However, in winter, temperatures are frequently less than 0 °C, even reaching -20 °C on clear nights, with sporadic snowfall (Nájera et al., 2009). Rainfall is not very abundant and it shows an important gradient from the central region, where it is usually around 400 mm per year, to mountainous zones, where it exceeds 1000 mm per year.
According to the population census of 2006 from the Instituto Nacional de Estadística (INE, 2006) the region had a total population of 1 932 261 inhabitants distributed over its whole surface, i.e. a mean population density of 24.3 inhab/km2. Table I shows the population and total area of the provinces considered as well as the geographical characteristics of the five main cities in the región. The percentage of population with ages between 14 and 44 years accounts for 44% of the total population; the population between 45 and 64 year old represents 21.3%, and the population over 65 years old forms 18%. Finally, children under 14 years old represent 18% of the total population. Considering sex, 50.25% are male and 49.75% are female.
2.2 Data
For the present analysis, the daily hospital admission data for residents living in the five provinces analyzed corresponding to January 1, 2000, to December 31, 2006, were collected from the database of the respective medical reference centers, one per province, and were coded according to the International Classification of Diseases, Revision 10 (ICD-10). The hospital admission data were classified as pertaining to patients admitted for respiratory diseases (ICD-10 J00-J98), and the data were also classified by sex and age (younger than 65 years and older than 65 years). To analyze the data, we considered spring as lasting from March 1 to May 31; summer, June 1 to August 31; autumn, September 1 to November 30; and winter, December 1 to February 28-29.
2.3 Daily circulation weather types
Most synoptic techniques employed classify each of the days analyzed within discrete classes, characterized by dominant airflow, and from these classes or groups they describe the most important meteorological situations associated with each of these types. Initially developed by Jenkinson and Collison (1977) and Jones et al. (1993), they have been applied with a view to automatically reproduce the subjective classification developed by Lamb (1972) for the British Isles, and improved by Yarnal et al. (2001). Although such methods have been used fairly satisfactorily in many different applications (Goodess and Palutikov, 1998; Trigo and DaCamara, 2000), this discrete classification does have certain subjective aspects and affords little information about the strength ofthe systems in circulation or about wind intensity, even though both aspects clearly influence the resulting information.
The daily atmospheric circulation affecting the Iberian Peninsula can be characterized through the use of a series of indices associated with the direction and vorticity of geostrophic flow. For a more exhaustive development of this methodology, readers are referred to the work of Spellman (2000), Trigo and DaCamara (2000), and Santos et al., (2005).
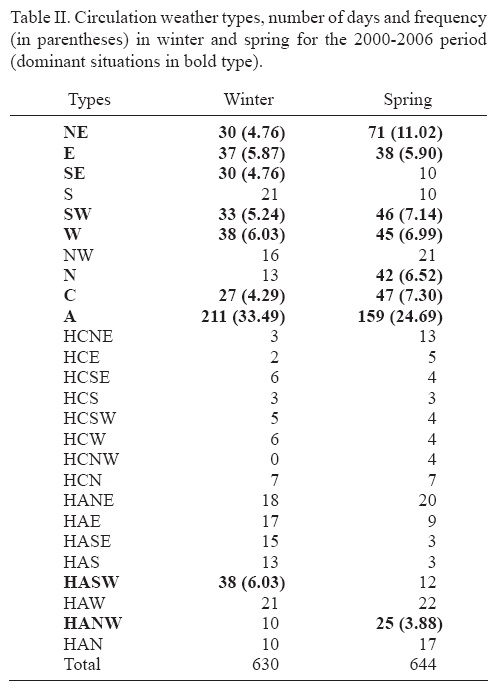
Daily sea level pressure (SLP) values were obtained from reanalysis data from the National Center for Environmental Prediction (NCEP) (Kalnay et al., 1996), through the NOAA/NCEP web page (2009) over a 5° x 5° longitude-latitude grid from 40° W to 25° E and 20° N to 70° N, from January 2000 to December 2006. With these data, a classification of 26 CWTs was obtained for the Iberian Peninsula using the above-mentioned methodology (Table II). In order to simplify the classification obtained originally, some authors such as Trigo and DaCamara (2000) have regrouped the 26 initial CWTs in 10 basic types, including the 16 hybrid situations obtained by them for the corresponding directional, cyclonic or anti-cyclonic situations, assigning them a weight or participation of 0.5. In our case, with a view to reducing the classifications obtained initially, we decided to define dominant types as those whose frequency of occurrence surpassed the average value corresponding to the period 2000-2006. According to this criterion, the most important weather types of the winter air masses finally selected were northeasterly (NE), easterly (E), southwesterly (SW), westerly (W), southeasterly (SE), cyclonic (C), anti-cyclonic (A), as well as some hybrid transitional situations, such as hybrid anti-cyclonic southwesterly (HASW), which represent the days that could not be unequivocally assigned to a pure selected type of situation; the spring air masses selected were northeast (NE), east (E), southwest (SW), west (W), north (N), cyclonic (C), anti-cyclonic (A) and hybrid anti-cyclonic northwest (HANW) (see Table II). We also provide a summary of the most important meteorological characteristics of the air masses finally selected (Table III).
2.4 Hospital admission index
Since admission rates increased over the seven years studied, as a result of changes in health legislation that led more people to visit hospitals as opposed to their family doctor, admission statistics were calculated for each individual year. To facilitate multi-year comparisons of respiratory hospital admissions among the air-mass type classifications, the admission indices (AI) were calculated (Eq. [1]) following the approach proposed by McGregor et al., (1999):
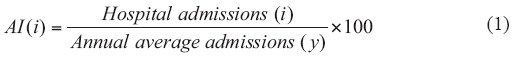
where (i) and (y) represent a specific day and year, respectively. This is simply the ratio of daily admissions to the yearly average expressed as a percentage. This index standardizes the admissions data with respect to the mean of an individual year. Thus, an AI of150 is interpreted as admissions being 1.5 times higher than the annual average.
The statistical distribution of hospital admissions for respiratory diseases followed a Poisson distribution and hence to examine inter-annual trends, as well as the seasonal, significant monthly and daily variations of RD, we applied the x2 goodness of fit test. The distribution of AI was not exponential (Kolmogorov-Smirnov test) and neither was it normal (Shapiro-Wilk normality test). Accordingly, CWTs were tested for AI differences using a non-parametric procedure, the Mann-Whitney U test, which is the one most widely used (Sneyers, 1990). U test is an alternative to the t-test. It uses the relative magnitudes of the observations in two data series to determine their ranks within a single distribution, and it does not require the data to be distributed normally (McCuen, 1993). Very large or small U values imply a separation of the ordered observations and are evidence of a difference between the population distributions represented by the samples. The null hypothesis that the two data samples are drawn from the same population is tested using a two-tailed t-test at the 1% confidence level to allow an increasing or decreasing change in the data series. The probability that the observed value of the U statistic will occur according the null hypothesis is expressed by the p value. Whenp < 0.01, the Utest is statistically significant and it is unlikely that the two samples will be from the same population.
3. Results and discussion
3.1 Daily hospital admissions characteristics
The distribution of hospital admissions over the seven years studied (Table IV) reveals a significant linear increase (p < 0.01) in respiratory causes, both by gender and by age. The highest number of admissions was recorded in 2005, exceeding the year with lowest incidence (2000) by 1.4 times. The total number of admissions was lower for females (47 885 cases) than for males (81 998 cases), with 42.56% for subjects < 65 years of age. The average daily number was 50.8 admissions/day (32.1 admissions/day for males and 18.7 admissions/day for females) and the maximum daily incidence corresponded to 2005, with 38.31 admissions/day for males and 37.11 admissions/day for > 65-year-old subjects. The asymmetry (1.086) and sharpness (2.848) coefficients indicate that the frequency distributions are not strictly normal.
3.2 Seasonal, monthly, and weekly distributions
Table V shows the average number of hospital admissions for each season, month and day of the week by gender and by age. We examined possible seasonal variations by using a c2 test, and for the period analyzed (84 months) hospital admissions for RD show a weak seasonal behavior: maximum values mainly occurring in winter, spring and autumn, and minimum values in the summer, although the seasonal differences are small (for all cases p < 0.001). In all seasons, the admissions of males were greater than for females, with a ratio between 1.6 in the winter to 1.8 in the summer, and in the case of subjects younger than 65 the ratio was nearly 1.5:1. These characteristics are similar to those reported in better-developed countries (McGregor et al., 1999; Morabito et al., 2005). By months, the number of hospital admissions was maximum in January and minimum in August (2.6 times), with significant differences between each month (j2 test, p < 0.001). Similar trends were obtained for both series according to gender and age, with the exception of March. The distribution for each day of the week revealed that the maximum number of admissions occurred in the middle of the week (Tuesday-Friday) and the lowest number at weekend-Monday, regardless of sex or age.
3.3 The effect of weather types on morbidity in winter and spring
As indicated above, respiratory hospital admissions were highest in winter and spring, and therefore we selected these two periods for the following studies. We classified each day of these two periods and determined the corresponding CWTs, selecting only dominant situations (Table II). In our case, the reduction of 26 initial CWTs into eight dominant situations showed that the weather types for the winter were NE, E, SE, SW, W, C, A, and HASW, this latter type representing days that could not be unequivocally assigned to a pure type situation. These eight types included a total of 444 days (70.5% of the total). For the spring, the classification revealed that the eight dominant types were NE, E, SW, W, N, C, A, and HANW, which included 473 days representing 73.4% of the whole period. It should be noted that a small number of days (< 5%), belonging to the non-classified (U) type of situations, was excluded from the study. For both periods, the most frequent situation was anti-cyclonic, which occurred 33.5% of the times during winter and 24.7% in the spring.
Upon analyzing the inter-annual variability of the dominant air masses for each season to determine the percentage of occurrence of the eight dominant weather types for the winter and spring (Table VI), it was seen that the anti-cyclonic type situation was dominant in both seasons. In addition, there were significant inter-annual variations in other types of weather. Thus, in winter, E situations varied between 0 and 14.4%, SE situations between 0 and 15.6%, and C situations between 0 and 10.0%. The winter of 2000-2001 had a low frequency of anti-cyclonic situations, probably due to the increase in SW, W and HASW situations, and by the spring there was a strong variation in cyclonic situations, ranging from 1.1% for 2001 to 16.3% for 2000.
3.4 Basic characteristics of the hospital admission index (AI)
Figure 2 shows the mean number of admission index for respiratory reasons during the winter and spring by day of the week. The period between Monday and Friday had high AI values, while low values were recorded during the weekend. The U test revealed significant differences between Saturdays and Sundays (low AI values) while high AI values were obtained from Monday to Friday (p < 0.001).

To determine the difference between the number of admissions and its relationship with CWTs, we divided the total number of days (1274, 630 from the winter and 644 from the spring) into four groups to apply a X2 test and conditional probability analysis. These analyses detected a strong dependence (p < 0.001) of AI on both weather periods. Conditional probability must be interpreted as the probability of the CWT to obtain an AI above a given value. As already mentioned, an AI of 150 (or 125) must be interpreted as admissions being 1.5 (or 1.25) times higher than the annual average for each CWT. Table VII shows the relative importance of the effect of each CWT and its relationship with AI. During the winter, the importance of SW, A and HASW situations must be stressed in the case of extreme events (AI > 150), while no differences were found in spring. Also, types E, A and SE have high conditional probabilities for an AI of 125 or higher, which is especially noteworthy in winter. During the spring, C, A and W situations are the ones that present conditional probabilities of AI >125.
McGregor (2001) found different responses of respiratory admission rates and mortality due to ischemic heart disease for the Birmingham area (UK) to different winter air-mass types and large-scale atmospheric circulation variables. This is consistent with the findings of recent studies. Smoyer et al. (2000) reported results indicating that strong weather conditions have a greater impact on mortality than high concentrations of air pollutants.
4. Conclusions
There have been no previous studies addressing the influence of weather types on health indicators on the Central Spanish Plateau. The information obtained here is novel and useful for drawing up appropriate health plans and implementing suitable preventive measures and interventions, targeting lifestyles or types of behaviors known to be risk factors. It is also interesting for methodologies that enable this type of analysis to target more extensive geographic areas with low population densities, in which it would otherwise be difficult to find statistically significant results.
From the statistical analysis presented above, the following main conclusions may be drawn. In the period studied (2000-2006), the mean number of daily hospital admissions was 50.8, and the maximum daily incidence was 174. The male/female ratio was 1.7 in favor of men and the age > 65/age < 65 ratio was 1.3. The asymmetry and sharpness coefficients indicate that the frequency distribution is not strictly normal. The distribution of hospital admissions over the seven years studied shows a significant linear increase from 2000 to 2006 (p < 0.01). There are significant differences between seasonal values (p < 0.001), with a maximum in winter (January) and a minimum in summer (August); for the weekly values, the maximum number of admissions occur throughout the central days of the week (Tuesday-Thursday) and the lowest number of admissions is seen at weekend, regardless of the sex and age.
The present work shows that hospital admissions due to respiratory diseases in CLM are strongly related to specific weather types. Observing the relationships between the admissions and daily atmospheric conditions, in cases of extreme events (AI > 150), the results obtained show the relative importance in winter of SW, A and HASW situations, while no differences were found in spring.
The main limitation of the present study is that although the amount of data of hospital admissions for respiratory causes is significant, the results would be improved if a long-term study covering more than seven years could be undertaken. It was for this reason that we decided not to consider gender or age groups. These results cannot be extrapolated to a larger territory owing to the limited geographical area under study.
Acknowledgement
Drs. Enrique Almar and Antonio Mateos from the Regional Health Ministry, Government of Castilla-La Mancha, provided hospital admission data. The study was funded by the Fundación para la Investigación Sanitaria de Castilla-La Mancha (FISCAM); grant number: PI-2006/13.
References
Atkinson R. W., S. A. Bremner, H. R. Anderson, D. P. Strachan, J. M. Bland and A. P. de Leon, 1999. Short-term associations between emergency hospital admissions for respiratory and cardiovascular disease and outdoor air pollution in London. Arch. Environ. Health 54, 398-411. [ Links ]
Ballester F., J. M. Tenías and S. Pérez-Hoyos, 2001. Air pollution and emergency hospital admision for cardiovascular diseases in Valencia, Spain. J. Epidemiol. Commun. H. 55, 57-65. [ Links ]
Beer S. I., Y. I. Kannai and M. J. Waron, 1991. Acute exacerbation of bronchial asthma in children associated with afternoon weather changes. Am. Rev. Respir. Dis. 144, 31-35. [ Links ]
Celenza A., J. Fothergill, E. Kupek and R. J. Shaw, 1996. Thunderstorm associated asthma: A detailed analysis of environmental factors. Brit. Med. J. 312, 604-607. [ Links ]
Crighton E. J., M. M. Mamdani and R. E. Upshur, 2001. A population based time series analysis of asthma hospitalizations in Ontario, Canada: 1988-2000. BMC Health Serv. Res. 1, 7. [ Links ]
De Pablo F., A. López, L. Rivas Soriano and C. Tomás, 2006. Relationships of daily mortality and hospital admissions to air pollution in Castilla-León, Spain. Atmósfera 19, 23-39. [ Links ]
De Pablo F., C. Tomás, L. Rivas and L. Diego, 2009. Winter circulation weather types and hospital admissions for cardiovascular, respiratory and digestive diseases in Salamanca, Spain. Int. J. Climatol. 29, 1692-1703. [ Links ]
Díaz J., C. Linares, R. García-Herrera, C. López and R. Trigo, 2004. Impact of temperature and air pollution on the mortality of children in Madrid. J. Occup. Environ. Med. 46, 768-774. [ Links ]
Farhat S. C., R. L. Paulo, T. M. Shimoda, G. M. Conceição, C. A. Lin, A. L. Braga, M. P. Warth and P. H. Saldiva, 2005. Effect of air pollution on pediatric respiratory emergency room visits and hospital admissions. Braz. J. Med. Biol. Res. 38, 227-235. [ Links ]
Fusco D., F. Forastiere, P. Michelozzi, T. Spadea, B. Ostro, M. Arca and C. A. Perucci, 2001. Air pollution and hospital admissions for respiratory conditions in Rome, Italy. Eur. Respir. J. 17, 1143-1150. [ Links ]
González S., J. Díaz, M. S. Pajares, J. C. Alberdi, C. López and A. Otero, 2001. Relationship between atmospheric pressure and mortality in the Madrid Autonomous Region: A time series study. Int. J. Biometeorol. 45, 34-40. [ Links ]
Goodess C. and J. Palutikov, 1998. Development of daily rainfall scenarios for southeast Spain using a circulation type approach to downscaling. Int. J. Climatol. 18, 1051-1081. [ Links ]
Hashimoto M., T. Fukuda, T. Shimizu, S. Watanabe, S. Watanuki, Y. Eto and M. Urashima, 2004. Influence of climate factors on emergency visits for childhood asthma attack. Pediatr. Int. 46, 48-52. [ Links ]
Hinwood A. L., K. N. De, C. Rodriguez, P. Jacoby, T. Runnion, P. Rye, L. Landau, F. Murray, M. Feldwick and J. Spickett, 2006. The relationship between changes in daily air pollution and hospitalizations in Perth, Australia 1992-1998: A case crossover study. Int. J. Environ. Health Res. 16, 27-46. [ Links ]
INE, 2006. Cifras de población. Real Decreto 1627/2006, de 29 de diciembre, por el que se declaran oficiales las cifras de población resultantes de la revisión del padrón municipal referidas al 1 de enero de 2006. Instituto Nacional de Estadística. Boletín Oficial del Estado 312, 46628-46630. [ Links ]
Jenkinson A. and B. Collinson, 1977. An initial climatology of gales over the North Sea. Synoptic Climatology Branch Memorandum No. 62. London: Meteorological Office, 18 pp. [ Links ]
Jones P., M. Hulme and K. Briffa, 1993. A comparison of Lamb circulation types with an objective classification scheme. Int. J. Climatol. 13, 655-663. [ Links ]
Kalnay E., M. Kanamitsu, R. Kistler, W. Collins, D. Deaven, L. Gandin, M. Iredell, S. Saha, G. White, J. Woollen, Y. Zhu, A. Leetmaa, R. Reynolds, M. Chelliah, W. Ebisuzaki, W. Higgins, J. Janowiak, K. C. Mo, C. Ropelewski, J. Wang, R. Jenne and D. Joseph, 1996. NCEP/NCAR Reanalysis 1: Pressure. http://www.cdc.noaa.gov/data/gridded/data.ncep.reanalysis.pressure.html [accessed 4 Jun 2009] [ Links ].
Kashiwabara K., H. Kohrogi, K. Ota and T. Moroi, 2002. High frequency of emergency room visits of asthmatic children on misty or foggy nights. J. Asthma 39, 711-717. [ Links ]
Lamb H. H., 1972. British Isles weather types and a register of daily sequence of circulation patterns, 1861-1971. Geophysical Memoir 116. Great Britain Meteorological Office. London: H. M. Stationary Office. [ Links ]
Linares C., J. Díaz, A. Tobías, J. M.de Miguel and A. Otero, 2006. Air pollutants and noise levels over daily hospital admissions in children in Madrid: a time series analysis. Int. Arch. Occ. Env. Hea. 79, 143-152. [ Links ]
McCuen R. H., 1993. Microcomputer applications in statistical hydrology. New Jersey: Prentice Hall, 306 pp. [ Links ]
McGregor G. R., S. Walters and J. Wordley, 1999. Daily hospital respiratory admissions and winter air-mass types, Birmingham, UK. Int. J. Biometeorol. 43, 21-30. [ Links ]
McGregor G. R., 2001. The meteorological sensitivity of ischaemic heart disease mortality events in Birmingham, UK. Int. J. Biometeorol. 45, 133-142. [ Links ]
Morabito, M., P. Amedeo, L. Cecchi, A. Crisci, S. Orlandini, G. Maracchi and G. F. Gensini, 2005. Relationships between weather and myocardial infarction: A biometeorological approach. Int. J. of Cardiology 105, 288-293. [ Links ]
Nájera A., F. de Pablo, E. Arribas and C. Tomas, 2009. Aspectos climáticos de la ciudad de Albacete (1961-2005). España: Diputación de Albacete, 321 pp. [ Links ]
Newson R., D. Strachan, E. Archibald, J. Emberlin, P. Hardaker and C. Collier, 1997. Effect of thunderstorms and airborne grass pollen on the incidence of acute asthma in England, 1990-94. Thorax 52, 680-685. [ Links ]
Rabinovitch N., L. Zhang, J. R. Murphy, S. Vedal, S. J. Dutton and E. W. Gelfand, 2004. Effects of wintertime ambient air pollutants on asthma exacerbations in urban minority children with moderate to severe disease. J. Allergy Clin. Immunol. 114, 1131-1137. [ Links ]
Romieu I., F. Meneses, S. Ruiz, J. J. Sienra, J. Huerta, M. C. White and R. A. Etzel, 1996. Effects of air pollution on the respiratory health of asthmatic children living in Mexico City (part I). Am. J. Respir. Crit. Care Med. 154, 300-307. [ Links ]
Santos J. A., J. Corte-Real and S. M. Leite, 2005. Weather regimes and their connection to the winter rainfall in Portugal. Int. J. Climatol. 25, 33-50, doi:10.1002/joc.1101. [ Links ]
Smoyer K. E., L. S. Kalkstein, J. S. Greene and H. Ye, 2000. The impacts of weather and pollution on human mortality in Birmingham, Alabama and Philadelphia, Pennsylvania. Int. J. Climatol. 20, 881-897. [ Links ]
Sneyers, R., 1990. On the statistical analysis of series of observations. Secretariat of the World Meteorological Organization, 192 pp. (WMO, 415). [ Links ]
Spellman G., 2000. The application of an objective weather-typing system to Iberian Peninsula. Weather 55, 375-385. [ Links ]
Sunyer J., J. Castellsague, M. Sáez, A. Tobías and J. M. Antó, 1996. Air pollution and mortality in Barcelona. J. Epidemiol. Commun. H. 50, 76-80. [ Links ]
Sutherland A. and I. P. Hall, 1994. Thunderstorms and asthma admissions. Lancet 344, 1503-1504. [ Links ]
Tortolero S. R., L. K. Bartholomew, S. Tyrrell, S. L. Abramson, M. M. Sockrider, C. M. Markham, L. W. Whitehead and G. S. Parcel, 2002. Environmental allergens and irritants in schools: A focus on asthma. J. Sch. Health 72, 33-38. [ Links ]
Trigo R. M. and C.C. DaCamara, 2000. Circulation weather types and their influence on the precipitation regime in Portugal. Int. J. Climatol. 20, 1559-1581. [ Links ]
Yarnal B., A. C. Comrie, B. Frakes and D. P. Brown, 2001. Developments and prospects in synoptic climatology. Int. J. Climatol. 21, 1923-1950. [ Links ]
Yuksel H., R. Tanac, E. Tez, E. Demir and M. Coker, 1996. Childhood asthma and atmospheric conditions. Acta Pediatr. Jpn. 38, 606-610. [ Links ]

