


Servicios Personalizados
Revista
Articulo
 Inglés (pdf)
 Artículo en XML
 Referencias del artículo
 Enviar artículo por email
Indicadores
-
 Citado por SciELO
 -
 Accesos
Links relacionados
-
 Similares en
SciELO
Similares en
SciELO
Compartir

 Permalink
Atmósfera
versión impresa ISSN 0187-6236
Atmósfera vol.26 no.1 Ciudad de México ene. 2013
Determination of the Jenkinson and Collison's weather types for the western Mediterranean basin over the 1948-2009 period. Temporal analysis
M. Grimalt, M. Tomàs, G. Alomar
Group of Climatology, Hidrology and Natural Hazards, University of Balearic Islands, 07122-Palma, Spain Corresponding author: Miquel Grimalt; e-mail: miquel.grimalt@uib.es
J. Martin-Vide, M. C. Moreno-García
Group of Climatology, University of Barcelona, Montalegre 6, 08001-Barcelona, Spain
Received October 18, 2011; accepted August 13, 2012
RESUMEN
Se han determinado los tipos de clima según el procedimiento de Jenkinson y Collison de los 22 646 días del periodo 1948-2009 para la cuenca del Mediterráneo occidental, a partir de los valores de presión en superficie del reanálisis NCEP/NCAR, para una retícula de nueve puntos con vértices extremos en 45° N, 5° W y 35° N, 15° E, lo que permite disponer de un amplio catálogo sinóptico para la citada región. Se han analizado las tendencias de los tipos y sus diferentes agrupaciones durante el mismo periodo. El tipo más frecuente es el U (indeterminado), con un promedio anual cercano al centenar de días (99.4, 27.2%); le siguen el tipo A (anticiclón), con 75.5 días/año (20.7%), y el C (depresión), con 67.8 días/año (18.6%). La elevada frecuencia del tipo U se debe a la presencia habitual de campos báricos con escaso gradiente ("pantanos barométricos") sobre las aguas mediterráneas en la mitad cálida del año. Por rumbos, los tipos procedentes del oeste son los más frecuentes y los del sur, los menos. El régimen mensual de los tipos y agrupaciones más frecuentes es bastante regular; el tipo C y las agrupaciones advectivas y de tipos ciclónicos presentan mínimos estivales y máximos en la mitad fría del año, mientras que ocurre lo contrario con los tipos U y A. Las principales tendencias anuales estadísticamente significativas del periodo 1948-2009 son la disminución del tipo A (-4.19 días/década, es decir, -29.0%) y el aumento del tipo U, los tipos ciclónicos y los de componente este. Al comparar los subperiodos de 31 años 1948-1978 y 1979-2009, se confirman las tendencias de A y U, y se aprecian en general aumentos de los tipos con componente este y disminución de los que tienen componente oeste. La variación del tipo A fue de 2490 días en el primer subperiodo a 2192 en el segundo (p = 0.000), concentrada sobre todo en verano y otoño. Esta clara reducción del tipo A coincide paradójicamente con un aumento de la variable presión (+0.31 hPa/década) a lo largo de los 62 años de análisis. La tendencia negativa encontrada en el tipo A difiere de los resultados hallados en algunos estudios. Los diferentes periodos de análisis, las distintas escalas o áreas de estudio y la variedad de métodos usados para la determinación de los tipos de tiempo pueden explicar la falta de concordancia en los resultados. Además, el calentamiento en las últimas décadas de las aguas de la cuenca del Mediterráneo occidental, amén del carácter marcadamente ciclogenético de los golfos de León y Génova, podría estar detrás de la disminución del tipo A y el aumento de los tipos con curvatura ciclónica.
ABSTRACT
We determined the weather type, according to the Jenkinson and Collison procedure, of the 22 646 days in the 1948-2009 period for the western Mediterranean basin. The analysis is based upon the surface pressure values of the NCEP/NCAR reanalysis, for a grid of nine points with extreme vertices at 45° N, 5° W and 35° N, 15° E, which provides a broad synoptic catalogue for this region. We analyzed the trends of the types and their different groupings during the same period. The most frequent type is U (undetermined), with an annual average of approximately 100 days (99.4, 27.2%), followed by type A (anticyclone), with 75.5 days/ year (20.7%), and C (depression), with 67.8 days/year (18.6%). The high frequency of type U is due to the habitual pressure of baric fields with a low gradient over Mediterranean waters in the warm half of the year. According to their directions, the types from the west are the most frequent and those from the south, the least. The monthly regime of the most frequent types and groupings is quite regular; type C groups, as well as advective and cyclonic curvature groups, present summertime minima and maxima in the cold half of the year, whereas the opposite occurs with types U and A. The main statistically significant annual trends in the 1948-2009 period involve a decrease in type A (-4.19 days/decade, that is, -29.0%) and an increase in type U, the cyclonic types and those presenting an easterly component. On comparing the 31-yr sub-periods 1948-1978 and 1979-2009, the tendencies of A and U were confirmed, and increases can generally be seen in the types presenting an easterly component and a decrease in those with a westerly component. The variation in type A ranged from 2490 days in the first sub-period to 2192 in the second one (p = 0.000), mainly concentrated in summer and autumn. This evident reduction of type A coincides, paradoxically, with an increase in the sea surface pressure variable (+0.31 hPa/decade) throughout the 62 years of analysis. The negative trend found in type A differs from the results of some studies. The different analysis periods, the different scales or areas of study and the variety of methods used to determine the weather types can account for the fact that these results are discordant. Moreover, warming over the last few decades in the waters of the western Mediterranean basin, as well as the clearly cyclogenetic character of the gulfs of Lion and Genoa, might account for the decrease in type A and the increase in the cyclonic curvature types.
Keywords: Jenkinson and Collison, trends, weather types, western Mediterranean.
1. Introduction
Substantial advances have been made in recent years with regard to the objectification of synoptic classifications, circulation patterns or weather types, due to the proposal of objective or automatic methods. Traditional subjective or manual classifications of weather types, based on subjective criteria drawing upon the researcher's experience, have been gradually replaced by objective or semi-objective automatic classifications, based on quantitative criteria and supported by the calculation capacity of computers. Although the experience of the researcher or the synoptic analyst is to be respected, subjective criteria prevents obtaining identical results in successive applications of the same subjective classification in a determined area and period, and therefore these results cannot be transferred or transported. On the contrary, automatic classifications can be used by any investigator by merely following the previously established objective criteria and the corresponding calculation algorithm, with identical final results. It is true, however, that the use of an automatic classification can be blind, only following the calculation algorithm, and there is therefore a need for expert (and subjective) analysis of the established criteria and the geographic and climatic coherence of the obtained results. To put it another way, the results provided by objective classification should be reviewed by an expert to check their suitability for the analyzed area, as well as their coherence and usefulness. One of the greatest efforts in the objectification of synoptic classifications was developed within the framework of the COST7333 Action (Harmonization and Applications of Weather Type Classifications for European Regions, www.cost733.org), which involved researchers from 23 countries in the quest for the most suitable automatic classifications for the European continent (Philipp et al., 2010; Huth, 2010).
Multivariate analysis, in particular principal component analysis associated with clustering processes, is now widely used to classify weather types. It enables us to determine the main synoptic and surface circulation patterns, as well as at different tropospheric levels, based on extensive sea surface pressure and geopotential at 500 hPa and other levels databases, very often reanalysis, which cannot be processed manually (Huth et al., 2008; Esteban et al., 2006). However, multivariate analysis is not a totally objective process, but rather semi-objective, given that thresholds need to be established and that there is a need to choose from different options at different stages of application, such as establishment of the level of variance explained by the components, the number of synoptic types, the use of T or S modes, rotating or not the components obtained (with the choice in this case of the rotation method), using a hierarchical classification or not, etc.
The most objective existing classification procedure is not part of the group of classifications based on multivariate analysis; rather, it involves the Jenkinson and Collison method (Jenkinson and Collison, 1977) (hereinafter JC). Used successfully in the British Isles, it was created precisely to fulfill the task of objectivizing the so-called Lamb's (subjective) classification, and provided results that were very similar to those of the latter classification (Jones et al., 1993). Lamb's daily types for the British Isles (since 1861) and the corresponding JC types (since 1880) can be found at http://www.cru.uea.ac.uk/cru/data/lwt/. Uses and applications of JC in European regions, especially the north of the continent, can be found in Buishand and Brandsma (1997), Trigo and DaCamara (2000), Linderson (2001), Post et al. (2002), Fowler and Kilsby (2002), Buchanan et al. (2002), Antonsson et al. (2008), Demuzere et al. (2008), Post and Kárner (2008), etc. In other regions of the planet, the JC method has as yet been little used, although one of the first pilot applications was in a scope outside of the mid-latitudes, specifically in Egypt (Dessouky and Jenkinson, 1977). In southern Europe and in particular in the Mediterranean basin, the JC classification has not been widely used, partly due to the fact that it only contemplates the surface level, while mechanisms in mid-troposphere (500 hPa) initially have a noteworthy effect upon weather conditions. In the case of the Iberian Peninsula, the first application of the JC method over the whole territory was performed by Spellman (2000) and subsequently debated by Martin-Vide (2001). Other research on the Iberian Peninsula and the surrounding area involves works by Martin-Vide (2002) on the synoptical classification of days of torrential rainfall in the Valencia region; Rasilla et al. (2002), on wind storms in northern Spain; Vicente-Serrano and López-Moreno (2006), on wintertime droughts in NE Spain; Azorín et al. (2009), who use JC to classify days with breezes on the Mediterranean coast of the Iberian Peninsula, and Ramos et al. (2010), on compatibility between low-frequency variability patterns and circulation types.
The western Mediterranean basin (Fig.1) constitutes a complex planetary region with regard to atmospheric mechanisms. Although weather types are usually associated with thermodynamic stability, with calm surface meteorological conditions, very intense storms and showers are occasionally recorded, which synoptic cause in some spaces can be very varied (Martin-Vide et al., 2008). In certain cases, it is said that their genesis is located in the medium and high layers of the troposphere, with mechanisms such as cut-off lows and troughs. Moreover, the Mediterranean basin is considered to be one of the critical regions in relation to the future effects of global warming. This justifies the need for a long-term study of synoptic types based on objective classification, which in this research is specifically seen in the JC method for the 1948-2009 period. As in the study area there are weather types of thermal nature, a notorious percentage of sea surface, summer lows associated with warming and winter highs produced by cooling decrease, it can therefore be easier to verify the coherence of the method. Following the basic statistical analysis (frequency) of the types found annually, we performed a temporal analysis of their frequency during the study period, comparing the 1948-1978 and 1979-2009 sub-periods, annually and seasonally. The contents are structured in the following manner: presentation of the JC method, the grid used and the database in section 2; results (annual frequencies, monthly and seasonal frequencies, tendencies, and comparison of sub-periods) in section 3; discussion of results in section 4; and conclusions in section 5.
2. The Jenkinson and Collison method: Application to the western Mediterranean basin data
The Jenkinson and Collison classification is based on eight variables deduced exclusively from surface atmospheric pressure. These variables are:
P: Average surface pressure (hPa).
W: Zonal component of geostrophic (surface) wind, calculated as the pressure gradient between 35° and 45° N.
S: Meridian component of geostrophic (surface) wind, calculated as the pressure gradient between 15° W and 5° E.
D: Wind direction (azimuth degree).
F: Wind speed (m/s).
ZW: Zonal vorticity component.
ZS: Meridian vorticity component.
Z: Total vorticity.
A grid (Fig. 2) was considered for the western Mediterranean basin. It defines nine points: the intersections of parallels 35°, 40° and 45° N with meridians 5° W, 10° E and 15° E. If the surface atmospheric pressure is established at the nine points, the values of the eight variables are found. Table I shows the expressions used to calculate them.
Based on the values of these eight variables, the following five universal laws of the JC method are applied:
1. The flow direction is indicated by D (a wind rose of eight directions is used, and the W and S signs are considered).
2. If |Z| < F, an advective or pure directional type exists, defined according to rule 1 (N, NE, E, SE, S, SW, W and NW).
3. If |Z| > 2F, a cyclonic type exists (C), if Z > 0, or anti-cyclonic (A), if Z < 0.
4. If F < |Z| < 2F, an hybrid type exists, according to the Z sign (rule 3) and the flow direction (rule 1) (CN, CNE, CE, CSE, CS, CSW, CW, CNW, AN, ANE, AE, ASE, AS, ASW, AW and ANW).
5. If F < 6 and |Z| < 6, an undetermined type exists (U).
(Hereinafter, type C, or cyclonic, will be called depression, and type A, or anti-cyclonic, anticyclone.)
The database contains the sea level pressure for 12 h UTC of each day in the period 1948-2009 of the NCEP/NCAR reanalysis. In total, the database analyzed involved 203 814 values for surface pressure (22 646 days per nine daily data).
3. Results
3.1. Annual frequency of the types
Once the 22 646 days of the study period had been classified according to the types of the JC classification, the values of the basic statistical parameters were recorded in Table II. The most frequent type is U (undetermined), with an annual average of around one hundred days (99.4, which represents 27.2% of the whole period). It is followed by type A (anticyclone), with 75.5 days per year (20.7%), and C (depression), with 67.8 days per year (18.6%). Together, types U, A and C group two thirds (66.5%) of the total. None of the remaining types exceeds 13 days a year, i.e. they do not reach 3.5%; therefore, they fall far from the three above mentioned ones. The types that follow the three most common ones have frequency percentages of between 2.5 and 3.5%, and all of them are purely advective: W (3.4%), NW (3.3%), NE (3.1%) and N (2.5%).
The three most frequent types present the following annual maxima: U, 122 days in 1994; A, 127 days in 1948; and C, 104 days in 2009. The remaining ones have never exceeded 25 days in one year. At the other extreme, more than half of the types (16, which include E, SE, S, CE, CSE, CS, CSW, CW, AN, ANE, AE, ASE, AS, ASW, AW and ANW) did not appear in any year. Furthermore, it is interesting to note that the types with a higher coefficient of variation (over 80%) present a southerly component.
On grouping the purely advective types (N, NE, E, SE, S, SW, W and NW, hereinafter ADV), the cyclonic advective types (CN, CNE, CE, CSE, CS, CSW, CW and CNW, hereinafter ADVC) and the anti-cyclonic advective types (AN, ANE, AE, ASE, AS, ASW, AW and ANW, hereinafter ADVA) the mean number of days per year is 64.5, 31.5 and 26.5, respectively, whose percentages are 17.7, 8.6 and 7.3% (Table III).
Adding the number of type C days and the number of days with cyclonic advective type (ADVC) 6155 days with cyclonic character or curvature, or positive vorticity (hereinafter CYC) are obtained, which represent 27.2% of the total. These values are very similar to those corresponding to the sum of type A and anti-cyclonic advective (ADVA) days: 6327 days with anti-cyclonic character or curvature, or negative vorticity (hereinafter ANT), which represent 28.0% of the total.
We also calculated the absolute and percentage frequencies of the groupings of types with northerly direction: N, CN and AN (hereinafter [N]); easterly direction: E, CE and AE (hereinafter [E]); southerly direction: S, CS and AS (hereinafter [S]); and westerly direction: W, CW and AW (hereinafter [W]). We calculated the same facts for the groupings of types with a northerly component: N, CN, AN, NE, CNE, ANE, NW, CNW and ANW, hereinafter <N>; with an easterly component (E, CE, AE, NE, CNE, ANE, SE, CSE, ASE, hereinafter <E>); with a southerly component (S, CS, AS, SE, CSE, ASE, SW, CSW, ASW, hereinafter <S>); and with a westerly component (W, CW, AW, NW, ANW, CNW, SW, CSW, ASW, hereinafter <W>). The results are shown in Table IV.
3.2. Monthly and seasonal frequencies of the types
Monthly frequencies of types U, A, C, and of groupings ADV, ADVC and ADVA are shown in Fig. 3.
The monthly regime of ADV presents a minimum in July-August and a maximum in December, with a clearly concave regular curve. The ADVC regime exhibits a minimum in July and a maximum in December-January. The ADVA regime shows a minimum in August and equinoctial maxima in March and October. Type C presents a maximum in December and a minimum in June, with a slight secondary maximum in July-August. Type A presents a regime relatively opposed to that of type C, with a maximum in May-June and a minimum in December, although with a secondary
Groupings [S], with only 1.3%, and <S>, with 6.3%, are the least frequent in each class. Groupings [W], with 5.3%, and <N>, with 17.2%, are the most frequent.
minimum in July-August. Lastly, the undetermined type presents the most contrasted regime, with a clear maximum in July-August, whose absolute monthly values practically multiply by five those of December-January-February, when the minimum occurs. The bell shape of type U stands out over the others. There is a marked predominance of type U in July and August, with half its days falling under this type.
The annual regimes of groupings CYC and ANT, similar to those described for types C and A, are shown in Fig. 4. The most relevant events are the winter maximum and the summer minimum in the types presenting a cyclonic character, as well as the equinoctial maxima and winter minimum, with a secondary minimum in July and August, in the types of anti-cyclonic character.
3.3. Annual temporal analysis of types
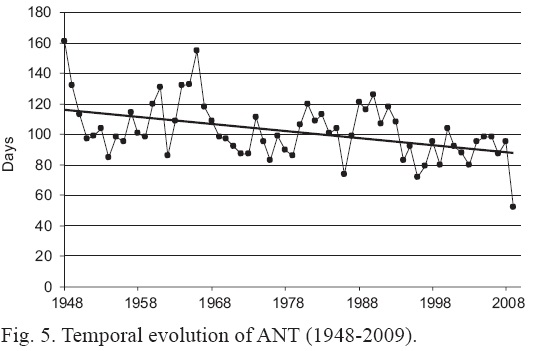
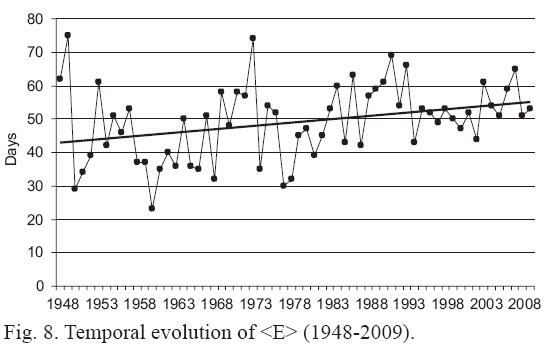
We analyzed the tendencies of the different JC types and of the most significant groupings. To establish significant trends we used the Student's t-parametric test (the normality of the series was previously verified). The tendencies supported by the test were admitted as significant, with a = 0.05. In a case in which the normality of the series cannot be admitted, we used, by way of a complement, the Mann Kendall non-parametric test. Table V shows the types or groupings with significant tendencies. Of all the types and groupings, significant tendencies can only be accepted in ten: A, ANT, CYC, ADVC, U, CNE, CSW, ASE, ASW and <E>. Given the low number of days per year of types CNE, CSW, ASE and ASW, their tendencies were considered to be irrelevant, regardless of the statistical verification. Thus, the truly important ones in the study area are the negative tendencies of types A and ANT (Fig. 5), as well as the positive tendencies of the opposite type, CYC (Fig. 6), and of the ADVC type, U (Fig. 7) and <E> (Fig. 8). As a whole, the anti-cyclonic types show a decrease and the cyclonic ones an increase, in the generic sense. Types A and ANT reductions are notable, with a decrease of 29.0 and 24.2% per decade, respectively, over a period of 62 years, which fully compensate the increases in CYC and ADVC, of 18.1 and 21.5% per decade. Given its quantitative significance, the type-U positive tendency (14.5%/decade) is also notable. Finally, there has been a noteworthy increase in <E> (28.4%/decade).

3.4. Differences in frequency of types between sub-periods 1948-1978 and 1979-2009
We divided the 62-yr analysis period (1948-2009) into two 31-yr sub-periods: 1948-1978 and 1979-2009, and compared the values of the different types and groupings of the two sub-periods by means of the Z-test for comparison of proportions. Table VI shows significant annual differences.
We confirmed the decrease in type A as the most significant, with practically 300 days less in the second sub-period than in the first one. We also detected an increase in E situations, both in direction and in component. This increase is not compensated by the decrease in W situations. The increase in type U is significant at 95%, but not at 99%.
We also compared the proportions of the different types and groupings of the two sub-periods according to seasons. Table VII shows the significant differences.
The results indicate that type-A decrease was concentrated in summer and autumn, and was not compensated by a certain increase (at the 99% significance threshold) in winter. There was an evident increase in the undetermined type in spring. Lastly, the increases in groupings [E] and <E> and the corresponding decreases in <W> were concentrated in the extreme seasons, i.e. winter and summer.
4. Discussion
The determination of the synoptic type, according to JC, of the 22 646 days in the 1948-2009 period constitutes in itself an interesting database for future research on the western Mediterranean basin. Researchers requiring an objective classification of synoptic situations at a daily resolution for the aforementioned area and its surroundings over a prolonged and recent period will find the results provided herein considerably useful. They will also enable objective comparison of synoptic types, according to dates, and of their evolution over a long period, for the western Mediterranean basin, with those obtained for other European scopes, such as the British Isles (Jones et al., 1993).
With regard to the frequencies of the 27 JC synoptic types, it is curious to note a high percentage (27.2%) of type U (undetermined). For a grid centered over the Iberian Peninsula, limited by the same parallels, but 10° further west, Spellman (2000) also obtained a high percentage of type U days, albeit lower (18.4%). Indeed, any classification that finds such notable percentages for undetermined cases or days can be suspected of employing criteria that do not discriminate sufficiently all the study cases, do not cover a sufficiently broad scope, or are not applicable to the region analyzed. In this respect, however, it should be noted that JC type U is attributable in a high percentage of the days to surface baric fields with very weak gradients, and lax or almost non-existent isobars, in the window of analysis. This situation is very frequent in summer in the Mediterranean basin, and is graphically termed "pantano barométrico" ("barometric swamp") in Spanish (Capel Molina, 2000; Martin Vide and Olcina, 2001), or "marais barométrique" in French (Pédélaborde, 1970). The sea surface mean pressure maps present, during all the months of the year, a weak gradient in southern Europe in comparison with the north of the continent (Baum and Smith, 1952; Trenberth and Paolino, 1980, 1981; Kalnay et al., 1996; Ansell et al., 2006; ERA-40 Atlas), but in July and August the gradient is particularly weak in the Mediterranean basin, exhibiting pressure values close to normal on many days, a reflection of the poor meridian thermal contrast and the homogeneity of the sea surface. In summer the western Mediterranean basin becomes isolated from the travelling lows and their frontal systems (Jiménez et al., 2007).
The second most frequent type found is A (20.7%) and the third one C (18.6%), whereas the rest (33.6%) correspond to pure and hybrid advective situations (ADV + ADVA + ADVC). The percentage corresponding to type C, relatively high in the latitudinal zone in which the western Mediterranean basin is situated, reflects the cyclogenetic character of the area, in particular the gulfs of Lion and Genoa, resulting from cyclogenesis processes leeward of the Alps (Jansà, 1997), among others. For the Iberian Peninsula, Spellman (2000) obtained a higher frequency of type C, in accordance with the presence of thermal lows or thermal talwegs from the Sahara in summer, resulting from surface warming of the inland Iberian Peninsula and of the Sahara. There is a highly characteristic association between a thermal low inland of the Iberian Peninsula and in North Africa during the summer. These areas are considered by some authors as cyclogenetic in this season (Lionello et al., 2006), and a "barometric swamp" over the somewhat cooler Mediterranean waters (Capel Molina, 2000; Martin-Vide, 2001).
Although type W is the fourth most frequent in the western Mediterranean, its frequency is low (3.4%), contrasting very much with its presence in the British Isles (Lamb, 1972; Dore et al., 2006). This result is consistent with the marginality of the Mediterranean basin in relation to the westerlies.
The low frequency of the grouping of southerly direction [S] and of the southerly component <S>, among the possible directions, is logical on considering that the basin is dominated throughout much of the year by masses of tropical (mT and cT) or Mediterranean air, and well-established southerly component flows are infrequent. The baric gradient between the Mediterranean basin and North Africa is, on average, weak.
The CYC and ANT groupings present similar frequencies, which are seen in a very similar percentage of surface pressure fields with positive and negative vorticity. This agrees with the results obtained by Laita and Grimalt (1997). The annual regimes of types U, A and C, and of the ADV grouping are consistent with the regional circulation in the Mediterranean basin. On one hand, the advective and A and C types, which usually imply well-defined surface pressure fields, present regimes opposite to that of type U, associated with very weak baric gradients. In winter, the synoptic patterns are better defined, due to the hemispheric meridian baric contrasts, whereas in summer the Mediterranean basin is not affected by the dominant circulation from the west and by other baric advections and synoptic configurations. In July and August, half the days are classified as type U, which tallies with meteorological conditions in the Mediterranean basin that present persistently calm weather, with abundant sunshine and the predominance of local winds (sea breezes). This is what makes this area one of the most attractive in the context of international tourism. The atmosphere ensures pleasant weather for tourism during many consecutive days, which is in accordance with the persistence of type U in the summer months. On the other hand, there is a problem related to accumulation of ozone and aerosols due to the low degree of atmospheric dynamism (Millán, 1997; Jiménez et al., 2007). Furthermore, there is a noteworthy graphic regularity in the convexity of the U regime and in the concavity of the ADV grouping throughout the year (Fig. 3), resulting from the Mediterranean annual pattern.
The practically opposite regimes of ANT and CYC, and of A and C, are consistent with the vorticities of an opposite sign that they entail.
In relation to the annual trends observed in the types and groupings, different studies have established an increase in surface atmospheric pressure in the Mediterranean basin. Thus, at global scale, Gillett and Stott (2009) found an increase in atmospheric pressure in southern Europe and North Africa for the period 1850-2004. At regional scale, Colacino and Conte (1993), studying the period 1865-1990, found a general increase in sea level pressure (SLP) in the central basin visible as from the 1940s, as did Maugeri et al. (2004) in winter since the 1970s in northern Italy. In our case, the P variable of JC (i.e., SLP) also shows a positive trend throughout the 62 years of the study (+0.31 hPa/decade), although type A exhibits a clearly negative trend (Fig. 5), which was confirmed on comparing the two 31-year periods annually, and in summer and autumn. This result, indicating an increase in atmospheric pressure and a simultaneous decrease in type A (anticyclone) only appears to be contradictory, and it should be pointed out that anticyclones/depressions are also defined in the JC method by the rotary direction of the winds and the increase/decrease in pressure to their centers, and not by the value of the SLP. Nonetheless, Wanner et al. (1997), using a regional scale in the North Atlantic, showed that there has been a zonal increase in circulation in Europe during the winter season since 1965, which caused intense north-south pressure gradients and an increase in the frequency of A weather types over south-western Europe. However, this scale of analysis is much greater than the one employed herein.
Furthermore, some authors have shown a decrease in depressions or in cyclonic types in Mediterranean areas, e.g. Trigo et al. (2008) for a shorter period (1960-2000) and the western Mediterranean in the broad sense. Trigo and DaCamara (2000) showed a decrease in the frequency of cyclonic weather types in Portugal, and Piervitali et al. (1997) and Brunetti et al. (2000) did the same for Italy. Corte-Real et al. (1998) indicated that the general decrease in precipitation identified in the Iberian Peninsula from 1960 to 1995 (Hisdal et al., 2001) coincides with the decrease in the frequency of weather types shown to generate precipitation (cyclonic, westerly and south-westerly) and also with an increase in anti-cyclonic weather types. Vicente-Serrano and López-Moreno (2006) found trends of types A and C opposite to the ones found herein, but for a grid centered over the Iberian Peninsula and for the 1952-1999 period, and a previous reclassification of type U days. On the contrary, there is a certain concordance of results with regard to the increase in E and SE and the decrease in SW.
It should be pointed out that in all the studies cited, the cyclonic types are either not defined according to JC or do not analyze the same study area or time period. In our case, the JC type C showed no significant tendencies throughout the study period, or between the two 31-year periods compared. On the other hand, a significant positive trend was found in the CYC grouping, which encompasses type C and the cyclonic hybrid advectives.
In other studies, the trends are not so clear, as a decrease in cyclonic types in some seasons of the year can be appreciated along with an increase in others. Thus, the results of Bartholy et al. (2008) "suggest that cyclone frequency in the western Mediterranean region showed an increase in summer and autumn, and a decrease in winter and spring" for the 1957-2002 period. The fourth IPCC cautiously states that there was likely an increase and a poleward shift in NH winter storm-track activity during the second half of the 20th century, but there are still significant uncertainties in the magnitude of the increase, due to time-dependent biases in the reanalysis (IPCC, 2007).
Moreover, different analysis of the whole of the Mediterranean basin associated the fluctuations and pressure trends with variability patterns such as the NAO and even the QBO (Ribera et al., 2000). On the other hand, Pirazzoli and Tomasin (2003) found a general decrease in wind activity from 1951 to around 1975, followed by a predominant increase up to the end of the 20th century in the central Mediterranean and Adriatic areas and little connection with the NAO. In conclusion, wind activity in the central Mediterranean area decreased from at least 1951 to the mid-1970s, showing an increase until the end of the 20th century. Such trends are similar to those observed in surface temperature changes, but do not correlate with variability in the NAO index (Pirazzoli and Tomasin, 2003).
As has been mentioned, on comparing the two 31-year sub-periods (1948-1978 and 1979-2009), no significant change is appreciated in type C or in CYC, but the decrease in type A, on the other hand, remains clear. Likewise, the increase in type U, concentrated in spring, is confirmed. These two results are consistent with the warming of the waters in the western Mediterranean basin since the 1970s (Vargas-Yáñez et al., 2008, 2010), given that warming of the substrate could weaken the anticyclones, or their ridges, over Mediterranean waters, turning them into type U in a large number of cases. The advance of summer appears to account for the fact that the increase in type U occurs mainly in spring. Likewise, and by way of an hypothesis, the increase in the CYC grouping throughout the period 1948-2009 could be due to the same cause.
In the context of climate change, global warming gives rise to a reduction of the equator-poles thermal gradient with which the movement towards the north of the subtropical anticyclones (including the Azores one) could be associated (Colacino and Conte, 1993), a result contrary to that of Wanner et al. (1997). These authors, using three long series, demonstrate an increasing pressure trend in the central-western basin of the Mediterranean, with which the reduction of intense cyclogenetic events and increased blocking situations are connected. The variations recorded to date, even if consistent with the forecasts of climatic scenarios, can still fall within the normal variability of the phenomena (Colacino and Conte, 1993). The displacement northwards of the westerly flows and the strengthening thereof by the positive phase of the NAO since the 1970s could account for the reduction of type W in the study area, whereas type A, which consequently must show an increase in south-western Europe, would not do so over waters of the western Mediterranean, because the column of air looses stability due to surface warming.
The increase in [E] and <E> on moving from the first to the second sub-period is consistent with the results of Makrogiannis and Sahsamanoglou (1990), who noted a tendency for the winds to become less zonal (i.e., more easterly) after 1976 over the western basin of the Mediterranean. This is also in agreement with the decrease in the western Mediterranean oscillation index (WeMOi) observed, which implies more frequent easterly flows (Martin-Vide and López-Bustins, 2006). The increase in [E] and <E> is also consistent with the westward extension of the area with autumn maximum precipitation regime, linked to Mediterranean flows, from the eastern fringe of the Iberian Peninsula in the last decades (de Luis et al., 2010).
In summary, the sea surface under warming and the cyclogenetic character of the gulfs of Lion and Genoa (Alpert et al., 1990; Jansà et al., 2001) could account for the temporal behavior of type A and of CYC, opposite to those found by other authors at larger scales or in other parts of the Mediterranean basin, for periods somewhat different to those analyzed herein.
5. Conclusions
We determined the synoptic type, according to the Jenkinson and Collison procedure, of the 22 646 days in the 1948-2009 period for the western Mediterranean basin, based upon a grid of nine points with extreme vertices at 45° N, 5° W and 35° N, 15° E. The most frequent type is U (undetermined), with an annual average of around 100 days (99.4, which is 27.2% of the days of the period). It is followed by type A (anti-cyclone), with 75.5 days per year (20.7%), and C (depression), with 67.8 days per year (18.6%). As a whole, types U, A and C comprise two thirds of the total (66.5%). The high frequency of type U is due to the presence of baric fields with a low gradient ("barometric swamp") over Mediterranean waters in the warm half of the year. The high frequency of type C is necessarily influenced by the markedly cyclogenetic character of the gulfs of Lion and Genoa.
After grouping types, the number of days presenting types with cyclonic curvature or positive vorticity (type C plus cyclonic hybrid advectives) represents 27.2% of the period, a value similar to the sum of type A and the anticyclonic hybrid advectives (28.0%), which are the days with anti-cyclonic curvature or negative vorticity. According to directions, the types from the west (W + CW + AW) are the most frequent and those from the south (S + CS + AS), the least.
The monthly regime of the most frequent types and groupings is quite regular, given the large sample analyzed. Type C, the advective groupings and the CYC present summer minima and maxima in the cold half of the year, when the atmosphere has greater dynamism and meridian contrast, whereas the opposite occurs with type U and, to a lesser extent, with type A. Type U occurs in half the days of July and August.
The main statistically significant annual trends for the 1948-2009 period, in the JC types and in the groupings, involve a decrease in type A (-4.19 days/decade, i.e. -29.0%) and an increase in U, CYC and <E>. On comparing the 31-year periods 1948-1978 and 1979-2009, we confirmed the trends of A, U and <E>, and one can generally appreciate increases in the easterly directions and components and a decrease in the westerly directions and components. Type A ranged from 2490 days in the first sub-period to 2192 in the second (p = 0.000), mainly concentrated in summer and autumn. This clear reduction of type A combines with an increase in the JC pressure variable (+0.31 hPa/decade) throughout the 62 years of the analysis. The trend found in type A differs from the results of other studies, in which the frequency of anti-cyclonic types was reinforced over the Mediterranean basin. The different analysis periods and scales or study areas, as well as the variety of methods employed to determine the synoptic types could explain why the results do not tally. In any case, the warming in the last few decades of the waters of the western Mediterranean, as well as the markedly cyclogenetic nature of the gulfs of Lion and Genoa, might account for the decrease in type A and the increase in the types presenting cyclonic curvature.
Acknowledgements
NCEP Reanalysis data was provided by the NOAA/OAR/ESRL PSD, Boulder, Colorado, USA, from their website at http://www.esrl.noaa.gov/psd/.
This research was conducted within the framework of the Spanish RECABA Projects CGL2008-06129-C02-01, CGL2008-06129-C02-02, the Grupo de Climatología, Universitat de Barcelona (2009 SGR 443, Generalitat de Catalonia), the COST-733 Action, the Institut de l'Aigua (University of Barcelona) and the Spanish Committee of the WCRP, to which the fourth co-author belongs.
References
Alpert P., B. U. Neeman and Y. Shay-El, 1990. Climatological analysis of Mediterranean cyclones using ECMWF data. Tellus A 42, 65-77, doi:10.1034/j.1600-0870.1990.00007.x. [ Links ]
Ansell T. J., P. D. Jones, R. J. Allan, D. Lister, D. E. Parker, M. Brunet, A. Moberg, J. Jacobeit, P. Brohan, N. A. Rayner, E. Aguilar, H. Alexandersson, M. Barriendos, T. Brandsma, N. J. Cox, P. M. Della-Marta, J. A. Drebs, K. D. Founda, J. F. Gerstengarbe, K. Hickey, N. T. Jonsson, J. Luterbacher, O. Nordli, H. Oesterle, M. Petrakis, L. A. Philipp, M. J. Rodwell, O. Saladié, J. Sigró, V. Slonowky, L. Srnec, V. Swail, A. M. García-Suárez, H. Tuomenvirta, X. Wang, H. Wanner, P. Werner, D. Wheeler and E. Xoplaki, 2006. Daily mean sea level pressure reconstructions for the European-North Atlantic Region for the period 1850-2003. J. Climate 19, 2717-2742, doi:10.1175/JCLI3775.1. [ Links ]
Antonsson K., D. Chen and H. Seppá, 2008. Anti-cyclonic atmospheric circulation as an analogue for the warm and dry mid-Holocene summer climate in central Scandinavia. Clim. Past 4, 215-224. [ Links ]
Azorin C., D. Chen and M. Baldi, 2009. A multi-year study of sea breeze in a Mediterranean coastal site: Alicante (Spain). Int. J. Climatol. 31, 468-486, doi:10.1002/joc.2064. [ Links ]
Bartholy J., R. Pongrácz and M. Pattantyús-Ábrahám, 2008. Analyzing the genesis, intensity, and tracks of western Mediterranean cyclones. Theor. Appl. Climatol. 96, 133-144, doi:10.1007/ s00704-008-0082-9. [ Links ]
Baum W. A. and L. B. Smith, 1952. Semi-monthly mean sea-level pressure maps for the Mediterranean area. Meteorol. Atmos. Phys. 5, 326-345 [ Links ]
Brunetti M., L. Buffoni, M. Mangeri and T. Nanni, 2000. Precipitation intensity trends in northern Italy. Int. J. Climatol. 20, 1017-1031, doi:10.1002/1097-0088(200007)20:9 & lt;1017::AID-JOC515 & gt;3.0.CO;2-S. [ Links ]
Buchanan C. M., I. J. Beverland and M. R. Heal, 2002. The influence of weather-type and long-range transport on air particle concentrations in Edinburgh, UK. Atmos. Environ. 36, 5343-5354, doi:10.1016/S1352-2310(02)00579-4. [ Links ]
Buishand A. and T. Brandsma, 1997. Comparison of circulation classification schemes for predicting temperature and precipitation in the Netherlands. Int. J. Climatol. 17, 875-889, doi:10.1002/ (SICI)1097-0088(19970630)17:8<875::AID-JOC164>3.0.CO;2-C. [ Links ]
Camuffo D. and P. Jones, 2002. Improved understanding of past climatic variability from early daily European instrumental sources. Climatic Change 53, 1-4, doi:10.1023/A:1014902904197. [ Links ]
Capel Molina J. J., 2000. El clima de la península Ibérica. Ariel: Barcelona, 281 pp. [ Links ]
Colacino M. and M. Conte, 1993. Greenhouse effect and pressure pattern in the Mediterranean basin. Il Nuovo Cimento 16, 67-77. [ Links ]
Corte-Real J., B. Qian and H. Xu, 1998. Regional climate change in Portugal: precipitation variability associated with large-scale atmospheric circulation. Int. J. Climatol. 18, 619-635, doi:10.1002/(SICI)1097-0088(199805)18:6<619:AID-JOC271>3.0.CO;2-T. [ Links ]
De Luis M., M. Brunetti, J. C. Gonzalez-Hidalgo, L. A. Longares and J. Martin-Vide, 2010. Changes in seasonal precipitation in the Iberian Peninsula during 1946-2005. Global Planet. Change 74, 27-33, doi:10.1016/j.gloplacha.2010.06.006. [ Links ]
Demuzere M., M. Werner, N. P. M. van Lipzig and E. Roeckner, 2008. An analysis of present and future ECHAM5 pressure fields using a classification of circulation patterns, Int. J. Climatol. 29, 1796-1810, doi:10.1002/joc.1812. [ Links ]
Dore A. J., M. Vieno, N. Fournier, K. J. Weston and M. A. Sutton, 2006. Development of a new wind-rose for the British Isles using radiosonde data, and application to an atmospheric transport model. Q. J. R. Meteorol. Soc. 132, 2769-2784, doi:10.1256/qj.05.198. [ Links ]
ERA-40 Atlas: http://www.ecmwf.int/research/era/ERA-40_Atlas/docs/index.html. [ Links ]
Esteban P., J. Martin-Vide and M. Mases, 2006. Daily atmospheric circulation catalogue for Western Europe using multivariate techniques. Int. J. Climatol. 26, 1501-1515, doi:10.1002/joc.1391. [ Links ]
Fowler H. J. and C. G. Kilsby, 2002. A weather-type approach to analyzing water resource drought in the Yorkshire region from 1881 to 1998. J. Hydrol. 262, 177-192, doi:10.1016/S0022-1694(02)00034-3. [ Links ]
Gillett N. P. and P. A. Stott, 2009. Attribution of anthropogenic influence on seasonal sea level pressure. Geophys. Res. Lett. 36, doi:10.1029/2009GL041269. [ Links ]
Hisdal H., K. Stahl, L. M. Tallaksen and S. Demuth, 2001. Have streamflow droughts in Europe become more severe or frequent? Int. J. Climatol. 21, 317-333. [ Links ]
Huth R., C. Beck, A. Philipp, M. Demuzere, Z. Ustrnul, M. Cahynová, J. Kysely and O. E. Tveito, 2008. Classification of atmospheric circulation patterns-recent advances and applications. Ann. N. Y. Acad. Sci. 1146, 105-152, doi:10/1196annals.1446.019. [ Links ]
Huth R., 2010. Synoptic-climatological applicability of circulation classifications from the COST733 collection: First results. Phys. Chem. Earth 35, 388-394, doi:10.1016/ j.pce.2009.11.013. [ Links ]
IPCC, 2007. Climate change: The physical science basis. Summary for policymakers. Contribution of Working Group I to the 4th Assessment Report of the Intergovernmental Panel on Climate Change (S. Solomon, D. Qin, M. Manning, Z. Chen, M. Marquis, K. B. Averyt, M. Tignor and H. L. Miller). Cambridge: Cambridge University Press. http://www.ipcc.chLinks ]ipcc.ch">.
Jansà A., 1997. A general view about Mediterranean meteorology: Cyclones and hazardous weather. Paper presented at the International Symposium on Cyclones and Hazardous Weather in the Mediterranean. INM/World Meteorological Organization. Palma de Mallorca, Spain, April 14-17. [ Links ]
Jansà A., A. Genovês, M. A. Picornell, J. Campins, R. Riosalido and O. Carretero, 2001. Western Mediterranean cyclones and heavy rain. Part 2: Statistical approach. Meteorol. Appl. 8, 43-56, doi:10.1017/S1350482701001049. [ Links ]
Jenkinson A. F. and F. P. Collison, 1977. An initial climatology of gales over the North Sea. Synoptic Climatology Branch Memorandum No. 62. Bracknell: Meteorological Office. [ Links ]
Jiménez P., O. Jorba, R. Parra, C. Pérez and J. M. Baldasano, 2007. Modeling photochemical pollution in the northeastern Iberian Peninsula. In: Air Pollution Modeling and its Application XVII (C. Borrego and A.L. Norman, eds.). 167-176, New York: Springer, 167-176, doi:10.1007/978-0-387-68854-119. [ Links ]
Jones P. D., M. Hulme and K. R. Briffa, 1993. A comparison of Lamb circulation types with an objective classification scheme. Int. J. Climatol. 13, 655-663, doi:10.1002/joc.3370130606. [ Links ]
Kalnay E., M. Kanimatsu, R. Kistler, W. Collins, D. Deaven, L. Gandin, M. Iredell, S. Saha, G. White, J. Woollen, Y. Zhu, A. Leetmaa, R. Reynolds, M. Chelliah, W. Ebisuzaki, W. Higgins, J. Janowiak, K. C. Mo, C. Ropelewski, J. Wang, R. Jenne and D. Joseph, 1996. The NCEP/ NCAR 40-year reanalysis project. Bull. Amer. Meteor. Soc. 77, 437-471; doi:10.1175/1520-0477(1996)077<0437:TNYRP>2.0.CO;2. [ Links ]
Laita M. and M. Grimalt, 1997. Vorticity and pressure anomalies in the Western Mediterranean during El Niño/Southern Oscillation extremes. Int. J. Climatol. 17, 475-482; doi:10.1002/ (SICI)1097-0088(199704)17:5<475::AID-JOC142>3.0.CO;2-F. [ Links ]
Lamb, H. H. 1972. British Isles weather types and a register of daily sequence of circulation patterns, 1861-1971. Geophysical Memoirs 116. Great Britain Meteorological Office. London: H. M. Stationary Office. [ Links ]
Linderson M., 2001. Objective classification of atmospheric circulation over southern Scandinavia. Int. J. Climatol. 21, 155-169; doi:10.1002/joc.604. [ Links ]
Lionello P., J. Bhend, A. Buzzi, P. M. Della-Marta, S. O. Krichak, A. Jansà, P- Maheras, A. Sanna, I. F. Trigo and R. Trigo, 2006. Cyclones in the Mediterranean Region: Climatology and effects on the environment. In: Developments in earth and environmental sciences. Vol. 4. Mediterranean (P. Lionello, P. Malanotte-Rizzoli and R. Bosolo, eds.). Elsevier, 325-372, doi:10.1016/S1571-9197(06)80009-1. [ Links ]
Makrogiannis T. J. and C. S. Sahsamanoglou, 1990. Time variation of the mean sea level pressure over the major Mediterranean area. Theor. Appl. Climatol. 41, 149-156, doi:10.1007/BF00866438. [ Links ]
Martin-Vide J., 2001. Limitations of an objective weather-typing system for the Iberian Peninsula. Weather 56, 248-250. [ Links ]
Martin Vide J. and J. Olcina, 2001. Climas y tiempos de España. Madrid: Alianza Editorial, 258 pp. [ Links ]
Martín-Vide J., 2002. Aplicación de la clasificación sinóptica automática de Jenkinson y Collison a días de precipitación torrencial en el este de España. In: La información climática como herramienta de gestión ambiental (J. M. Cuadrat, S. Vicente and M. A. Saz, eds.). Zaragoza: Universidad de Zaragoza, 123-127. [ Links ]
Martin-Vide J., and J. A. López-Bustins, 2006. The Western Mediterranean Oscillation and rainfall in the Iberian Peninsula. Int. J. Climatol. 26, 1455-1475, doi:10.1002/joc.1388. [ Links ]
Martin-Vide J., A. Sánchez-Lorenzo, J. A. Lopez-Bustins, M. J. Cordobilla, A. García-Manuel and J. M. Raso, 2008. Torrential rainfall in northeast of the Iberian Peninsula: Synoptic patterns and WeMO influence. Adv. Sci. Res. 2, 99-105. [ Links ]
Maugeri M., M. Brunetti, F. Monti and T. Nanni, 2004. Sea-level pressure variability in the Po plain (1765-2000) from homogenized daily secular records. Int. J. Climatol. 24, 437-455, doi:10.1002/joc.991. [ Links ]
Millán M. M., R. Salvador, E. Mantilla and G. Kallos, 1997. Photo-oxidant dynamics in the Western Mediterranean in summer: Results from European research projects. J. Geophys. Res. 102, 8811-8823. [ Links ]
Pédélaborde P., 1970. Introduction à l'étude scientifique du climat. Paris: SEDES, 246 pp. [ Links ]
Philipp A., J. Bartholy, C. Beck, M. Erpicum, P. Esteban, X. Fettweis, R. Huth, P. James, S. Jourdain, F. Kreienkamp, T. Krennert, S. Lykoudis, S. Michalides, K. Pianko-Kluczynska, P. Post, D. Rasilla Álvarez, R. Schiemann, A. Spekat and F. S. Tymvios, 2010. COST733CAT—a database of weather and circulation type classifications. Phys. Chem. Earth 35, 360-373, doi:10.1016/j. pce.2009.12.010. [ Links ]
Piervitali E., M. Colacino and M. Conte, 1997. Signals of climatic change in the central-western Mediterranean basin. Theor. Appl. Climatol. 58, 211-219, doi:10.1007/BF00865021. [ Links ]
Pirazzoli P. A. and A. Tomasin, 2003. Recent near-surface wind changes in the central Mediterranean and Adriatic areas. Int. J. Climatol. 23, 963-973, doi:10.1002/joc.925. [ Links ]
Post P., V. Truija and J. Tuulik, 2002. Circulation weather types and their influence on temperature and precipitation in Estonia. Boreal Env. Res. 7, 281-289. [ Links ]
Post P. and O. Kárner, 2008. Simple statistical structure in time series for daily air flow characteristics. Environmetrics 19, 49-59, doi:10.1002/env.855. [ Links ]
Ramos A. M., M. N. Lorenzo and L. Gimeno, 2010. Compatibility between modes of low-frequency variability and circulation types: A case study of the northwest Iberian Peninsula. J. Geophy. Res. 115, doi:10.1029/2009JD012194. [ Links ]
Rasilla D., J. C. García Codrón and C. Garmendia, 2002. Los temporales de viento: propuesta metodológica para el análisis de un fenómeno infravalorado. In: J. M. Cuadrat, S. M. Vicente and M. A. Saz, eds. La información climática como herramienta de gestión ambiental. Zaragoza: Universidad de Zaragoza, 129-136. [ Links ]
Ribera P., R. García, H. F. Díaz, L. Gimeno and E. Hernández, 2000. Trends and inter-annual oscillations in the main sea-level surface pressure patterns over the Mediterranean 1955-1990. Geophys. Res. Lett. 27, 1143-1146, doi:10.1029/1999GL010899. [ Links ]
Spellman G., 2000. The application of an objective weather-typing system to the Iberian Peninsula. Weather 55, 375-385. [ Links ]
Trenberth K. E. and D. A. Paolino, 1980. The Northern Hemisphere sea-level pressure data set: Trends, errors and discontinuities. Mon. Wea. Rev. 108, 855-872, doi: 10.1175/1520-0493(1980)108<0855:TNHSLP>2.0.CO;2. [ Links ]
Trenberth K. E. and D. A. Paolino, 1981. Characteristic patterns of variability of sea level pressure in the Northern Hemisphere. Mon. Wea. Rev. 109, 1169-1189, doi:10.1175/1520-0493(1981)109<1169:CPOVOS>2.0.CO;2. [ Links ]
Trigo R. M. and C. C. DaCamara, 2000. Circulation weather types and their influence on the precipitation regime in Portugal. Int. J. Climatol. 20, 1559-1581, doi:10.1002/1097-0088(20001115)20:13 & lt;1559::AID-JOC555 & gt;3.0.CO;2-5. [ Links ]
Trigo R. M., M. A. Valente, I. F. Trigo, P. M. Miranda, A. M. Ramos, D. Paredes and R. García-Herrera, 2008. The impact of North Atlantic wind and cyclone trends on European precipitation and significant wave height in the Atlantic. Ann. N. Y. Acad. Sci. 1146, 212-234, doi:10.1196/ annals.1446.014. [ Links ]
Vargas-Yáñez M., M. J. García, J. Salat, M. C. García-Martínez, J. Pascual and F. Moya, 2008. Warming trends and decadal variability in the Western Mediterranean continental shelf. Global Planet Change 63, 177-184, doi:10.1016/j.gloplacha.2007.09.001. [ Links ]
Vargas-Yáñez M., F. Moya, M. C. García-Martínez, E. Tel, P. Zunino, F. Plaza, J. Salat, J. Pascual, J. L. López-Jurado and M. Serra, 2010. Climate change in the Western Mediterranean Sea 19002008. J. Marine Syst. 82, 171-176, doi:10.1016/j.marsys.2010.04.013. [ Links ]
Vicente-Serrano S. M. and J. I. López-Moreno, 2006. The influence of atmospheric circulation at different spatial scales on winter drought variability through a semi-arid climatic gradient in northeast Spain. Int. J. Climatol. 26, 1427-1453, doi:10.1002/joc.1387. [ Links ]
Wanner H., R. Rickli, E. Salvisberg, C. Schmutz and M. Schüepp, 1997. Global change and variability and its influence on Alpine climate-concepts and observations. Theor. Appl. Climatol. 58, 221-243, doi:10.1007/BF0086502. [ Links ]

