


Services on Demand
Journal
Article
 English (pdf)
 Article in xml format
 Article references
 Send this article by e-mail
Indicators
-
 Cited by SciELO
 -
 Access statistics
Related links
-
 Similars in
SciELO
Similars in
SciELO
Share

 Permalink
Atmósfera
Print version ISSN 0187-6236
Atmósfera vol.25 n.4 Ciudad de México Oct. 2012
Variations in aerosol optical and microphysical properties during an Indian festival observed with space-borne and ground-based observations
K. Vijayakumar and P. C. S. Devara
Indian Institute of Tropical Meteorology, Dr. Homi Bhabha Road, Pashan, Pune 411 008, India. Corresponding author: P. C. S. Devara; e-mail: devara@tropmet.res.in
Received November 25, 2011; accepted May 24, 2012
RESUMEN
Este trabajo analiza los cambios en la respuesta de los parámetros meteorológicos, el aerosol, el ozono y las propiedades de vapor de agua del 23 de febrero al 4 de marzo de 2010, periodo correspondiente al festival Holi, con datos terrestres y satelitales obtenidos en una estación urbana tropical en Pune, India. Las mediciones continuas de ozono total se llevaron a cabo en superficie con el espectrómetro portátil basado en microprocesador Microtops II. Las variaciones en la profundidad óptica del aerosol (AOD) tuvieron valores más altos el 1 de marzo de 2010 en coincidencia con el clímax del festival. El exponente de Ångström (α) se calculó con el método de mínimos cuadrados en el intervalo espectral de 340-1020 nm, junto con el coeficiente a2 del polinomio de segundo orden ajustado a la gráfica de AOD vs. longitud de onda. Los resultados de las observaciones con Microtops II y el fotómetro solar CIMEL se ajustan de manera adecuada a las observaciones satelitales. El índice de aerosol (AI) obtenido con el instrumento para la vigilancia del ozono (OMI) y el AOD derivado del espectrómetro de imágenes de resolución moderada (MODIS) indican una correlación positiva. Ésta sugiere que las observaciones satelitales sobre la región confirman la presencia de aerosoles que absorben radiación solar, principalmente debido a incineración de biomasa y emisiones de polvo coloreado en aerosol durante el festival.
ABSTRACT
This study analyzes changes in the response of meteorological parameters, aerosol, ozone, and water vapor properties over a tropical urban station in Pune, India, using ground-based and satellite data sets from February 23 to March 4, 2010 covering the Holi festival period. Continuous ground-based measurements of Microprocessor-based Total Ozone Portable Spectrometer (Microtops II) were made. The variations in aerosol optical depth (AOD) showed higher values on March 1, 2010 which coincide with the peak festival time. Using the least squares method, Ångström exponent (α) is calculated in the spectral interval of 340-1020 nm, along with the coefficient a2 of the second-order polynomial fit to the plot of log AOD versus the log wavelength. The correlation between the coefficient a2 vs. AOD500 nm is discussed. Results from ground-based Microtops and CIMEL sun-sky radiometer observations are also found to match well with satellite retrievals. The aerosol index (AI) derived from the Ozone Monitoring Instrument (OMI) along with AOD derived from the Moderate-Resolution Imaging Spectrometer (MODIS) indicate positive correlation. This suggests that satellite observations over the region confirm the presence of absorbing aerosols mainly due to bio-mass burning and colored powder spray activities during the festival.
Keywords: Microtops II, Ångström exponent, sun-sky radiometer, aerosol optical depth, Holi, OMI, MODIS.
1. Introduction
Atmospheric aerosols from natural and anthropogenic sources have important effects on the global and regional climate system because they scatter and absorb solar and thermal radiation (direct effect), modify the cloud optical properties by acting as cloud condensation nuclei (CCN) (indirect effect), and change atmospheric radiative budget (Haywood and Boucher, 2000; Bellouin et al., 2005; Rosenfeld, 2006). These aerosol climatic effects are highly irregular because of the large variability of the aerosol physical and optical properties, which are attributed to a diversity of sources, and their dependence on the prevailing meteorological and atmospheric conditions (Satheesh and Krishna Moorthy, 2005). On a global scale, the natural sources of aerosols are more important than the anthropogenic ones, but regionally anthropogenic aerosols are more relevant (Kaufman and Fraser, 1983; Ramanathan et al., 2001).
Holi is one of the major Indian festivals. It usually takes place in February/March and is the most popular and eagerly awaited festival in India. The origin of the traditional lighting of Holi is attributed by some to the burning of demonesses like Holika. Holi is also called "the festival of colors", and people celebrate it by smearing each other with paint, and throwing around colored powder and dye in an atmosphere of great good humor. On the day of Holi, the firewood is arranged in a huge pile at a clearing in the locality, and in the evening, the fire is lit. Thus, high concentrations of anthropogenic aerosols and metals are injected into the atmosphere due to colored powder and fireworks especially in urban regions. Urban areas have always been known to be a major source of particulate pollution, which is expected to continue rising due to population growth and increasing industrialization and energy use, especially in developing countries.
The atmospheric aerosols, ozone and water vapor products have been routinely measured using ground-based, multi-filter (covering from UV to NIR wavelength region) solar radiometers at the Indian Institute of Tropical Meteorology (IITM), Pune (Lat. 18º 32' N, Long. 73º 51' E, altitude 559 m amsl), a tropical urban station in India. These products include column-integrated aerosol optical depth (AOD), size distribution (ASD), total column ozone (TCO) and precipitable water content (PWC). The aim of the present paper is to report some results on aerosol characteristics during the Holi festival, and their comparison with synchronous satellite measurements.
2. Experimental station and meteorology
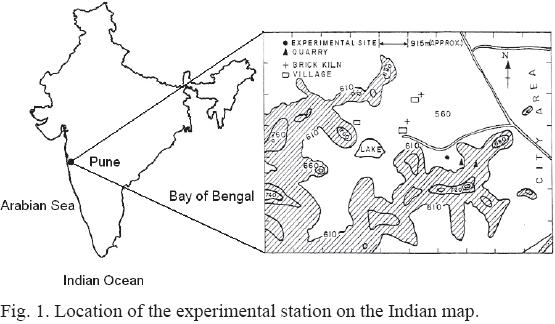
Figure 1 shows the location of the experimental station, along with surrounding activities, on the Indian map. The experimental station in Pune is situated on the lee-side of the Western Ghats and is about 100 km inland from the west coast of India. Observations were carried out on the terrace of a building at about 10 m above the surface at the ITTM, Pashan, which is located approximately 10 km from the center of Pune. The site is completely surrounded by hillocks of variable elevation (up to 200 m), forming a valley-like terrain. Brick kilns and stone quarries are located about 1 km to the west of the observational site.
The weather at the experimental site during the pre-monsoon season (March, April, May) is very hot (maximum around 40 ºC) with mostly gusty surface winds. The dust content in the atmosphere is at its peak, and cumulonimbus clouds develop around the late afternoon to evening hours. Development of a low pressure system due to increased heating over land starts over India in the pre-monsoon. The air flow in the lower troposphere is predominantly westerly during the south-west (SW) monsoon season (June, July, August, September), which brings a large influx of moist air from the Arabian Sea. The region receives light, continuous or intermittent rain, and the atmosphere is relatively free from dust during this season. The westerly flow sets in during the post-monsoon season (October, November). The continental air mass, rich in nuclei of continental origin, passes over the region during this season. Fair-weather conditions with clear skies, light surface winds and very low humidity prevail during the winter season (December, January and February). Low-level inversions during the morning and evening hours, and dust haze during the morning hours occur during this season.
3. Method of data analysis
3.1 Microtops-II
A Microtops-II sun photometer (Solar Light Co., USA) was used to measure the columnar aerosol optical depth (AOD) at the wavelengths of 340, 440, 500, 675, 870 and 1020 nm (Devara et al., 2001; Morys et al., 2001) as well as the TCO and water vapor for every 10-30 minutes interval from sunrise to sunset. The sun photometer works on the principle of measuring the solar radiation intensity at specified wavelengths and converts to optical depth by applying the corresponding intensities at the top of the atmosphere (TOA). The TOA irradiances at each wavelength were calculated via the well-known Langley method, while the Kasten and Young's (1989) expression for the air mass was used. Microtops-II also measures the TCO amount. This instrument further measures the direct beam component at three wavelengths: one strongly absorbed by ozone, a second one moderately absorbed, and a third one not absorbed. By comparing the calculated theoretical extinction of the direct-beam light with the measured values at multiple wavelengths of solar irradiance, the ozone amount is inferred.
Solar radiation traversing through the terrestrial atmosphere undergoes extinction due to three processes, namely Rayleigh scattering by air molecules, Mie scattering by aerosols, and molecular absorption. Solar radiation is a composite of monochromatic radiations, each of wavelength λ. The instantaneous solar radiation intensity I reaching the ground is related to TOA radiation intensity Io through the Bouguer-Lambert-Beer law:

where τ is the optical thickness, and m is the optical air mass, which is the mass of substances in a vertical cross section unit and is a function of solar zenith angle, χ (m = sec χ). More details about these radiometers and data retrieval method have been published elsewhere (Devara et al., 2001; Ichoku et al., 2002a; Kumar et al., 2011).
3.2 Ångström coefficients α and β
The spectral dependence of the AOD was used to compute the Ångström exponent α. A spectrally-averaged value of this exponent, which contains information about the size of the particles or the volume fraction of the fine versus coarse-mode particles (Schuster et al., 2006), can be obtained by fitting the Ångström's formula (Ångström, 1964) as:

where AODλ is the estimated AOD at the wavelength λ, β is the Ångström turbidity coefficient which equals AOD at λ = 1 mm, and α is the Ångström exponent. The Ångström formula is a special case of a more complicated equation valid for a limited range of particle diameters and a limited interval of wavelengths. The validity of this theory presupposes that the Junge power-law is valid for the particle-radius range, where significant extinction takes place and that the spectral variation of the refractive index does not impose significant variations on the Mie extinction factor (Kaskaoutis and Kambezidis, 2006). Taking the logarithm of both sides of Eq. (2) we obtain:

A more precise empirical relationship between aerosol extinction and wavelength is obtained with a second-order polynomial fit (King and Byrne, 1976; Eck et al., 1999, 2001a, b, 2005; O'Neill et al., 2001, 2003; Pedros et al., 2003; Kaskaoutis and Kambezidis, 2006):

where the coefficient a2 accounts for a curvature often observed in sun photometric measurements. This curvature can be an indicator of the aerosol-particle size; negative curvature indicates aerosol-size distribution dominated by fine-mode; and a positive curvature indicates size distribution with significant contribution by the coarse-mode aerosols (Schuster et al., 2006).
In the present study, the values of α were computed in the wavelength interval of 340-1020 nm, applying the least squares method to Eq. (3). The linear fit to the logarithmic function of Eq. (3) is the most precise method, although the results may also depend on the spectral interval considered (Pedros et al., 2003; Kaskaoutis and Kambezidis, 2008). The second-order polynomial fit (Eq. [4]) was also applied to the AOD values at six wavelengths (340, 440, 500, 675, 870 and 1020 nm), although three of them are sufficient for this computation as indicated by Eck et al. (2001a). Although the polynomial fit to Eq. (4) is more precise than the linear fit to Eq. (3), large errors can appear especially under low turbidity conditions. These errors were found to be lower when the spectral interval of 340-1020 nm is used instead of 340-870 nm. For this reason, the spectral range 340-1020 nm was used for the computation of α, a1 and a2.
3.3 Aerosol size distribution (ASD)
The various effects of aerosols are highly dependent on their size distribution. Aerosol size distribution can be inverted from the spectral variation of AOD by following the constrained linear inversion scheme (King et al., 1978; King, 1982) with the Fredholm integral as

where r is the particle radius, m is the complex refractive index of aerosol particles, Qext (r,λ,m) is the Mie extinction efficiency parameter and nc(r) is the columnar size distribution. Since nc(r) cannot be written analytically, a numerical approach is followed to separate nc(r) into two parts as nc(r) = h(r) × f(r), where h(r) is a rapidly varying function with r and f(r) is slowly varying. Hence the above equation changes to

In Eq. (6), the quadrature error will be less if f(r) is assumed to be constant. In that case, a system of linear equations results, which may be written as

where A = ∫ Π r2Qext (r,λ,m) h(r)dr and ε is an error which arises due to deviation between the measured τa and theoretical τa(=∑Aij.fi). Initially, the Junge exponent (ν) is computed from the wavelength dependence of AOD and used as a zero-order weighting function, h0(r). By using h0(r) as an initial guess, first order f(1) values are evaluated using the equation

where γ is non-negative Lagrangian multiplier and Sε is the measured covariance matrix, H is a mean diagonal matrix and superscript T denotes matrix transposition. This iteration procedure is repeated until the observed τa comes closer to the recomputed τa.
3.4 Satellite data
3.4.1 MODIS
MODIS is a key instrument aboard the Terra and Aqua satellites. It has been acquiring daily global data in 36 spectral bands from visible to thermal infrared (29 spectral bands with 1-km, five spectral bands with 500-m and two spectral bands with 250-m, nadir pixel dimensions) ranging from 0.4 to 14.4 μm. The MODIS sensor is onboard the polar orbiting NASA-EOS Terra and Aqua spacecrafts with equator crossing times of 10:30 and 13:30 local solar time (LST), respectively (Levy et al., 2007). Terra's orbit around the Earth is timed so that it passes from north to south across the equator in the morning, while Aqua passes from south to north over the equator in the afternoon. The MODIS images have been extensively used for monitoring various meteorological and atmospheric phenomena such as forest fires, dust outbreaks, severe storms, cyclones, volcanoes, etc. (Kaskaoutis et al., 2008). The Terra and Aqua satellites produce a suite of products designed to characterize global aerosol distribution, optical thickness and particle size. The aerosol properties are derived by the inversion of the MODIS observed reflectance using precomputed radiative transfer look-up tables based on aerosol models (Remer et al., 2005; Levy et al., 2007). The initial versions of the MODIS algorithms have been under continuous development, and have received lately an improved aerosol determination, via processing to Collection 5 (C005) (Levy et al., 2007). The data used in this study include both Terra and Aqua MODIS aerosol products, calculated using separate algorithms over land and ocean to obtain AOD at 550 nm (AOD550 nm) and the proportion of AOD550 nm contributed to the fine-mode aerosols. Such estimations are only made over cloud-free regions (Remer et al., 2005). MODIS measures AOD with an estimated error of ± 0.05 ± 0.20τ over the land (Chu et al., 2002) at 0.47 and 0.66 wavelengths and extrapolates it to a 550 nm wavelength (Ichoku et al., 2002b). MODIS-derived aerosol properties over land (Kaufman et al., 1997; Chu et al., 1998, 2002; Ichoku et al., 2002b) and over the ocean (Tanré et al., 1997; Remer et al., 2002) have been validated by more than 30 Aerosol Robotic Network (AERONET) stations worldwide. The detailed methodology of the retrieval of AOD has been discussed by Kaufman et al. (1997). The C005 level 3 (spatial resolution 1o × 1o) AOD, H2O products available from Giovanni-MODIS Online Visualization and Analysis System (MOVAS) site (http://gdata1.sci.gsfc.nasa.gov/daacbin/G3/gui.cgi?instance_id=MODIS_DAILY_L3) are used to analyze spatial variations in aerosol loading over the region from February 23 to March 4, 2010.
3.4.2 AURA-OMI aerosol index
Aerosol Index (AI) values are determined from the OMI flown on the Earth Observing System (EOS) Aura spacecraft, launched in July 2004. Aerosol information can be obtained over both land and water (Herman et al., 1997; Torres et al., 1998), and even over snow and ice (Hsu et al., 1999a). The AI is a measure of the wavelength-dependent reduction of Rayleigh scattered radiance by aerosol absorption relative to a pure Rayleigh atmosphere (Hsu et al., 1996; Herman et al.,1997; Torres et al., 1998; Bhawar and Devara, 2010). It is often proportional to the aerosol optical thickness (Hsu et al., 1999b; Chiapello et al., 2000). The AI is calculated using the ratio of the upwelling radiance between observations at 331 nm and 360 nm as:

Since I360 nm calculation uses reflectivity derived from the I331 nm measurements, the AI definition essentially simplifies to:

Positive values of aerosol index generally represent absorbing aerosols (dust and smoke) while small or negative values represent non-absorbing aerosols and clouds. Values of the AI near zero indicate cloud presence. In interpreting these results, especially over oceans, care has to be taken about some surface effects, such as sea glint and ocean color, which can enhance the AI.
3.5 Air mass back trajectory
To ascertain the sources of loading and their long-range transport, air mass back trajectories were studied. A useful tool for data interpretation is the Hybrid Single Particle Lagrangian Integrated Trajectories (HYSPLIT) model of the National Oceanic and Atmospheric Administration (NOAA). This program allows for the calculation of air mass back trajectories once the trajectory levels, the day and time are fixed (Esposito et al., 2004).
4. Results and discussion
4.1 Day-to-day variation of mean AOD
The AOD measurements were carried out using the Microtops-sun photometer. Figure 2 shows day-to-day variations in mean AOD observed from February 23 to March 4, 2010 at the wavelengths of 340, 500, 1020 nm, representing the fine, accumulation and coarse mode of aerosol particles, respectively. The vertical bars show standard deviation of AOD at each wavelength. Greater AOD values having large variability on all days have been observed at lower wavelengths, which decrease with increasing wavelength. The mean AOD showed smallest values on February 24, 2010 indicating that the atmosphere was relatively clean compared to other days of the measurement period. The higher AOD values compared to those on a normal day (February 24, 2010) during the measurement period indicate an additional loading of aerosols over the region. The peak AOD at all the three wavelengths was observed on March 1, 2010 indicating the abundance of fine-mode particles over the study region due to festival activities.
4.2 Day-to-day variation in ASD
The spectral distributions of AOD have been used to derive aerosol size distribution (ASD) by making use of the inversion technique suggested by King et al. (1978) and King (1982). Table I presents day-to-day variations in ASD thus obtained. The size distribution basically has an ultrafine mode (r < 0.1 μm), a fine/accumulation mode (0.1 < r < 1.0 μm) and a coarse mode (at >1.0 μm). The size distribution results are presented in terms of dNc/dlogr, which represent the number of particles per unit area per unit log radius interval in a vertical column through the atmosphere. Daily mean variation of ASD over the station exhibits power-law size distribution indicating greater concentrations of aerosol particles of smaller radius (around 0.11µm in the present study) and gradual decrease of concentration of larger particles of radius greater than 1.44 µm (in this study). The high aerosol loading is observed on March 1, 2010 suggesting an enhanced loading of accumulation mode particles, which could be associated with an enhanced local activity such as wind-blown dust.
4.3 Coefficient a2 versus AOD500 nm
The correlation between coefficient a2 and AOD500 nm on February 28 and 28 March 1, 2010 is shown in Figure 3. In order to examine the evolution of the particles during the festival, such correlations observed on clean pre-festival day (February 24, 2010) and on post-festival days (March 2 and 3, 2010) are also depicted in the same figure. The data lying on or near the a2 = 0 line corresponds to bimodal lognormal aerosol size distribution without curvature, negative a2 values correspond to fine mode aerosols and positive a2 values mainly indicate presence of coarse mode aerosol particles (Schuster et al., 2006; Kaskaoutis et al., 2007). It can be clearly seen from the figure that a2 has a majority of positive values suggesting presence of relatively coarse-mode particles over the region on February 24, 28 and March 3, 2010. However, on March 1 and 2, 2010 the majority of a2 values were negative, suggesting the abundance of fine-mode aerosols over the study region.
4.4 Comparison between ground-based and satellite observations
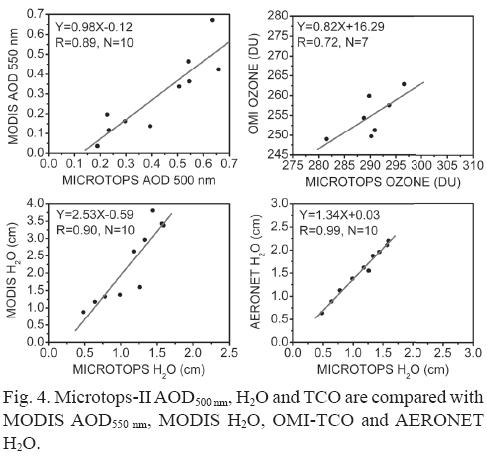
The ground-based observations of AOD500 nm, H2O and TCO are compared with satellite observations of MODIS AOD550 nm, MODIS H2O and OMI-TCO in Figure 4. The corresponding correlation coefficients are 0.89, 0.90 and 0.72, respectively. Microtops H2O is also compared with AERONET H2O, and it showed very good correlation (R=0.99). The differences in the above comparisons could be due to lack of exact time synchronization, sensing area coverage, filter characteristics, etc.
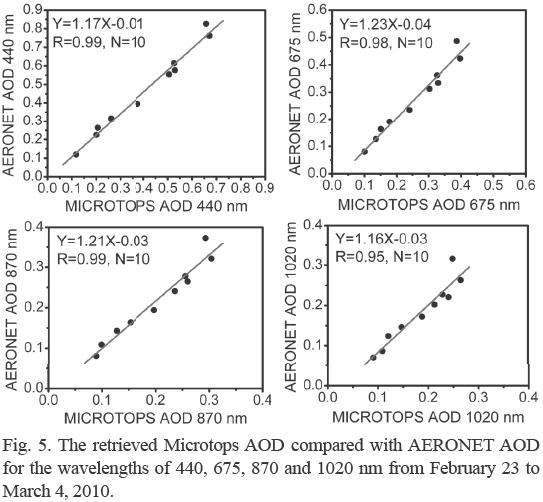
A CIMEL sun-sky radiometer (AERONET) has been in regular operation at the experimental site (Sumit et al., 2011). The AOD observations from MICROTOPS are compared with those from the AERONET observations in Figure 5 at the same wavelength from February 23 to March 4, 2010. They show a very good correlation, thus providing confidence in the operation and quality of the measurements. This comparison also provides better understanding of the application of long-term measurements to trend studies and the ability to develop a single global climatology from multiple networks.
4.5 MODIS AOD550 nm versus AURA-OMI AI
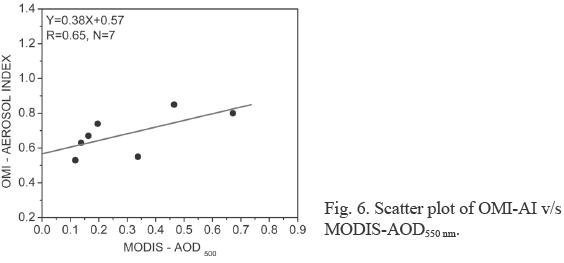
The data sets of AURA-OMI AI covering the study area along with MODIS AOD data at 550 nm on a daily basis were analyzed to study the variation in atmospheric aerosol loading. Figure 6 shows the scatter plot of MODIS AOD at 550 nm and OMI-AI. Here only the positive values of OMI-AI, corresponding to fires were considered. AI is a very useful qualitative indicator of the presence of absorbing aerosols (Duncan et al., 2003). The figure shows a good correlation (R = 0.65) suggesting that multi-satellite observations over the region confirm the presence of absorbing aerosols due to fires.
4.6 Relationship with meteorological parameters, and long-range transport
Aerosol load and type at any location are generally influenced by the background atmospheric conditions, and hence affect the air mass transport over the region. The day time average variations of meteorological parameters such as wind speed, air temperature and humidity from February 24 to March 4, 2010 are shown in Figures 7 and 8.
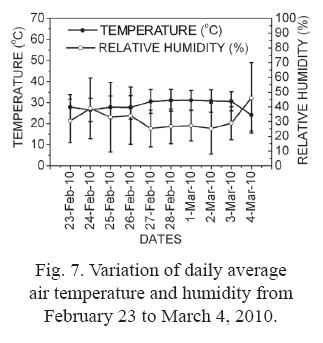
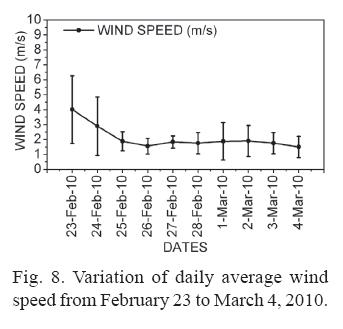
The day-time average air temperatures during the Holi festival period over the Pune region were in the range of 24-31 ºC. The mean relative humidity (RH) varied from a low of 25% to a high of about 46%. The average wind speed showed a variation factor of 2.0, ranging from about 1.5 ms–1 to a maximum of about 4 ms-1.
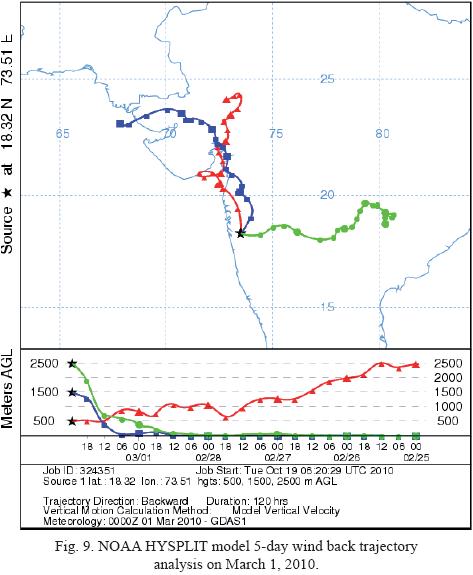
To identify the sources and examine how transport paths affect the concentrations of air pollutants over Pune, India, 5-day back trajectories at 500, 1500 and 2500 m altitudes from the HYSPLIT model were performed (Fig. 9). This analysis provides latitude-longitude distributions of kinematic wind field including horizontal and vertical wind velocities. These trajectories basically reveal the transport of air mass and hence the source and sink characteristics of aerosols in the experimental and adjoining regions. It is clear from the figure that at low and middle altitudes, the air mass comes from the continental region, especially from the Indian states of Maharashtra and Gujarat. But at higher altitudes, the air mass flows from the state of Andhra Pradesh. In contrast, the observations influenced mostly by air mass from Gujarat (on the northwest coast of India and to the east of the study site) from February 23 to March 4, 2010 significantly influenced the observed AOD on these days. The lowest and highest AOD were observed on February 24 and March 1, 2010 (Fig. 2).
5. Conclusions
The ground-based observations of Microtops II sun photometer and ozone monitor were analyzed at an urban station of Pune, India, during the Holi festival period and compared with AERONET and satellite retrievals. The results of the analysis suggest that:
• The observed AOD values were high during the Holi festival period.
• The scatter plot between coefficient a2 and AOD500 nm on February 24, 28 and March 1, 2 and 3, 2010 shows positive values of a2 on February 28 and March 1, 2010, suggesting the presence of relatively coarse mode particles over the region. However, on February 24 and March 1, 2 and 3, 2010 the majority of a2 values were negative, suggesting the abundance of fine mode aerosols over the study region.
• The ground-based sun photometer and ozone monitor observations showed good correlation with satellite retrievals.
• The ground-based observations of Microtops and AERONET observations revealed very good correlation, thus providing confidence in the operation and quality of the sun photometer measurements.
• Positive values of AI showed good correlation with AOD and correlation of the multiple datasets suggest the that urban area of Pune is influenced by fires in addition to anthropogenic vehicular pollution during the Holi festival period.
• Results of the study suggest possible utilization of multi-satellite data sets in understanding differential aerosol loading over large regions. The information on the extent and type of aerosol loading in the atmosphere provides useful input for estimating their radiative impacts.
Acknowledgements
The authors wish to thank the Director of IITM for encouragement and infrastructure support. The meteorological data support from the India Meteorological Department (IMD), Pune, is acknowledged with appreciation. The insightful comments and useful suggestions of anonymous reviewers are gratefully acknowledged. We also epress gratitude to C.P. Simha for his assistance in the Microtops observations. One of the authors (KV) acknowledges the financial support, in the form of Research Fellowship, from the ISRO-GBP-ARFI Project.
References
Ångström A., 1964. The parameters of atmospheric turbidity. Tellus 16, 64-75. [ Links ]
Bellouin N., O. Boucher, J. Haywood and M. S. Reddy, 2005. Global estimate of aerosol direct radiative forcing from satellite measurements. Nature 438, 1138-1141. [ Links ]
Bhawar R. L. and P. C. S. Devara, 2010. Study of successive contrasting monsoons (2001-2002) in terms of aerosol variability over a tropical station, Pune, India. Atmos. Chem. Phys. 10, 29-37. [ Links ]
Chiapello I., P. Goloub, D. Tanre, A. Marchand, J. Herman and O. Torres, 2000. Aerosol detection by TOMS and POLDER over oceanic regions. J. Geophys. Res. 105, 7133-7142. [ Links ]
Chu D. A., Y. J. Kaufman, L. A. Remer and B. N. Holben, 1998. Remote sensing of smoke from MODIS airborne simulator during the SCAR-B experiment. J. Geophys. Res. 103, 31979-31987. [ Links ]
Chu D. A., Y. J. Kaufman, C. Ichoku, L. A. Remer, D. Tanre and B. N. Holben, 2002. Validation of MODIS aerosol optical depth retrieval over land. Geophys. Res. Lett. 29. DOI: 10.1029/2001GL013205. [ Links ]
Devara P. C. S., R. S. Maheskumar, P. E. Raj, K. K. Dani and S. M. Sonbawne, 2001. Some features of column aerosol optical depth, ozone and precipitable water content observed over land during the INDOEX-IFP99. Meteorol. Zeitschrift 10, 123-130. [ Links ]
Duncan B. N., R. V. Martin, A. C. Staudt, R. Yevich and J. A. Logan, 2003. Interannual and seasonal variability of biomass burning emissions constrained by satellite observations. J. Geophys. Res. 108 (D2), 4100. DOI:10.1029/2002JD002378. [ Links ]
Eck T. F., B. N. Holben, J. S. Reid, O. Dubovik, A. Smirnov, T. N. O'Neill, I. Slutsker and S. Kinne, 1999. Wavelength dependence of the optical depth of biomass burning, urban, and desert dust aerosols. J. Geophys. Res. 104, 333-349. [ Links ]
Eck T. F., B. N. Holben, O. Dubovic, A. Smirnov, I. Slutsker, J. M. Lobert and V. Ramanathan, 2001a. Column-integrated aerosol optical properties over the Maldives during the northeast monsoon for 1998-2000. J. Geophys. Res. 106, 28, 555-556. DOI:10.1029/2001JD000786. [ Links ]
Eck T. F., B. N. Holben, D. E. Ward, O. Dubovic, J. S. Reid, A. Smirnov, M. M. Mukelabai, N. C. Hsu, N. T. O'Neil and I. Slutsker, 2001b. Characterization of the optical properties of biomass burning aerosols in Zambia during the 1997 ZIBBEE field campaign. J. Geophys. Res. 106, 3425-3448. [ Links ]
Eck T. F., B.N. Holben, O. Dubovik, A. Smirnov, P. Goloub, H.B. Chen, B. Chatenet, L. Gomes, X. Y Zhang, S. C. Tsay, Q. Ji, D. Giles and I. Slutsker, 2005. Columnar aerosol optical properties at AERONET sites in central eastern Asia and aerosol transport to the tropical mid-Pacific. J. Geophys. Res. 110, D06202. DOI:10.1029/2004JD005274. [ Links ]
Esposito F., L. Leone, G. Pavese, R. Restieri and C. Serio, 2004. Seasonal variation of aerosol properties in south Italy: A study on aerosol optical depths, Ångström turbidity parameters and aerosol size distributions. Atmos. Environ. 38, 1605-1614. [ Links ]
Haywood J. and O. Boucher, 2000. Estimates of the direct and indirect radiative forcing due to tropospheric aerosols: A review. Rev. Geophys. 38, 513-543. [ Links ]
Herman J. R., P. K. Bhartia, O. Torres, C. Hsu, C. Seftor and E. Celarier, 1997. Global distribution of UV-absorbing aerosols from Nimbus 7/TOMS data. J. Geophys. Res. 102, 911-922. [ Links ]
Hsu N. C., J. R. Herman, P. K. Bhartia, C. J. Seftor, O. Torres, A. M. Thompson, J. F. Gleason, T. F. Eck and B. N. Holben, 1996. Detection of biomass burning smoke from TOMS measurements. Geophys. Res. Lett. 23, 745-748. [ Links ]
Hsu N. C., J. R. Herman, J. F. Gleason, O. Torres and C. J. Seftor, 1999a. Satellite detection of smoke aerosols over a snow/ice surface by TOMS. Geophys. Res. Lett. 26, 1165-1168. [ Links ]
Hsu N. C., J. R. Herman, O. Torres, B. N. Holben, D. Tanre, T. F. Eck, A. Smirnov, B. Chatenet and F. Lavenu, 1999b. Comparisons of the TOMS aerosol index with Sun-photometer aerosol optical thickness: Results and applications. J. Geophys. Res. 104, 6269-6279. [ Links ]
Ichoku C., R. Levy, Y. J. Kaufmann, L. A. Remer, R. R. Li, V. J. Martins, B. N. Holben, N. Abhuhassan, I. Slutsker, T. F. Eck and C. Pietras, 2002a. Analysis of the performance characteristics of the five-channel Microtops II Sun photometer for measuring aerosol optical thickness and precipitable water vapour. J. Geophys. Res. 107(D13), 4179. DOI: 101029/2001JD001302. [ Links ]
Ichoku C., D. A. Chu, S. Mattoo, Y. J. Kaufman, L. A. Remer, D. Tanre, I. Slutsker and B. N. Holben, 2002b. A spatio-temporal approach for global validation and analysis of MODIS aerosol products. Geophys. Res. Lett. 29. DOI:10.1029/2001GL013206. [ Links ]
Kaskaoutis D. G. and H. D. Kambezidis, 2006. Investigation on the wavelength dependence of the aerosol optical depth in the Athens area. Q. J. R. Meteorol. Soc. 132, 2217-2234. [ Links ]
Kaskaoutis D. G., H. D. Kambezidis, N. Hatzianastassiou, P. G. Kosmopoulos and K. V. S. Badarinath, 2007. Aerosol climatology: dependence of the Ångström exponent on wavelength over four AERONET sites. Atmos. Chem. Phys. Discussion 7, 7347-7397. [ Links ]
Kaskaoutis D. G., H. D. Kambezidis, P. T. Nastos and P. G. Kosmopoulos, 2008. Study on an intense dust storm over Greece. Atmos. Environ. 42, 6884-6896. [ Links ]
Kaskaoutis D. G. and H. D. Kambezidis, 2008. Comparison of the Ångström parameters retrieval in different spectral ranges with the use of different techniques. Meteorol. Atmos. Phys. 99, 233-246. [ Links ]
Kasten F. and A. T. Young, 1989. Revised optical air mass tables and approximation formula. Appl. Opt. 28, 4735-4738. [ Links ]
Kaufman Y. J. and R. S. Fraser, 1983. Light extinction by aerosols during summer air pollution. J. Clim. Appl. Meteorol. 22, 1694-1725. [ Links ]
Kaufman Y. J., D. Tanre, L. A. Remer, E. F. Vermote, A. Chu and B. N. Holben, 1997. Operational remote sensing of tropospheric aerosol over land from EOS moderate resolution imaging spectroradiometer. J. Geophys. Res. 102, 17051-17068. [ Links ]
King M. D., 1982. Sensitivity of constrained linear inversion to the selection of the Lagrange multiplier. J. Atmos. Sci. 39, 1356-1369. [ Links ]
King M. D. and D. M. Byrne, 1976. A method for inferring total ozone content from spectral variation of total optical depth obtained with a solar radiometer. J. Atmos. Sci. 33, 2242-2251. [ Links ]
King M. D., D. M. Byrne, B. M. Herman and J. A. Reagan, 1978. Aerosol size distributions obtained by inversion of spectral optical depth measurements. J. Atmos. Sci. 35, 2153-2167. [ Links ]
Kumar S., P. C. S. Devara, M. G. Manoj and P. D. Safai, 2011. Winter aerosol and trace gas characteristics over a high-altitude station in the Western Ghats, India. Atmósfera, 24, 311-328. [ Links ]
Levy R. C., L. A. Remer, S. Mattoo, E. Vermote and Y. J. Kaufman, 2007. Second generation operational algorithm: Retrieval of aerosol properties over land from inversion of Moderate Resolution Imaging Spectroradiometer spectral reflectance. J. Geophys. Res. 112, D13211. DOI:10.1029/2006JD007811. [ Links ]
Morys M., F. M. Mims, S. Hagerup, S. E. Anderson, A. Baker, J. Kia and T. Walkup, 2001. Design, calibration, and performance of Microtops-II handled ozone monitor and sun photometer. J. Geophys. Res. 106, 14573-14582. [ Links ]
O'Neill N. T., O. Dubovic and T. F. Eck, 2001. Modified Ångström exponent for the characterization of submicrometer aerosols. Appl. Opt. 40, 2368-2375. [ Links ]
O'Neill N. T., T. F. Eck, A. Smirnov, B. N. Holben and S. Thulasiraman, 2003. Spectral discrimination of coarse and fine mode optical depth. J. Geophys. Res. 108(D17), 4559.DOI:10.1029/2002JD002975. [ Links ]
Pedros R., J. A. Martínez-Lozano, M. P. Utrillas, J. L. Gómez-Amo and F. Tena, 2003. Column-integrated aerosol, optical properties from ground-based spectroradiometer measurements at Barrax (Spain) during the Digital Airborne Imaging Spectrometer Experiment (DAISEX) campaigns. J. Geophys. Res. 108(D18), 4571, doi:10.1029/2002JD003331. [ Links ]
Ramanathan V., P. J. Crutzen and J. Lelievld, 2001. Indian Ocean Experiment: An integrated analysis of the climate forcing and effects of the great Indo-Asian Haze. J. Geophys. Res. 106, 28371-28398. [ Links ]
Remer L. A., D. Tanré, Y. J. Kaufman, C. Ichoku, S. Mattoo, R. Levy, D. A. Chu, B. N. Holben, O. Dubovik, A. Smirnov, J. V. Martins, R. R. Li and Z. Ahmad, 2002. Validation of MODIS aerosol retrieval over ocean. Geophys. Res. Lett. 29. DOI:10.1029/2001GL013204. [ Links ]
Remer L. A., Y. J. Kaufman, D. Tanre, S. Mattoo, D. A. Chu, J. V. Martins, R. R. Li, C. Ichoku, R. C. Levy, R. G. Kleidman, T. F. Eck, E. Vermote and B. N. Holben, 2005. The MODIS aerosol algorithm, products, and validation. J. Atmos. Sci. 62, 947-973. [ Links ]
Rosenfeld D., 2006. Aerosols, clouds and climate. Science 312, 1323-1324. [ Links ]
Satheesh S. K. and K. Krishna Moorthy, 2005. Radiative effects of natural aerosols: A review. Atmos. Environ. 39, 2089-2110. [ Links ]
Schuster G. L., O. Dubovik and B. N. Holben, 2006. Ångström exponent and bimodal aerosol size distributions. J. Geophys. Res. 111, D07207. DOI:101029/2005JD006328. [ Links ]
Sumit K., P. C. S. Devara, K. K. Dani, S. M. Sonbawne and S. K. Saha, 2011. Sun-sky radiometer-derived column-integrated aerosol optical and physical properties over a tropical urban station during 2004-2009. J. Geophys. Res. 116, D10201. DOI:10.1029/2010JD014944 [ Links ]
Tanré D., Y. J. Kaufman, M. Herman and S. Mattoo, 1997. Remote sensing of aerosol properties over oceans using the MODIS/EOS spectral radiances. J. Geophys. Res. 102, 971-988. [ Links ]
Torres O., P. K. Bhartia, J. R. Herman, Z. Ahmad and J. Gleason, 1998. Derivation of aerosol properties from satellite measurements of backscattered ultraviolet radiation: Theoretical basis. J. Geophys. Res. 103, 099-110. [ Links ]

