


Services on Demand
Journal
Article
 English (pdf)
 Article in xml format
 Article references
 Send this article by e-mail
Indicators
-
 Cited by SciELO
 -
 Access statistics
Related links
-
 Similars in
SciELO
Similars in
SciELO
Share

 Permalink
Atmósfera
Print version ISSN 0187-6236
Atmósfera vol.25 n.4 Ciudad de México Oct. 2012
Interannual deviations of long-term data from observations and contrasting with reanalysis data from the oceanic station at Islas Marías, Nayarit, Mexico
E. Palacios-Hernández
Departamento de Física, Universidad de Guadalajara, Blvd. Marcelino García Barragán 1421, 44430 Guadalajara, Jalisco, México
L. Brito-Castillo
Centro de Investigaciones Biológicas del Noroeste, Unidad Sonora, Guaymas, Campus Guaymas, km 2.35 Camino al Tular, Estero de Bacochibampo, 85454 Guaymas, Sonora, México Corresponding author; e-mail: lbrito04@cibnor.mx.
L. Carrillo
El Colegio de la Frontera Sur, Av. Centenario km 5.5, 77900 Chetumal, Quintana Roo, México
I. Tereshchenko
Departamento de Física, Universidad de Guadalajara, Blvd. Marcelino García Barragán 1421, 44430 Guadalajara, Jalisco, México
Received August 31, 2011; accepted June 25, 2012
RESUMEN
Se realiza un análisis climatológico de los datos meteorológicos históricos de Isla María Madre (de 1922 a 1989) para evidenciar las condiciones que tienen impacto en el territorio continental de México, y se comparan con datos de reanálisis regional (RR) en la misma zona. Los resultados indican que la temperatura del aire, presión atmosférica, humedad relativa y precipitación, en ambos tipos de datos, responden a la señal anual. Los datos de RR e in situ muestran diferencias en cuanto a comportamiento climático, principalmente en las fases de temperatura del aire y humedad relativa. Estas diferencias pueden deberse a la forma en que se obtienen y suavizan los datos de RR.
ABSTRACT
We prepared a synthesis of historical weather conditions for Isla María Madre (1922-1989) to reflect conditions that impact the mainland of México. Observations were compared with regional reanalysis (RR) data in the same area. The results indicate that air temperature, atmospheric pressure, relative humidity, and precipitation in both sources of data display the annual signal. Observations and RR data show differences in climate analysis, mainly in the phase of air temperature and relative humidity. These differences can be explained by the smoothness and the methods used to estimate the RR data.
Keywords: Climatology, Islas Marías, ENSO.
1. Introduction
Meteorological research in the Eastern Pacific Ocean has been carried out at synoptic and global scales. In Mexico, investigations of this kind are relatively new and difficult to perform, mainly because there is scarce long-term, meteorological data displaying oceanic influences. A few studies have been carried out in the Gulf of California (Leal-Lupercio, 1996), portions of the western coastal plain of Jalisco and Colima (Filonov and Tereshchenko, 2000), and in the Gulf of Tehuantepec (Martínez, 2005). One area that had yet to be studied is the region in the latitudes ofNayarit, which is important for its atmospheric and ocean dynamics, since its coast is strategic in several annual and interannual oceanographic and atmospheric signals that converge in this region. Data provide an opportunity to study phenomena that affect a large portion of Mexico and the North American coasts and understanding the oceanographic and atmospheric conditions that determine the climate in the coast of Nayarit. We analyzed long-term observations of meteorological variables at Isla María Madre, Nayarit, Mexico, the largest of the four small islands in the archipelago of Islas Marías (~21.5° N, ~106.5° W).
Islas Marías (Fig. 1) are of meteorological and oceanographic interest because they are relatively close to the coast of Nayarit to the east and at the edge of the continental shelf to the west. This latitude matches the point where the mainland coast abruptly changes its orientation. The islands are 130 km west of San Blas, Nayarit. The four islands of the archipelago are, from south to north, María Cleofas, María Magdalena, María Madre and San Juanito. The archipelago was protected by the Mexican government in 2000. Isla María Madre has served as federal prison since 1905. The other islands are unoccupied. The climate of the islands is dry and very warm with a markedly warm season precipitation regime. Mean annual temperature is 24.9 °C with an oscillation of 7.6 °C. The hottest month is July, while the coldest months are January and February. Mean annual precipitation is 564.2 mm. Northwest winds predominate in winter, while west and southwest winds predominate in summer. The arrival of hurricanes and tropical storms is common from September to October. CONANP (2007) provides more detailed information of the characteristics of the islands.
2. Methodology
2.1 Data
Data provided by the Servicio Meteorológico Nacional (SMN) consist of historical monthly records from January 1922 through February 1989, with gaps in some years from the Isla María Madre weather station. Data were digitized from photocopies of the original document and are the most complete and oldest dataset available without continental influence. Some daily data from the island station are included in the Climate Computing Project (CLICOM) database (WMO, 2012) in the period 1968-1978, with gaps for the entire months of March through May 1970, November and December 1970, and May 1973, and within January 1973 through December 1977. Unlike these daily data, historical monthly data from Isla María Madre station used in this study are not available in any other way. This contribution represents an opportunity to make this data available to researchers. Currently this station is not functioning. The variables used in this study are mean monthly records for air temperature, relative humidity, atmospheric pressure, wind speed, and wind direction. Additionally, we used records of monthly total precipitation from the weather station on the island and daily records from two mainland coastal stations (Mexcaltitán: 21.900° N, 105.483° W; and San Blas: 21.533° N, 105.283° W [Fig. 2]). The mainland data were extracted from the ERIC database (Quintas, 2000) and updated until 2007. Mexcaltitán records span 37 years and San Blas records span 56 years.
2.2 Data processing
Data processing and quality control were performed to remove unreliable values, such as values arising from data input errors not corresponding to the climate of the area. Fortunately, some mainland stations have extreme data, but these can be reconciled because the station coverage allows comparisons with nearby stations. Extreme values produced by hurricanes and mesoscale systems are clearly identified at several stations. Input errors can be identified easily when the anomalous rainfall value is reported at only one station and does not correspond to a natural event. A list of tropical cyclones is available at: http://weather.unisys.com/hurricane/index.php to accomplish this purpose. In the case of mainland rainfall at Mexcaltitan and San Blas, the monthly totals were based on daily values. Monthly totals were considered when the month was complete (100% of available daily records). Otherwise, the month was considered a gap.
2.2.1 Temperature, atmospheric pressure and relative humidity
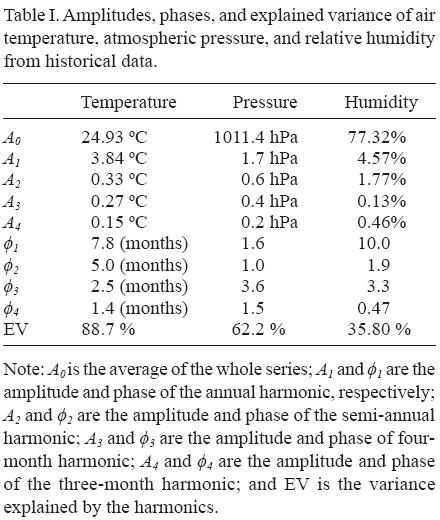
For temperature, atmospheric pressure, and humidity time series, one or two months of missing data were linearly interpolated. This provided a period of analysis from January 1959 through September 1973. A harmonic analysis, using least squares, was applied (Ripa, 2002), obtaining amplitudes and phases for each time series from annual periods to quarterly periods. Percentages of explained variance in the time series were 88.6, 67, and 26.2% for temperature, pressure, and relative humidity, respectively.
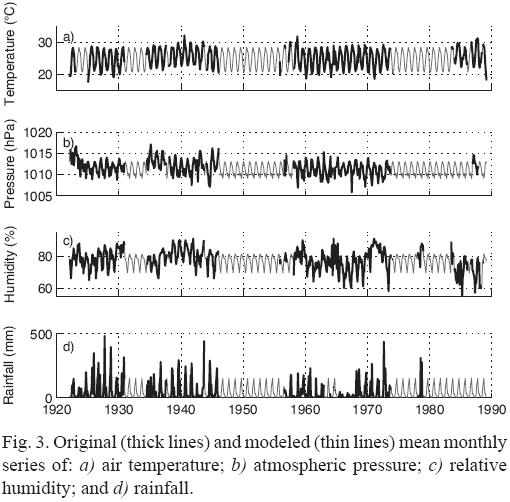
By using these harmonics, gaps were interpolated, extending the period of analysis from January 1922 through February 1989. A new harmonic analysis was applied to the new extended time series (second harmonic analysis), yielding a slight improvement in the percentage of explained variance: 88.7 and 35.6% for temperature and relative humidity, respectively, and a slight reduction of 62.0% for pressure (Table I; Fig. 3). Based on the second harmonic analysis, "modeled time series" were generated to fill the gaps in the original time series. From the extended time series, modeled series were subtracted to analyze inter-annual variability.
2.2.2 Rainfall
Mean monthly precipitation values were estimated as the long-term average per year for the corresponding month. To compare monthly precipitation distribution at each station, series of proportions of annual rainfall (see polygons for each station in Fig. 2) were estimated. The sum of proportions at each station is equal to 100%, corresponding to the cumulative annual total.
2.2.3 Wind
Wind direction was analyzed qualitatively because there is insufficient data. From the monthly data (Table II), the amount of data for each month and wind direction, as well as average speed for a canonical year (with standard deviation), were analyzed. Velocity components used to estimate wind persistence (PER) (Schwerdtfeger, 1959), which is an analysis of mean velocity and mean speed, varies from 0 to 1. Values near zero indicate large variability in wind direction, values close to 1 indicate mostly unidirectional winds (U: east-west wind; V: north-south wind; n: number of measurements).
2.2.4 North American Regional Reanalysis Data
Observations of meteorological variables were compared to the North American Regional Reanalysis data (hereafter RR), which is a long-term homogeneous mesoscale analysis, performed from an updated model and data assimilation system (Mesinger et al, 2006). Its domain covers North America and adjacent oceans. RR data are commonly used by numerical modelers because it has proved reliable for capturing the most important features of regional climate in North America. The total atmospheric data covers 45 levels with a resolution of 32 x 32 km. For our study, we uploaded monthly mean surface air temperature, relative humidity, atmospheric pressure, and zonal and meridional components of surface wind for one location (21°38' N, 106°32' W). The information is available at the website: http://nomads.ncdc.noaa.gov/.
These data were subjected to harmonic analysis. The anomalies were acquired in the same way as the data from the Isla María Madre station. The anomalies were filtered with a five-month moving average to estimate deviations for periods longer than three months. The time period of these data covers 1980 through 2008. Notice that this period does not correspond to the available meteorological information from the weather station.
3. Results
3.1 Harmonic analysis and anomalies from observations
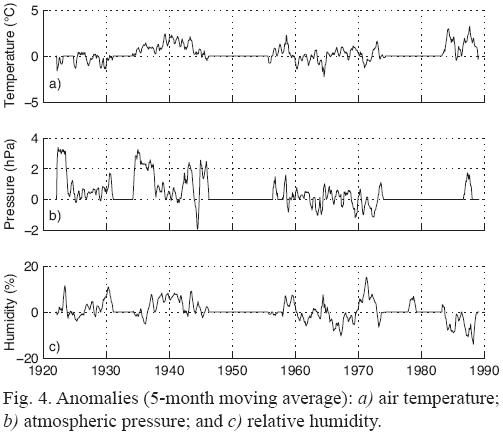
Table I shows the amplitudes and phases of the four harmonics that we used and also provides the percentage of explained variance. In Table I, a description and analysis of the modeled time series, observed time series, and anomalies of temperature, pressure, and relative humidity are shown. Figure 3 displays the closeness between the modeled and the original time series. The similarity between the series fitted well. The differences between time series are based on deviations (original minus the modeled time series, Fig. 4).
3.1.1 Temperature, pressure and relative humidity
Figure 3a shows the high correspondence between observed (thick line) and modeled (thin line) temperature time series; the explained variance was 88.7%. The maximum was reached in late September (approaching 29 °C) and the minimum in mid-February (21 °C).
Filtered temperature anomalies (Fig. 4a) had negative values, not exceeding -2 °C from 1925 through 1930. A warm decade was registered from 1935 through 1945, with positive anomalies of +2.5 °C in 1939, 1940, and 1941. From 1955 through 1975, positive and negative anomalies occurred: +2.5 °C (1959); -1.5 °C (1961); and -2.2 °C (1965). The largest anomalies were: +3 °C (1984) and +3.5 °C (1987).
In Figure 3b, the atmospheric pressure (thin line) peaks in mid-January (1013 hPa) and drops in mid-September (1009 hPa). Original observations are shown by a thick line. Once the seasonal pattern was removed from the observations, we obtained the atmospheric pressure anomalies (Fig. 4b). The largest anomalies occurred in 1921-1922 (+3 hPa), 1935 through 1938 (+3 hPa), and 1945 (-2 hPa). In the series of anomalies, there were several minor periods of ± 2 hPa.
Figure 3c displays the record (thick line) and interpolated time series by harmonic analysis (thin line) of relative humidity. From the modeled series, the maximum was 81% in mid-September; the minimum was 70% in mid-May. Positive anomalies (Fig. 4c) ranged from +10% (1922, 1931, and 1944) to +15% (1972); negative anomalies were 10% (1967, 1987) and 12% (1988).
3.1.2 Rainfall
Figure 3d shows the records of observed data (thick line). Anomalous rainfall (>400 mm) occurred in the summers of 1927, 1944, and 1973. Rainfall peaks in September with a maximum of—151 mm and annual totals of 550 mm. A regional analysis of precipitation (see Fig. 2) showed clear differences between the records from Isla María Madre, with oceanic influence, and stations located near the mainland coast, with reduced oceanic influence. Rain occurred at Isla María Madre in March, but stations near the coast usually reported March as a dry month. Another notable difference was the September peak in precipitation at Isla María Madre and the August peak at stations near the coast (Fig. 2). September rainfall peaks occur in the southern part of the Baja California Peninsula and southward of Nayarit (see Brito-Castillo et al, 2010), which is related to tropical cyclones that reach their northernmost position in September (Díaz et al, 2008). Cyclonic tracks also influence the September peak at Isla María Madre, but not the mainland coast at the same latitudes, where the August peak is an anomalous pattern in the regular progression from south to north, and of the peak summer rainfall from east to west that is influenced by the complex thermodynamic interaction between orography of the Sierra Madre Occidental and the regional monsoon circulation (Brito-Castillo et al, 2010).
The onset of the rainy season in June occurred at the three stations, in contrast to the very dry conditions in May. The shift in moisture conditions on the continent is caused by the North America Monsoon (NAM) circulation (Douglas et al., 1993). The NAM circulation is associated with thermal contrasts between the continent and adjacent eastern Pacific Ocean (Higgins et al., 2003; Giovannettone and Barros, 2008; Turrent and Cavazos, 2009). Initially, greater rainfall occurs in southern México in May, as the Intertropical Convergence Zone (ITCZ) assumes a northerly position during the Northern Hemisphere summer. This position, combined with modulation by the low level jet of the Caribbean (Mo et al, 2005), the easterly waves from the Caribbean, and the lower branch of easterly flow from over the Gulf of Mexico, has a direct influence on the mountain ranges in southern Mexico (Giovannettone and Barros, 2008). This initiates precipitation over the southern slopes and propagates northward as the convective activity and easterlies strengthened in May-June. The combination of moist air from the eastern Pacific Ocean and warm land surfaces causes convective instability, producing frequent summer precipitation over the continent (Grantz et al, 2007 after Adams and Comrie, 1997; Barlow et al., 1998). As moisture is transported from the southeast in May, its influence is barely detectable at the San Blas station. Unlike stations located farther north and at Isla María Madre, May is usually a dry month.
3.1.3 Wind
Table II shows the prevailing wind by month, mostly from the northwest, but with greater variability during the summer. A significant change from a southeasterly component, which is typical of monsoon circulation, is not observed in the data, a situation that is attributed to local-scale conditions at the station. In some instances, the low-level flow is forced to split and move around the island on the windward side by high mountain barriers (i.e., above the height of the trade-wind inversion or >2 km height), as described by Yang et al. (2008). This is not the case at Isla María Madre where peak mountain barriers are below 800 m (see Fig. 1), well below the trade-wind inversion.
Persistence (PER) from the complete set of wind data was calculated as 0.65, with northwestern dominance from the beginning of the year (winter), higher wind speed, and February and March having the most persistent pattern (PER = 0.86 and 0.87, respectively). In late March, north and northeast wind flows increased. In spring, northeast wind increased and April and May had the most persistent northeast winds. The lowest persistence of northwest wind occurred in June (PER = 0.52), August (PER = 0.59), September (PER = 0.65), and October (PER = 0.58), and this included reduced intensity. Particularly from June through August, northeast winds increase as do west and southwest winds, as indicated by persistence during July (PER = 0.52), where the wind was highly variable in direction, with the northwest wind dominant and with the lowest intensity (—1.46 m/s). Northwest winds dominated in September (PER = 0.65) and decreased in October (PER = 0.58) with a notable component from the northeast, west, and southwest. In the last three months, northwest winds dominated.
3.2 Harmonic analysis and reanalysis of data anomalies
Harmonic RR data is shown in Figure 5 for surface air temperature, atmospheric pressure, and relative humidity. Table III contains the results of amplitudes, phases, and explained variance of these variables. Figure 5a shows that maximum temperature (28.1 °C) occurred in mid-August and minimum temperature (21.7 °C) occurred in mid-March. The important anomalies (Fig. 6a) occurred in the winters of 1979 (+1.5 °C), 1983 (+1.0 °C), 1985 (-1.2 °C), 1988 and 1989 (-2.0 °C), 1997 (+1.2 °C), 2003 (+1.4 °C), and 2008 (+1.3° C) corresponding mainly to El Niño and La Niña events; other temperature anomalies were of short duration or did not exceed 1 °C.
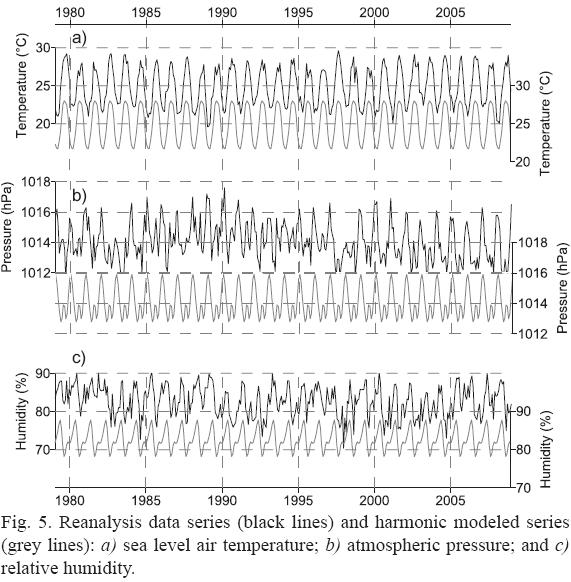
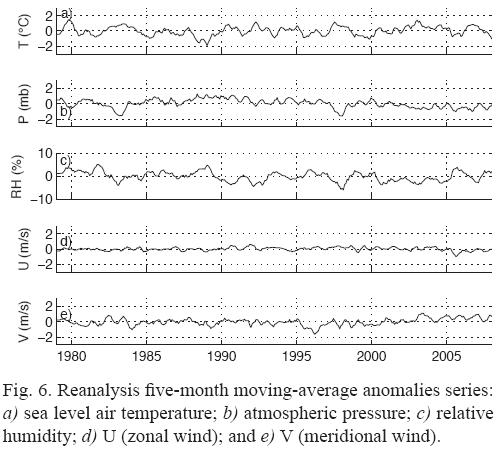
Barometric pressure had a clear annual 1016.0 hPa maximum in January and a 1012.8 hPa minimum in April (Fig. 5b). There was a negative correlation of -0.5 between the time series of pressure anomalies and temperature anomalies. The most significant temperature anomalies coincided with those of pressure in 1983 (-1.7 hPa), 1985 (0.8 hPa), 1989 (1.4 hPa), and 1997 (-1.8 hPa) (Fig. 6b).
Seasonal changes in relative humidity are shown in Figure 5c. The maximum (87.7%) occurred in late April and the minimum (78.5%) occurred in early July. Recall that records at Isla María Madre indicated the opposite pattern: maximum in September and minimum in May. Prominent interannual anomalies of relative humidity occurred in 1981 and 1989 (+5%), and 1992 and 1997 (-5%). These were mostly tied to El Niño episodes in 1992 and 1997 and a La Niña episode in 1989 (Fig. 6c).
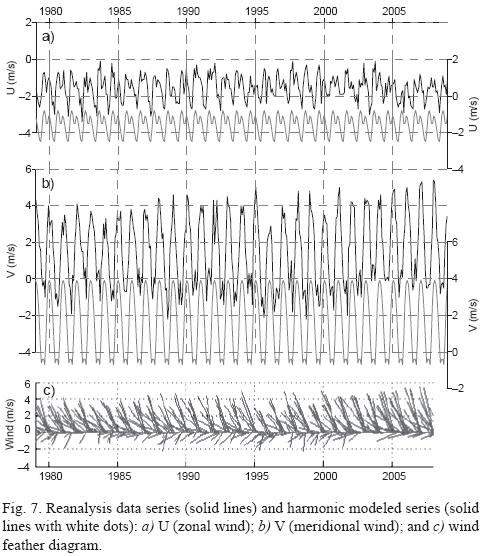
Unlike data of wind velocity at Isla María Madre, the RR showed a clear seasonal signal, with more important meridional (positive-negative, north-south, respectively) component V than the latitudinal component U (positive-negative, east-west, respectively). The V component reached a maximum 3.9 m/s in January and a minimum -0.4 m/s in mid-September, while the U component had bimodal peaks of -0.8 m/s and -1.1 m/s in July and October, respectively, and a minimum of -2.5 m/s in late April (Fig. 7). Anomalies of the wind time series from RR were best represented by the V component (the latitudinal or zonal component U was small). Anomalies in 1996 (-1.4 m/s) and 2003 (1.3 m/s) were most noticeable (Fig. 6d-e).
4. Discussion
Harmonic analysis of historical meteorological time series of the Mexican meteorology service at Isla Maria Madre for 1922 through 1989 and similar analysis of the RR time series for 1978 through 2008 were performed.
4.1 Data from Isla Maria Madre
4.1.1 Temperature
Analysis reveals a seasonal pattern; the amplitude of annual harmonic was 11 times greater than the amplitude of the semi-annual harmonic. Maximum air temperature (28.4 °C) occurs in July and minimum (2G.7 "C) in February. According to Amador et al. (2GG6), maximum solar radiation over the study area occurs in June, July, and August, with July concurrent with the peak month of maximum air temperature. This also increases sea surface temperatures and evaporation. With eastward wind flow, the higher humidity leads to increasing development of convective cells and higher precipitation, which is added to the monsoonal circulation moving from the south (Amador et al., 2GG6, Brito-Castillo et al., 2G1G). Minimum air temperature did not coincide with minimum solar radiation, which occurred in January (Amador et al., 2GG6); but it coincided a month later with minimum sea surface temperature (February-March) (Palacios-Hernández et al, 2G1G). This suggests that minimum air temperatures were strongly influenced by sea surface temperature.
4.1.2 Atmospheric pressure and relative humidity
Atmospheric pressure exhibits annual and semi-annual behavior (amplitudes of 1.0 and 0.7 hPa, respectively). Maxima occurred in January (1013.1 hPa) and minima in September (1009.1 hPa) (Da Silva et al, 1994). The ITCZ moves south during the northern hemisphere winter (Amador et al, 2006), which supports higher pressures in January and February and relatively dry and cold weather surrounding the Islas Marías (see Fig. 5.2). The ITCZ moves north during summer, bringing moisture from the south, and the winds shift from a generally westerly direction in winter to southerly flow in summer in response to land-ocean thermal contrasts. As the landmass warms in summer, the land-ocean temperature gradient increases the movement of winds from the relatively cooler ocean to the mainland (Grantz et al, 2007). The combination of moist air and warm land surface causes convective instability, producing frequent summer precipitations. The offshore area of the Pacific reaches its maximum sea surface temperature in September and more water vapor and heat energy in the atmosphere, leading to low density air masses (Amador et al, 2006). Higher evaporation from warm oceans, as well as moisture transported from tropical cyclones in the eastern Pacific Ocean, contributes to increased rainfall in September, as recorded at Isla María Madre (Mo et al, 2005). The high rainfall observed during September (Fig. 2) reflects tropical cyclones.
Relative humidity is more difficult to interpret because only 35.8% of the variance was explained, and interannual variability was higher than other parameters. May was the driest month and September had the highest humidity. From March to May, atmospheric pressure gradients to the south were relatively weak and atmospheric pressure at sea level remained almost constant; this prevents moisture entering the study area from the south. May was the transition from dry season to wet summer conditions. In June, the ITCZ moved northward, forcing the start of rainstorms. By September, tropical cyclones usually reach their highest latitudinal position, which increases precipitation over the study area. Rising sea temperatures in September add water vapor, which increases relative humidity to peak levels in this month.
4.1.3 Rainfall
Tropical cyclones (TC) and mesoscale convective systems (MCS) are important sources of rainfall in the eastern Pacific Ocean and western Mexico. Several TC trajectories move north, passing over Isla María Madre and enter the Gulf of California. Farfán (2011) states that, from 1970 through 2009, the Baja California Peninsula was the most affected area from TC, with 97% probability of at least one TC each season and 46% probability of having at least one TC moving inland. Díaz et al. (2008) found that a maximum of 67% contribution to annual rainfall total comes from TC over the Los Cabos area, with the highest number of landfalls in Mexico in September (Jáuregui, 2003; Díaz et al., 2008; Farfán, 2011).
Given the fact that peak rainfall at the Isla María Madre station occurred in September (Fig. 2), we conclude that a large contribution to this maximum comes from TC. Unlike the Isla María station, on the coastal plain of the mainland the rainfall peak occurs in August. Time lag of rainfall maxima between Isla María Madre and the coastal plain at the same latitude is indicative of the differential influence caused by TC and MCS over both areas. Using microwave data from the Special Sensor Microwave Imager, Negri et al. (1994) report that, between July and September, pronounced morning maxima occur off the west coast of Mexico from Mazatlán to Puerto Vallarta (20-25° N along 106° W), which were included in the study area. The causes of these maxima are attributed to increased convergence caused by the coastline shape (Negri et al., 1994), indicating that the concave coast and topography are important factors in enhancing convection and precipitation that prevail in the afternoons over Nayarit, which diminishes the dominant role of TC contributions and shifts the rainfall peak to August on the coastal plain. Brito-Castillo et al. (2010) suggest that the August maximum is an anomaly, in contrast to maximum precipitation that normally occurs in July in southern and northern Nayarit. This argument is supported by the regular progression of rain that normally begins in May in the southeast and slowly spreads to the north-northeast with the monsoon circulation. Hence, the August peak in Nayarit was one exception to this progression and could be indicative of an internally generated mode of variability within the monsoon region (Brito-Castillo et al., 2010). Peak rainfall in August on the coastal plain suggests the introduction of additional moisture inshore at latitudes of Nayarit. The moisture comes from the warm offshore water, induced by higher evaporation and convection that lead to mesoscale convective systems (Farfán and Zhender, 1994), which produce heavy rains (>60 mm/24 h) between July and September, with the highest rainfall in August (Brito-Castillo et al., 2010).
Unlike the coastal plain, the influence of the sea in combination with high temperature, low atmospheric pressure, and high relative humidity at the island station generates a rainfall peak in September. Also in September, rainfall to the north has already begun to decline, while tropical cyclones reach their maximum penetration at these latitudes and lead to maximum precipitation in the southern part of the Baja California Peninsula.
4.2 Contrasting long-term meteorological observations with reanalysis data
In many numerical models, RR data are used because they predict with certainty the climatic conditions of North America (Mo et al, 2005). For instance, the development of the monsoon described by the antecedent to RR, the NCEP-NCAR reanalysis data, was consistent with observations (Higgins et al, 1997).
However, one of the important drawbacks of RR data is its spatial resolution (32 km and 45 atmospheric levels) that limit detailed studies of a region and, therefore, cannot substitute in situ observations. For example, precipitation values from RR data were slightly lower than records in southeastern Mexico and the average wind speed in northern Mexico was higher (Mo et al., 2005). Comparing data from RR and from Isla María Madre by calculating an index of correlation cannot be done because the time series do not coincide. Observations from the island station in the 1980s consisted of limited data; after the 1980s, data are not available (Fig. 3). RR data are from 1980 through 2008 (Fig. 5). However, it is possible to compare long-term mean values, that is, climate, of these data.
Table IV compares climatic values from harmonic analysis of temperature of both time series, indicating that temperature was lower in RR by 0.3 °C (maximum) and higher by 1.0 °C (minimum) with a lag of one month. The lag is relevant because the discrepancy may be derived from how RR data are obtained, using established and emerging technologies to access and integrate stored data and climate prediction models. The first harmonic of RR data indicates that the phase was 8.6 months (mid-September). Palacios-Hernández et al. (2010) showed that the first harmonic of the sea surface temperature from satellites had exactly the same phase (8.6 months), which indicates that it was very likely that air temperature obtained by RR was inferred by sea surface temperature. This raises an important difference between actual conditions and RR data, especially if numerical modeling of circulation is performed, including thermodynamics, that is, the forecasts will be affected by this gap.
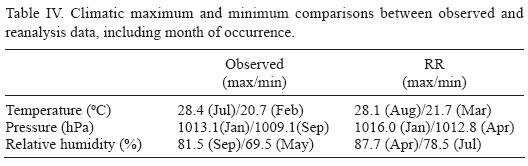
Other variables (relative humidity and atmospheric pressure) also differed (see Table IV) between the different time series in terms of maximum, minimum, and phases, but a smooth adjustment with the island data was poor, so the source of these discrepancies could not be clearly determined. RR temperature, pressure, and relative humidity data tended to reduce the amplitude of these variables. This effect probably results from the smoothing process used to build a regular mesh and homogeneous RR data. The most outstanding difference between the two types of data was with relative humidity; the RR maximum and minimum data occurred in April and July, respectively, while the weather station had maximum and minimum data in September and May, respectively.
For wind fields, the historical time series from Isla María Madre did not have a seasonal pattern as good as the well-known RR (see Table II and Fig. 7). In the comparison, northwest wind was dominant in this area, but was very low in the summer when the zonal wind becomes slightly more dominant.
5. Conclusions
Historical weather data covering January 1922 through December 1989 were analyzed using harmonic analysis. The results showed a satisfactory approximation of the harmonic series to the original time series for mean air temperature (explained variance: 88.7%), and average atmospheric pressure (explained variance: 62.0%). Relative humidity was difficult to forecast (explained variance: 35.6%). The most significant interannual anomalies, based on harmonic analysis, were attributed to El Niño and La Niña events. Prevailing wind was northwestern with great variability in summer.
Rainfall was clearly influenced by oceanic conditions surrounding Isla María Madre, where maximum precipitation occurred in September at the island station and in August at the mainland coastal plain stations. At both positions, maximum precipitation was an anomaly in the regular progression of rain of southeastern Mexico carried by the monsoon circulation.
Differences occurred in the amplitude and phase of RR and Isla María Madre data. Advantages of the reanalysis data are that there are no blanks and are readily available online; the important disadvantage is that they do not represent the reality of weather patterns in the study area. Since Isla María Madre data have a different amplitude and phase than RR data, it seems desirable to use the RR data with caution when employing numerically-coupled, ocean-atmosphere models for delivering weather forecasts, since such results might be skewed.
Acknowledgements
We thank Víctor M. Chávez Pérez and Orietta Sánchez Román of University of Guadalajara for data processing, and Ira Fogel of CIBNOR for editorial services. This work was funded by Consejo Nacional de Ciencia y Tecnología of Mexico (CONACyT grants 44870F and J50757F). Partial support was provided by the Red Mexicana de Desastres Hidrometeorológicos y Climáticos (REDESclim) of Conacyt.
References
Adams D. K. and A. C. Comrie, 1997. The North American monsoon. B. Am. Meteorol. Soc. 78, 2197-2213. [ Links ]
Amador J. A., E. J. Alfaro, O. G. Lizano and V. O. Magaña, 2006. Atmospheric forcing of the eastern tropical Pacific: A review. Prog. Oceanogr. 69, 101-142. [ Links ]
Barlow M., S. Nigam and E. H. Berbery, 1998. Evolution ofthe North American monsoon system. J. Climate 11, 2238-2257. [ Links ]
Brito-Castillo L., E. R. Vivoni, D. Gochis, A. Filonov, I. Tereschenko and C. Monzón, 2010. An anomaly in the occurrence of the month of maximum precipitation distribution in northwest Mexico. J. Arid Environ. 74, 531-539. DOI:10.1016/j.jaridenv.2009.10.014. [ Links ]
CONANP, 2007. Programa de conservación y manejo. Reserva de la biosfera Islas Marías. México: Consejo Nacional de Áreas Naturales Protegidas. [ Links ]
Da Silva A., A. C. Young and S. Levitus, 1994. Atlas of surface marine data. Vol. 1: Algorithms and procedures. NOAA-NESDIS Atlas 6. National Oceanographic Data Center. Washington, D.C.: US Department of Commerce. [ Links ]
Díaz S. C, C. A. Salinas-Zavala and S. Hernández-Vázquez, 2008. Variability of rainfall from tropical cyclones in northwestern Mexico and its relation to SOI and PDO. Atmósfera 21, 213-223. [ Links ]
Douglas M. W., R. A. Maddox, K. Howard and S. Reyes, 1993. The Mexican monsoon. J. Climate 6, 1665-1677. [ Links ]
Farfán L. M., 2011. Eastearn Pacific tropical cyclones and their impact over western Mexico. In: J. Klapp, A. Cros, Ó. Velasco Fuentes, C. Stern and M. A Rodríguez Meza, eds. Experimental and Theoretical Advances in Fluid Dynamics. Berlin, Heidelberg: Springer-Verlag, pp. 135-148. DOI:10.1007/978-3-642-17958-7_9. [ Links ]
Farfán L. M. and J. A. Zehnder, 1994. Moving and stationary mesocale convective systems over northwest Mexico during the southwest area monsoon project. Weather Forecast 9, 630-639. [ Links ]
Filonov A. E. and I. E. Tereshchenko, 2000. El Niño 1997-98. Monitoring in mixed layer of the western coast of Mexico. Geophys. Res. Lett. 27, 705-710. [ Links ]
Giovannettone J. P. and A. P. Barros, 2008. A remote sensing survey of the role of landform on the organization of orographic precipitation in Central and Southern Mexico. J Hydrometeorol. 9, 1257-1283. [ Links ]
Grantz K., B. Rajagopalan, M. Clark and E. Zagona, 2007. Seasonal shifts in the North American Monsoon. J. Climate 20, 1923-1935. [ Links ]
Higgins R. W., Y. Yao and X. Wang, 1997. Influence of the North American monsoon system on the U.S. Summer precipitation regime. J. Climate 10, 2600-2622. [ Links ]
Higgins R. W., A. Douglas, A. Hahmann, E. H. Berbery, D. Gutzler, J. Shuttleworth, D. Stensrud, J. Amador, R. Carbone, M. Cortez, M. Douglas, R. Lobato, J. Meitin, Ch. Ropelewski, J. Schemm, S. Schubert and Ch. Zhang, 2003. Progress in Pan American CLIVAR research: the North American monsoon system. Atmósfera 16, 29-65. [ Links ]
Jáuregui E., 2003. Climatology of landfalling hurricanes and tropical storms in Mexico. Atmósfera 16, 193-204. [ Links ]
Leal-Lupercio J. C., 1996. Comparación de observaciones meteorológicas costeras y marinas de la región norte del Golfo de California. Bachelor thesis. La Paz, B.C.S., Mexico: Universidad Autónoma de Baja California, 210 pp. [ Links ]
Martínez A. J., 2005. Efecto del viento en la circulación del Golfo de Tehuantepec a través de sensores remotos. Oceanografía y Meteorología del Golfo de Tehuantepec. Geos 25, 247 pp. [ Links ]
Mesinger F., G. DiMego, E. Kalnay, K. Mitchell, P. C. Shafran, W. Ebisuzaki, D. Jovic, J. Woolen, E. Roger, E. H. Berbery, M. B. Ek, Y. Fan, R. Grumbine, W. Higgins, H. Li, Y. Lin, G. Mankin, D. Parrish and W. Shi, 2006. North American regional reanalysis. B. Am. Meteorol. Soc. 87, 343-360. [ Links ]
Mo K. C., M. Chelliah, M. L. Carrera, R. W. Higgins and W. Ebisuzaki, 2005. Atmospheric moisture transport over the United States and Mexico as evaluated in the NCEP regional reanalysis. J Hydrometeorol. 6, 710-728. [ Links ]
Negri A. J., R. F. Adler, E. J. Nelkin and G. J. Huffman, 1994. Regional rainfall climatologies derived from special sensor microwave imager (SSM/I) data. B. Am. Meteor. Soc. 75, 1165-1182. [ Links ]
Palacios-Hernández E., L. Carrillo, A. Filonov, L. Brito-Castillo and C. Cabrera-Ramos, 2010. Seasonality and anomalies of sea surface temperature off the coast of Nayarit, Mexico. Ocean Dynam. 60, 81-91. DOI:10.1007/s10236-009-0244-z. [ Links ]
Quintas I., 2000. ERIC II. Documentación de la base de datos y del programa extractor. México: Instituto Mexicano de Tecnología del Agua, 54 pp. [ Links ]
Ripa P. M., 2002. Least squares data fitting. Ciencias Marinas 28, 79-105. [ Links ]
Schwerdtfeger W., 1959. El régimen de los vientos en la costa occidental de San Martín. Buenos Aires: Secretaría de Marina, División Meteorología, 30 pp. [ Links ]
Turrent C. and T. Cavazos, 2009. Role ofthe land-sea thermal contrast in the interannual modulation of the North American monsoon. Geophys. Res. Lett. 36, L02808. DOI:10.1029/2008GL036299. [ Links ]
WMO, 2012. Climate Computing Project. World Meteorological Organization. http://www.wmo.ch/pages/prog/wcp/wcdmp/clicom/index_en.html (April, 2012). [ Links ]
Yang Y., Y. Chen and F. M. Fujioka, 2008. Effects of trade-wind strength and direction on the leeside circulation and rainfall of the island of Hawaii. Month. Weather Rev. 136, 4799-4818. [ Links ]

