


Servicios Personalizados
Revista
Articulo
 Inglés (pdf)
 Artículo en XML
 Referencias del artículo
 Enviar artículo por email
Indicadores
-
 Citado por SciELO
 -
 Accesos
Links relacionados
-
 Similares en
SciELO
Similares en
SciELO
Compartir

 Permalink
Atmósfera
versión impresa ISSN 0187-6236
Atmósfera vol.25 no.3 Ciudad de México jul. 2012
Source apportionment of ambient PM10. A case study from a mining belt of Orissa
P. Roy
Department of Environmental Science and Engineering, Indian School of Mines, Dhanbad, Dhanbad 826004, Jharkhand, India. Corresponding author; e-mail: papiyaroy_ism@yahoo.co.in
P. Kumar Sikdar
Department of Environmental Management, Indian Institute of Social Welfare and Business Management, India Management House, College Square West Kolkata-700073 India
G. Singh and A. Kumar Pal
Department of Environmental Science and Engineering, Indian School of Mines Dhanbad 826004, Jharkhand, India
Received January 3, 2011; accepted February 27, 2012
RESUMEN
Se colectaron muestras de material particulado de 10 micrómetros (PM10) en Talcher, Orissa (India) de seis diferentes sitios con diferentes usos del suelo. El muestreo se realizó de forma concurrente dos veces a la semana durante los meses de junio y noviembre de 2008 y enero de 2009. Se determinó la concentración de la masa ambiental y la composición elemental de las muestras de PM10. Las concentraciones anuales promedio de las muestras en cada sitio fueron 144 ± 29 μg/m3, 191 ± 61 μg/m3, 90 ± 28 μg/m3, 60 ± 15 Hg/m3, 106 ± 35 μg/m3 y 150 ± 36 μg/m3, respectivamente, indicando niveles severos de contaminación del aire en Talcher. Se observó variación del material articulado con relación a parámetros meteorológicos como velocidad del viento, humedad relativa y temperatura. El estudio revela que la concentración del material particulado disminuye sustancialmente con el incremento de la velocidad del viento a más de 1 m/s. Las concentraciones elementales de las PM10 se analizaron utilizando un espectrofotómetro de absorción atómica. Se utilizaron técnicas de análisis multivariado, como el análisis de componentes principales, para identificar y conocer la distribución por posibles fuentes de PM10 y para la cuantificación de elementos traza. Se aislaron cuatro factores por análisis de componentes principales como posibles fuentes: polvo del suelo o polvo fugitivo de actividades asociadas a la minería, emisiones de automóviles, emisiones de la planta termoeléctrica y emisiones de la fundición sin fierro.
ABSTRACT
Samples of particulate matter of size 10 micron (PM10) were collected in Talcher, Orissa (India) from six sites with different land-uses. The sampling was done concurrently twice a week during the months of June 2008, November 2008 and January 2009. The ambient mass concentration and the elemental composition in these PM10 samples were determined. The annual average concentrations of PM10 samples at each site were 144 ± 29 μg/m3, 191 ± 61 μg/m3, 90 ± 28 μg/m3, 60 ± 15 μg/m3, 106 ± 35 μg/m3, and 150 ± 36 μg/m3 respectively, indicating severe air pollution levels in Talcher. Variation of particulate matter with meteorological parameters like wind speed, relative humidity and temperature was observed. The study reveals that the particulate matter concentration drops substantially with the rise of wind speed above 1m/s. Elemental concentrations of PM10 were analyzed using an atomic absorption spectrophotometer. Correlation and multivariate analysis techniques, such as principal components analysis, were used for source apportionment to identify the possible sources of PM10 and quantified trace elements. Four factors were isolated by principal components analysis: soil dust or fugitive dust from mining associated activities, emissions from automobiles, emissions from thermal power plant and non-ferrous smelter, and identified as possible sources.
Keywords: Particulate matter; trace elements; principal component analysis; source characterization; Talcher coalfield.
1. Introduction
The urban atmosphere is subjected to large inputs of anthropogenic pollutants arising from various stationary and mobile sources (Melaku etal, 2008). Elevated concentration of various atmospheric pollutants can pose serious health risks to the exposed population. For this reason, many researchers have focused on the trace elemental composition of atmospheric particles instead of estimating only the quantity of the atmospheric dust particles (Fernández Espinosa et al., 2002).
The composition of the air pollutants can be inorganic, organic, or a complex mixture of both. Environmental sources of pollutants include construction and demolition activities, mining and mineral processing, agricultural activities, sea spray, wind-blown dust, automobiles and transportation related activities on the road. The environmental particles are complicated matter (Suzuki et al., 2006) of various origin and size. Among all other pollutants, air borne trace elements is a major threat to the human health. Normally toxic trace elements are found to be associated with the finer particle size rather than coarser ones (Fang et al, 2000). There have been several recent indications of trace metal deposition in both urban and rural settings (Zhong et al., 1994; Green and Morris, 2006; Michael and Christos, 2006; Seung-Muk et al., 2006). The distribution of atmospheric trace elements is highly dependable on local climate (Ragosta et al., 2006). Finally, the concentrations of toxic elements get biologically magnified through the food chain and pose potential risks to health (Keller et al, 2002; McBride, 2003). In order to establish the combined effect of the heavy metals on air pollution, principal component analysis (PCA) is widely used for source apportionment studies (Fang et al, 2004).
Talcher is one of the industrial hubs of Orissa with a population of approximately 100 000 inhabitants (as per 2001 census). Located on the western bank of the Brahmni River (Fig. 1), the city has many industrial units including the power grade coalfields, power plants and ancillary industries. In recent years, owing to rapid industrial and social developments, Talcher is facing a serious challenge of air pollution, of which, particulate matter has emerged as the key pollutant. The concern is due to various anthropogenic sources, such as coal-based power plants and heavy road traffic. Not enough studies have been done on dust characterization and source apportionment, but those are needed since the region will see the development of more power and steel plants due to the abundance of natural resources. This study was undertaken as a part of Regional Environmental Management Plan of Angul-Talcher-Meramundali Area of Orissa, India by a team consisting of research scholars and faculty members from the Indian School of Mines University, India.
The objectives of the present study were to quantify particulate matter with size less than 10 (μm (PM10), mass concentrations of its chemical composition and apportionment of their sources through multivariate statistics. A standardized monitoring network was set up to complement some previous findings; other than mobile sources, particular focus was placed on the role of stationary source emissions as well. Taking the predominant land-use pattern as the selection criterion, PM10 samples were simultaneously collected for three different seasons in a 1-year period from six sites over Talcher coalfields and surrounding localities. The research was conducted concurrently during the months of June 2008, November 2008 and January 2009 at the Talcher coalfield area. The sampling was done on an 8 hourly basis for a period of 24 h in two consecutive days of a week for that specific month.
2. Methods
2.1 Study area
Talcher coal field (20°50'-21°15' N and 84°09'-85°33' E) having the highest coal resources, is considered one of the potential coal basins of India. The coalfield constitutes the extreme southeastern portion of the Lower Gondwana Mahanadi Master Basin and occupies an area of over 1813 km2. This basin mainly occupies the Brahmani River Valley and covers parts of the Dhenkanal and Angul districts along with a small portion of the adjoining Sambalpur District. Intensive mining activity, rapid urbanization, heavy vehicular movement on the haul roads as well as heavy traffic density on roads, have increased the air pollution in study area. The area has a tropical climate with marked variations of four seasons, viz, summer, monsoon, post monsoon and winter. Maximum temperature is 49.8 °C during summers while minimum temperature is 12 °C during winters. The area receives an average rainfall of 1240 mm. Though there is no variation in total rainfall per annum, large monthly variability is present. May daily the relative humidity way reach 99 % whereas in January it is only 50 %.
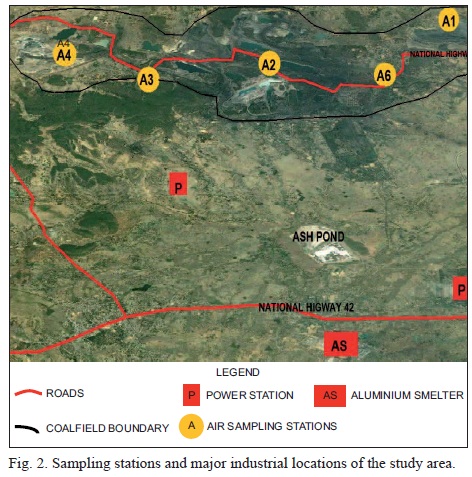
For the study, six monitoring stations have been selected based on the predominance of residential, industrial and commercial activities existing in the local areas. Industrial activities consisting of an aluminium smelter plant, three coal fired power stations and some ancillary industries are dominant in the south and south-east part of the study area (Fig. 2). The raw materials used for these industries are mainly bauxite and coal, otherwise copper (Cu) and iron (Fe) are also used in different operational processes. Particulate matter is the most common pollutant generated from these industrial processes. Gaseous and particulate form of fluoride, gallium (Ga) and iron present in red mud, aluminum, calcium and sodium are found as pollutants from the aluminium smelter. The flue gas from combustion of the fossil fuels is discharged into the ambient air from coal fired power stations; this contains carbon dioxide, water vapour, nitrogen oxides, sulfur oxides and fly ash along with particulate matter.
The study area comprises a number of small roads which finally connect to the national highways NH 200 and NH 23. The NH 200 cuts across the study area in the west-east direction, while the NH 23 is aligned along south to north in the eastern part of the study area. Apart from industrial processes, major activities in the area include coal excavation, processing and its transportation.
Fugitive emission sources include the movement of coal in dumper, trucks and conveyor belts. Other air polluting sources are public transports (bus, taxi, trekker, automobiles) which use unleaded diesel and petrol.
The detailed description on the sampling locations selected for the study is described in Table I. The locations of various stations and major industries along with roads in the study area are given in Figure 2.
2.2 Monitoring protocol
The concentration of PM10 and PM>10 were measured at six sites using respirable dust sampler (Envirotech). Ambient air laden with suspended particulates enters the respirable dust sampler through the inlet pipe. As the air enters the cyclone, coarse PM>10 is separated from the air by centrifugal forces acting on the solid particles. These coarse particulates fall through the cyclone and get collected in the sampling bottle fitted at its bottom. The air stream carrying the fine dust passing through the 0.5 μg pore size filter paper was deposited as respirable fraction (PM10). The instrument was operated at a flow rate of 0.9-1.2 m3/min. The monitoring of pollutants is carried out for 24 hours (8-hourly sampling for particulate matter) twice a week. Special attention was paid while selecting sampling locations. Priority was given to guidelines prescribed by Central Pollution Control Board of India (2006) along with machine safety and availability of electricity. As per CPCB guidelines 104 observations are necessary in a year to analyze data over various seasons. But the guidelines also suggest in case of power shortage, machine safety or hostile weather conditions, to take a minimum of 40 observations for various seasons over the year. In the present study, 74 observations were made for various seasons through out the year.
2.3 Analytical techniques
It is assumed that the PM10 deposited on quartz microfiber filter papers were uniformly distributed over the entire area, and the gravimetric weight of each filter paper was determined (A&D) analytical balance, model GR200). Following the gravimetric analysis, a known portion of the exposed filter paper sample was extracted for trace elemental estimations (APHA, 1977). The quartz microfiber filters were digested in HNO3 (nitric acid). The digested solutions were then analyzed with a GBC Avanta atomic absorption spectroscopy (AAS) coupled with graphite furnace and hollow cathode lamps were used for the estimation of heavy metals in ambient dust particles: zinc (Zn), lead (Pb), copper (Cu), nickel (Ni), manganese (Mn), aluminum (Al) and iron (Fe). An intensive quality control programme was implemented to maintain the accuracy and precision throughout the study.
3. Results and discussion
The sample-to-sample and site-to-site comparison of the PM10 mass concentration is statistically presented in Figure 3 (a, b, c). The range of mass concentrations varied considerably over time from 82 to 188 μg/m3 at Lingraj site, from 65 to 288 μg/m3 at Jagannath site, from 48 to 135 μg/m3 at Kalinga, from 32 to 91 μg/m3 at Gopalprasad, from 53 to 158 μg/m3 at Jagannathpur and from 87 to 210 μg/m3 at Dera Chowk site. The annual average concentrations at each location were 145 ± 30, 192 ± 62, 91 ± 28, 63 ± 18, 114 ± 34, and 153 ± 37 μg/m3, respectively. The annual average values obtained from Jagannath and Dera chowk were higher than the US EPA recommended annual PM10 ambient air quality standard, i.e. 150 μg/m3 (USEPA, 1999). The value obtained at the Lingraj site (144 μg/m3) is very close to the US EPA standard. However, the value at the control site (Gopalprasad) '63 μg/m3' was much lower than the US EPA PM10 standard. To appraise the general pollution levels at the study sites, the present mass concentration data were compared with previously reported data in other parts of India.
Ghosh (2002) measured mass concentration in seasonally collected PM10 samples at five sites in the Jharia coalfield for a similar 1-year period during 2000. The maximum value of 431ug/m3 obtained during winter was 1.5 times higher than maximum value of 288 μg/m3 obtained in our study at the Jagannath site. Another study (Singh and Puri, 2004) assessed the ambient air quality status at the Korba coalfield which has similar land use pattern, mining and industrial activities to our study area. Maximum respirable particulate matter (RPM) concentration at the Korba area was 431 μg/m3, also 1.5 times higher than our maximum value. These values were much higher than the current US EPA recommended annual PM10 ambient air quality standard (USEPA, 1999). Overall, the mass concentration at the industrial site of Jagannath was generally the highest among the six sites and it was approximately five times higher than the concentration of the control site at Gopalprasad. The higher PM10 concentrations at sites Lingraj, Jagannath, Kalinga, Jagannathpur and Dera Chowk may reflect a significant contribution of anthropogenic sources compared to the control site. Influence from occasional pollution episodes on the measurements of PM10 concentrations were ignored since the simultaneous monitoring was executed at all six sites with relatively high sampling heights. High ambient PM10 mass concentration peaks occurred only at Jagannath, suggesting that the contribution of stationary industrial emissions was more important than the contribution of mobile sources even in areas with heavy traffic (Chen et al, 2008).
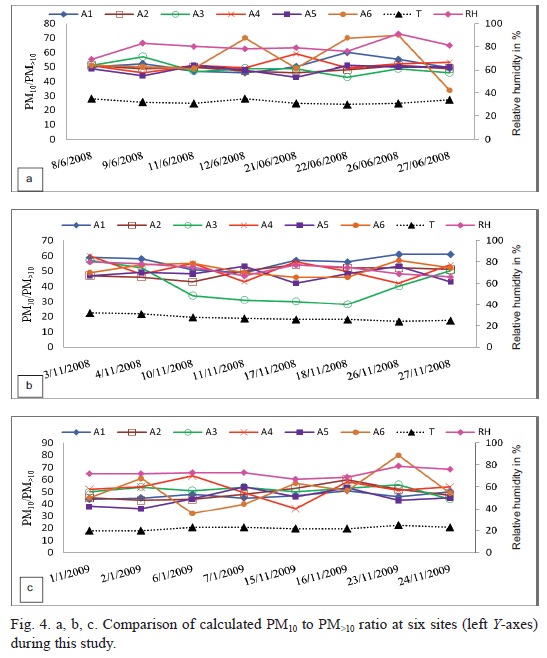
Ambient PM10 mass concentration was associated not only with source processes but also with changes in environmental conditions, particularly with winds. An attempt was made to investigate the direct influence of wind speed on the concentration levels of PM10. Evaluation of the spatial variation of PM10 with wind speed (Fig. 3 a, b, c) found that the concentrations of PM10 tended to fall into a relatively narrow range for all six sites when an increase in wind speed (>1m/s) occurred. To explore more site-specific information in Talcher, the PM10/PM>10 ratio and the averaged data of two meteorological parameters are shown in Figure 4 a, b, c. Relative humidity (RH) and the temperature characterize well the tropical and humid climate of eastern India. The ranges of all samples for the PM10/PM>10 ratio were 0.44-0.61 for Lingraj, 0.43-0.60 for Jagannath, 0.28-0.57 for Kalinga, 0.42-0.63 for Gopalprasad, 0.36-0.54 for Jagannathpur and 0.32-0.72 for Dera chowk. Our values are consistent with the reported literature value of 0.59 for urban sites in China (Wei et al., 1999). The highest ratio of PM10/PM>10 recorded in this work was at the traffic junction site of Dera Chowk. It has been reported that aerosol samples taken in urban areas showed that mobile source emissions usually constitute the most important source of PM10 in urban environments (USEPA). We can confirm the fact that mobile sources were the most important contributor of PM10 in Talcher area. The wide range of variation of PM10/PM>10 ratio in Dera chowk sites indicates that there is a significant addition of fine mass concentrations from stationary industrial emissions, other than vehicular emission.
3.1 Elemental concentrations in PM10 samples
For the assessment of air quality, the concentrations of seven elements i.e. Pb, Cu, Ni, Fe, Zn, Mn and Al in the PM10 samples were analyzed by AAS. Table II compares their elemental concentrations (μg/m3) in PM10 samples collected from the six study sites.
An elevated level of Al concentration (0.32-23.6 μg/m3) was observed at all the study sites followed by Zn (1.0-14.32 μg/ m3) and Fe (0.005-8.60 μg/m3). The maximum Al concentration (23.60 μg/m3) was found at the Jagannathpur site followed by Lingraj (13.20 μg/m3). As shown in Figure 2, in the southern part of the study area there is an aluminium smelter plant and three coal fired power stations. The general wind direction during the sampling periods was from south to north. More specifically, prevalent wind direction during June, November and January is NW, NE and NE respectively. General observation of wind direction pattern suggests that the fly ash contains traces of Al2O3 (Mineral Perindustrian, 2003) and the stack emission from the aluminium smelter after being carried by the wind is deposited in the sampling locations. While mining, this element is deposited on the soil and then re-suspended along with the fugitive dust. Maximum Zn concentration was observed at Dera chowk site (14.32 μg/m3) followed by Jagannath (10.80 μg/m3). The crustal element Fe (0.31-8.66 μg/m3) which is usually found in crustal rock and soil particles (Hu et al., 2003; Kumar et al., 2001) was the third most abundant element in this study. The highest concentration of Fe was observed at Kalinga (8.66 μg/m3) followed by Jagannath (8.60 μg/m3). The ranges of Ni and Mn varied from (0.005-0.90 μg/m3) and (0.01-0.85 μg/m3) respectively. The highest concentration of Ni (0.90 μg/m3) and Mn (0.85 μg/m3) was recorded at Dera chowk. Cu (0.02-0.15 μg/m3) and Pb (0.01-0.66 μg/m3) concentration were found lower than the other trace elements.
Table III shows the comparison of metallic element concentrations (μg/m3) for ambient air particles at several locations in the world. In most of the studies, Fe has been found to be the most abundant element. The highest concentration of Fe (38.90 μg/m3, Parekh et al., 1967) was found at industrial sites of Brazil. Higher Fe concentration (24.8 μg/m3, Salam et al., 2003) was also reported from urban areas of Bangladesh. In both the cases, the reported concentrations were about 4 and 6 times respectively higher than the maximum concentrations found (8.66 μg/m3) by this study. Concentrations of Fe (9.93 μg/m3, Smith et al., 1996) at Lahore, Pakistan were quite similar to our findings. As for Cu the highest concentrations were noted in Gandhinagar, India (1.55 μg/m3, Kumar et al., 2001). In comparison, the maximum value obtained in our study was 0.15μg/m3 (Dera chowk) 10 times lower than in Gandhinagar, but notably higher than the value reported in Beijing, China (0.50 μg/m3, Song et al., 2006). The concentration ranged from 0.32 μg/m3 (Jagannathpur) to 23.60 μg/m3 (Jagannath).
The concentration of Zn obtained from Pakistan (Smith et al., 1996), was ranked the highest (27.7 μg/m3) compared with studies in other regions. Furthermore, the metallic concentrations of Zn in Rio de Janeiro, Brazil (2.12 μg/m3, Quiterio et al., 2004) were lower than the maximum value obtained in present study where it had a range between 1.0 to 14.32 μg/m3 (Dera chowk). The higher concentration of Pb was measured in Lahore, Pakistan (3.92 μg/m3, Smith et al., 1996). For the study at Talcher, the maximum concentration of Pb was found to be 0.66 μg/m3 at Gopalprasad. Sharma and Patil (1992) revealed high Ni concentration (0.040 μg/m3) at Mumbai, India. Concentrations of Ni in our study were lower (0.005-0.90 μg/m3) than in Mumbai. The highest concentration of Mn was recorded at Rio de Janerio, Brazil (1.216 μg/m3, Quiterio et al., 2004), while in our study, the maximum Mn concentration was found to be 0.85 μg/m3 at Dera chowk.
3.2 Source apportionment of trace elements
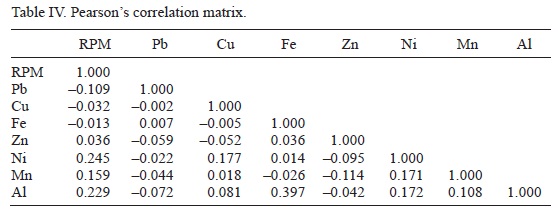
Principal component analyzing (PCA) was applied to determine correlations between pollutants and to identify the source profiles of heavy metals in PM10. These multivariate techniques are based on the analysis of the association matrix and they are able to point out the correlation among the measured variables. Table IV represents Pearson correlation coefficient values.
Based on this matrix, four new sets of synthetic variables were obtained (principal components) and are presented in Table V. These sets resulted in four rotated factors associated with eigen values >1.0, synthesized after applying the Varimax rotation. The total variation explained by the four factors was 63.4 %.
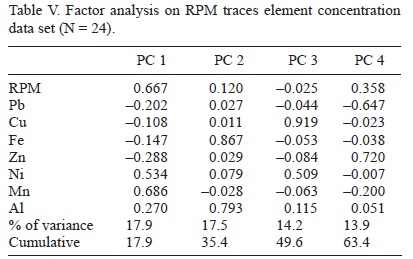
The first principal component (PC) explains 17.9 % of data variance and it is characterized by PM10 (0.667), Ni (0.534), and Mn (0.686). These trace elements are mainly related to motor vehicle emissions and also dust in suspension (Ragosta et al., 2008; Handt and Fernández, 2008). Several studies have already identified Ni as a typical tracer for fossil fuel combustion (Pacyna, 1986; Artaxo et al., 1999; Manoli et al., 2002; Khillare et al., 2004) whereas Mn is a well known additive (methylcyclopentadienyl manganese tricarbony) used in unleaded gasoline to boost octane rating and reduce engine knocking. A significant amount of road dust is present near the sampling locations and is also in regular suspension by vehicular movement. Hence, this factor for variance can be identified as the road dust component. The second PC explains 17.5 % of the total data variance and presented high loading for Fe and Al; it can be interpreted as crustal contribution (Almeida et al., 2005; Guerzoni et al., 2005; Song et al., 2006; Ragosta et al., 2008). The third PC accounts for 14.2 % of raw data variance, and is related to a mixture of industrial activities like coal fired power station and biomass burning with high levels for Cu and Ni. Such levels can be found in industrial emission (Dallarosa et al., 2007) as well as emissions from combustion (Zheng et al., 2005). Furthermore in Table IV we may observe that Ni is characterized by similar loadings both in PC1 (0.534) and in PC3 (0.509). This result suggests that in the sampling area, the Ni level is determined by a mix of different anthropogenic and natural sources. The fourth PC explains 13.9 % of total the data variance. The high factor loadings on Pb (-0.647) and Zn (0.720) and their inverse correlation (-0.059) at 99.9 % significance level, may indicate that the source contributing Pb is totally different from that of Zn. It is believed that Pb originated from the power stations (Guerzoni et al., 2005), while the source of Zn is the non-ferrous smelter (Ho and Lee, 2002).
Overall site specific analysis of PM10 data reveals Jagannath station to be the most polluted in terms of dust loading with a maximum concentration of 288 μg/m3. Evaluation of the spatial variation of PM10 with wind speed inferred that the concentrations of PM10 tended to fall with an increase in wind speed (>1m/s). The wide variation of PM10/PM>10 in the study area indicated that vehicular emission is the predominant polluting sources for finer particle in the study area. The concentrations of trace metals in PM10 were observed in the following order: Al >Zn >Fe >Mn >Cu >Pb >Ni. Focusing our attention on metal source characterization, the multivariate techniques allowed us to identify four source components. The first component is characterized by PM10 which represents soil dust, also Ni and Mn that are elements typical of traffic emission. The second source is associated with crustal elements, with Fe and Al as the constituents of soil dust from mining operation. The third component is identified as industrial source and vehicular traffic emission characterized by Cu and Ni, respectively. The fourth component is characterized by Pb and Zn, indicates two anthropogenic but distinct origins: power stations and non-ferrous metallurgy. Furthermore, we note that this component includes Zn, very high levels confirming the presence of a specific industrial emission source, like a smelter. Hence we conclude that in the investigated area the levels of some trace elements are very high. In some cases PM10 concentrations were also found to be higher than the standard specified by the USEPA. This suggests that future strategies for air quality control on a local scale have to take into account not only the amount of atmospheric particles, but their chemical composition as well.
Acknowledgements
The authors are grateful to Indian School of Mines University, Dhanbad and State Pollution Control Board (SPCB), Orissa who are the two financial supporters of the study. The authors are also thankful to the Director of Indian School of Mines University for providing necessary institutional support and permission to publish this paper. The necessary support and facilities for field survey provided by the Regional State Pollution Control Board (Angul) and SPCB (Orissa) are hereby acknowledged.
References
Almeida S. M., C. A. Pio, M. C. Freitas, M. A. Reis and M. A. Trancoso, 2005. Source apportionment of fine and coarse particulate matter in a sub-urban area at the Western European Coast. Atmos. Environ. 39, 3127-3138. [ Links ]
APHA, 1977. Methods of air sampling and analysis. 2nd ed. American Public Health Association. Washington DC, USA, 984 pp. [ Links ]
Artaxo P., P. Oyola and R. Martínez, 1999. Aerosol composition and source apportionment in Santiago de Chile. Nucl. Instrum. Meth. B 150, 409-416. [ Links ]
CPCB, 2006. Air Quality Trends and Action Plan for Control of Air Pollution from Seventeen Cities. National Ambient Air Quality Monitoring, Central Pollution Control Board, Ministry of Environment & Forests, New Delhi, India. 202 pp. [ Links ]
Chen J., M. Tan, Y. Li, J. Zheng, Y. Zhang, Z. Shan, G. Zhang and Y. Li, 2008. Characteristics of trace elements and lead isotope ratios in PM25 from four sites in Shanghai. J. Hazard. Mat. 156, 36-43. [ Links ]
Dallarosa J., E. C. Teixeira, L. Meira and F. Weigand, 2008. Study of the chemical elements and polycyclic aromatic hydrocarbons in atmospheric particles of PM10 and PM25 in the urban and rural areas of South Brazil. Atmos. Res. 89, 76-92. [ Links ]
Fang G. C., C. N. Chang, Y. S. Wu, V. Wang, P. P. C. Fu, D. G. Yang, S. C. Chen and C. C. Chu, 2000. The study of fine and coarse particles, and metallic elements for the daytime and nighttime in a suburban area of central Taiwan, Taichung. Chemosphere 41, 639-644. [ Links ]
Fang G. C., C. N. Chang, Y. S. Wu, M. H. Chen, T. T. Ho, S. H. Huang, 2004. A study of metallic elements at suburban and industrial regions in central Taiwan during 2002-2003. Atmos. Environ. 70, 131-142. [ Links ]
Fernández Espinosa A. J. F., M. Ternero Rodríguez, F. J. B. de la Rosa and J. C. Jiménez Sánchez, 2002. A chemical speciation of trace metals for fine urban particles. Atmos. Environ. 36, 773-780. [ Links ]
Ghosh M. K., 2002. Air pollution due to opencast coal mining and the characteristics of air-borne dust -an Indian scenario. Int. J. Environ. Stud. 59, 211-228. [ Links ]
Green N. A. and V. R. Morris, 2006. Assessment of public health risks associated with atmospheric exposure to PM2.5 in Washington, DC, USA. Int. J. Environ. Res. Public Health 3, 86-97. [ Links ]
Guerzoni S., G. Rampazzob, E. Molinarolib and P. Rossini, 2005. Atmospheric bulk deposition to the Lagoon of Venice Part II. Source apportionment analysis near the industrial zone of Porto Marghera, Italy. Environ. Int., 31, 975-982. [ Links ]
Handt H. and R. Fernández, 2008. Operational speciation of Cd, Cr, Cu, Mn, Ni, Pb, V and Zn in dust samples from schools in Caracas, Venezuela. Atmosfera 21, 335-345. [ Links ]
Hien P. D., N. T. Binh, Y. Truong, N. T. Ngo and L. N. Sieu, 2001. Comparative receptor modeling study of TSP, PM2 and PM2-10 in Ho Chi Minh City. Atmos. Environ. 35, 2669-2678. [ Links ]
Ho K. F. and S. C. Lee, 2002. Identification of atmospheric volatile organic compounds (VOCs), polycyclic aromatic hydrocarbons (PAHs) and carbonyl compounds in Hong Kong. Sci. Total Environ. 289, 145-158. [ Links ]
Hu C. W., M. R. Chao, K. Y. Wu, G. P. Chang-Chien, W. J. Lee, L. W. Chang and W. S. Lee, 2003. Characterization of multiple airborne particulate metals in the surroundings of a municipal waste incinerator in Taiwan. Atmos. Environ. 37, 2845-2852. [ Links ]
Keller C., S. P. McGrath and S. J. Dunham, 2002. Trace metal leaching through a soil grassland system after sewage sludge application. J. Environ. Qual. 31, 1550-1560. [ Links ]
Khillare P. S., S. Balachandran and B. R. Meena, 2004. Spatial and temporal variation of heavy metals in atmospheric aerosols of Delhi. Environ. Monit. Assess. 90, 1-21. [ Links ]
Kumar A. V., R. S. Patil and K. S. V. Nambi, 2001. Source apportionment of suspended particulate matter at two traffic junctions in Mumbai, India. Atmos. Environ. 35, 3245-4251. [ Links ]
Manoli E., D. Voutsa and C. Samara, 2002. Chemical characterization and source identification/ apportionment of fine and coarse air particles in Thessaloniki, Greece. Atmos. Environ. 36, 949-961. [ Links ]
McBride M. B., 2003. Toxic metals in sewage sludge-amended soils: has promotion of beneficial use discounted the risks? Adv. Environ. Res. 8, 5-19. [ Links ]
Melaku S., V. Morris, D. Raghavan and C. Hosten, 2008. Seasonal variation of heavy metals in ambient air and precipitation in Washington, D. C. Environ. Pollut. 155, 88-98. [ Links ]
Michael R. G. and S. C. Christos, 2006. Particle size distribution and atmospheric metals measurements in a rural area in the South Eastern USA. Sci. Total Environ. 356, 217-227. [ Links ]
Mineral Perindustrian, 2003. http//mineral.eng.usn.my/wen%20halaman%20mineral/Components%20of20coal%20ash.pdf. Acceded on September, 2011. [ Links ]
New PM25 profiles for mobile source emissions, http://www.epa.gov/nerl/research/2000/html/g1-09.html. Acceded on September, 2011. [ Links ]
Pacyna J. M., 1986. Emission factors of atmospheric elements. In: Toxic Metals in the Atmosphere (Nriagu J. O., C. I. Davidson, Eds.). John Wiley and Sons. Inc., York, 1-32. [ Links ]
Parekh P. P., B. Ghauri and L. Husain, 1967. The use of chemical and statistical methods to identify sources of selected elements in ambient aerosols in Karachi, Pakistan, Atmos. Environ. 21, 1267-1274. [ Links ]
Quiterio S. L., C. R. S. Sousa, G. Arbilla and V. Escaleira, 2004. Metals in airborne particulate matter in the industrial district of Santa Cruz, Rio de Janeiro, in an annual period. Atmos. Environ. 38, 321-331. [ Links ]
Ragosta M., R. Caggiano, M. D'Emilio M., S. Sabia, S. Trippetta and S. Macchiato, 2006. PM10 and heavy metal measurements in an industrial area of Southern Italy. Atmos. Res. 81, 304-319. [ Links ]
Ragosta M., R. Caggiano M. Macchiato, S. Sabia and S. Trippetta, 2008. Trace elements in daily collected aerosol: Level characterization and source identification in a four-year study. Atmos. Res. 89, 206-217. [ Links ]
Salam A., H. Bauer, K. Kassin, S. Mohammad Ullah and H. Puxbaum, 2003. Aerosol chemical characteristics of a mega-city in Southeast Asia (Dhaka, Bangladesh), Atmos. Environ. 37, 2517-2528. [ Links ]
Seung-Muk Y., A. L A. Totten, S. Thota, S. Yan, J. H. Offenberg, E. J. Eisenreich, J. Graney and M. T Holsen, 2006. Atmospheric dry deposition of trace elements measured around the urban and industrially impacted NY-NJ harbor. Atmos. Environ. 40, 6626-6637. [ Links ]
Shah M. H. and N. Shaheen, 2007. Statistical analysis of atmospheric trace metals and particulate fractions in Islamabad, Pakistan. J. Hazard. Mat. 147, 759-767. [ Links ]
Sharma V. K. and R. S. Patil, 1992. Chemical composition and source identification of Bombay aerosol. Environ. Technol. 13, 1043-1052. [ Links ]
Singh G. and S. K. Puri, 2004. Air quality assessment in Korba Coalfield, Indian Journal of Air Pollution Control IV, 31-41. [ Links ]
Smith D. J. T., R. M. Harrision, L. Luhana, A. P. Casimiro, L. M. Castro, M. N. Tariq, S. Hayat and T. Quraishi, 1996. Concentrations of particulate airborne polycyclic aromatic hydrocarbons and metals collected in Lahore, Pakistan. Atmos. Environ. 30, 4031-4040. [ Links ]
Song Y., S. Xie, Y. Zhang, L. Zeng, L. G. Salmon and M. Zheng, 2006. Source apportionment of PM25 in Beijing using principal component analysis/absolute principal component scores and UNMIX. Sci. Total Environ, 372, 278-286. [ Links ]
Suzuki K., T. Takii, B. Tomiyasu and Y. Nihei, 2006. Characterization of individual complex particles in urban atmospheric environment. Appl. Surf. Sc., 252, 7022-7025. [ Links ]
USEPA, 1999. Particulate matter (PM25) speciation guidance. US Environmental Protection Agency. Final draft. US Environmental Protection Agency, 1999. Ed. 1. Office of Air Quality Planning and Standards, Research Triangle Park, NC, 50 pp. [ Links ]
Wei F., E. Teng, G. Wu, W. Hu, W. E. Wilson, R. S. Chapman, J. C. Pau and J. Zhang, 1999. Ambient concentrations and elemental compositions of PM10 and PM25 in four Chinese cities. Environ. Sci. Technol. 33, 4188-4193. [ Links ]
Zheng M., L. G. Salmon, J. J. Schauer, L. Zeng, C. S. Kiang, Y. Zhang and G. R. Cass, 2005. Seasonal trends in PM25 source contributions in Beijing, China. Atmos. Environ. 39, 3967-3976. [ Links ]

