


Services on Demand
Journal
Article
 English (pdf)
 Article in xml format
 Article references
 Send this article by e-mail
Indicators
-
 Cited by SciELO
 -
 Access statistics
Related links
-
 Similars in
SciELO
Similars in
SciELO
Share

 Permalink
Atmósfera
Print version ISSN 0187-6236
Atmósfera vol.25 n.3 Ciudad de México Jul. 2012
Numerical simulation of a heavy rainfall event over Portugal using mesoscale model
A. M. Ramos
Instituto Nacional de Meteorologia (INMET). Eixo Monumental, Via S1 Sudoeste. 70680-900. Brasília-DF, Brazil. and Geophysics Centre of Évora (CGE), University of Évora, Portugal. Rua Romão Ramalho, 59. 7000-671. Évora, Portugal Corresponding author; e-mail: andrea.ramos@inmet.gov.br
F. C. Conde
Geophysics Centre of Évora (CGE), University of Évora, Portugal. Rua Romão Ramalho, 59. 7000-671. Évora, Portugal
D. S. Moreira, S. R. Freitas
Center for Weather Prediction and Climate Studies-CPTEC/INPE, Rodovia Presidente Dutra, Km. 39, 12630-000. Cachoeira Paulista, São Paulo, Brazil
A. M. Silva
Geophysics Centre of Évora (CGE), University of Évora, Portugal. Rua Romão Ramalho, 59. 7000-671. Évora, Portugal
E. W. M. Lucas
Instituto Nacional de Meteorologia (INMET), Eixo Monumental, Via S1 Sudoeste, 70680-900. Brasília-DF, Brazil
Received November 12, 2010; accepted April 14, 2012
RESUMEN
Los eventos fuertes de precipitación incuestionablemente tienen, de entre todos los fenómenos atmosféricos, los mayores impactos económicos y sociales. El propósito de este trabajo es simular las condiciones climáticas asociadas con el episodio de precipitación fuerte que ocurrió entre el 11 y el 13 de marzo de 2002 y que generó lluvia intensa así como granizo y nieve en las regiones central y norte de Portugal continental. La simulación se llevó a cabo utilizando el sistema de modelación atmosférica regional (Regional Atmospheric Modelling System, RAMS) con redes de configuración de 48 y 12 km y una resolución máxima de 3 km para capturar los patrones de circulación sinópticos y de mesoescala. Las condiciones iniciales y laterales de frontera necesarias para ejecutar el RAMS se obtuvieron de los modelos globales de pronóstico del centro brasileño de predicción del tiempo y estudios climáticos (Centro de Previsão de Tempo e Estudos Climáticos, CPTEC) en la forma de coeficientes espectrales con triangulación truncada T62 equivalente a 1.825° de resolución en las direcciones meridional y zonal. Los resultados del modelo muestran que el RAMS es un marco útil para describir los patrones de lluvia de la región, reproduciendo razonablemente bien el área sin precipitación dentro del dominio; sin embargo el modelo sobreestima o subestima los valores observados en diferentes periodos. La distribución espacial de la precipitación total acumulada mostró una tendencia a predecir mayor precipitación sobre los lugares elevados, probablemente por la influencia del forzamiento dinámico y la asociación con procesos microfísicos.
ABSTRACT
Strong rainfall events have unquestionably one of the largest economic and social impacts of any atmospheric phenomena. The purpose of this paper is to simulate the weather conditions associated with the heavy precipitation episode during 11-13 March 2002, which generated intense rainfall as well as hail and snow in the central and northern regions of Continental Portugal. The simulation was carried out using the Regional Atmospheric Modeling System (RAMS), through a three nested grids configuration 48 km, 12 km and the highest resolution being 3 km, to capture the synoptic and mesoscale circulation patterns. The initial and lateral boundary conditions necessary to drive RAMS were taken from the Brazilian Center of Weather Prediction and Climate Studies (CPTEC) global model forecasts in the form of spectral coefficients with T62 triangular truncation equivalent to 1.825° resolution in the meridional and zonal directions. The model results show that the RAMS model is a useful framework to describe the rainfall patterns over the region, reproducing the area without rainfall within the domain reasonably well, although the model overestimated or underestimated the observed values at different periods. The spatial distribution of the total accumulated rainfall showed some tendency to predict more precipitation over higher elevations, probably influenced by dynamical forcing and associated microphysical processes.
Keywords: Atmospheric modelling, strong rainfall, synoptic analysis, depression.
1. Introduction
The observed behavior of air masses that influence the Iberian Peninsula (IP), located in southwest Europe, are mainly conditioned by topography, whose effect has a decisive role in weather conditions in different regions. Topography and local circulation can enhance the activity of mesoscale convective systems, which under favorable environmental conditions can generate heavy rainfall and severe weather in a few hours (Smith el at, 1996).
Heavy rainfall is a subjective term and its definition varies significantly. However, it generally refers to a short period of time ranging from a few hours to one day (Teixeira et al., 2006). In many disastrously heavy rainfall episodes both intensity and duration of rain tend to be large. Harnack et al. (1999), for example, defined heavy rainfall episodes as those that had more than 51 mm of precipitation over an area of 10 000 km2 in a period of 1 to 2 days.
Strong rainfall events have unquestionably one of the largest economic and social impacts of any atmospheric phenomena and, sometimes, cause human casualties. Floods are systematically observed in association with these infrequently occurring events, especially in urban areas where the drainage may be inadequate to accommodate a sudden large amount of rainfall and rural regions, crops and livestock can suffer damage from excessive rainfall (Carvalho et al., 2002). In areas near river basins, heavy rain events can cause flood and are dramatically affected by such factors as antecedent precipitation, the size of the drainage basin, the topography of the basin, the amount of urban use within the basin among others. Thus, a flood event is the concatenation of a meteorological event with a particular hydrological situation (Doswell III et al., 1996).
During winter the large-scale circulation over the IP is mainly influenced by the position and intensity of the Icelandic low and Portugal is affected by westerly winds that carry moist air and produce rainfall events mainly in northern Portugal. This rainfall is intensified by the passage of cold fronts associated with transitory depressions. However, during winter Portugal can also be affected by northward extensions of the Azores anticyclone, which leads to warm and dry airflow of tropical maritime origin (Amorim Ferreira, 1954b).
The purpose of this paper is to simulate the weather conditions associated with the heavy rainfall episode during 11-13 March 2002, which generated intense rainfall as well as hail and snow in the central and northern regions of Continental Portugal. There are several published studies that deal with numerical simulations of heavy rainfall events for areas that involve the IP, mainly over Spain (Fernández et al., 1995, Romero et al., 1998; Sotillo et al., 2003, Mariani et al., 2005, Pastor et al., 2010, Gómez et al, 2011), but few publications cover the target area in this study.
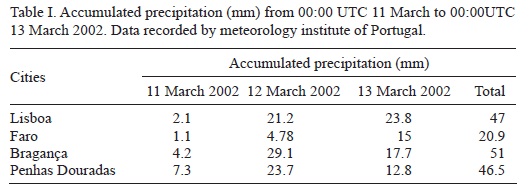
The Regional Atmospheric Modeling System (RAMS) version 4.3 was used to reproduce and help understand the event. The model was configured to capture the synoptic and mesoscale circulation patterns, using the technique of grid-nesting with successively higher resolutions. According to the Meteorological Bulletin of Portugal several cities were affected by the event, but for this study, four cities evenly distributed over the country (their locations are shown in Fig. 5b), with different factors influencing the rainfall such as topography and sea surface temperature, were selected to validate the results generated by RAMS: Bragança, Penhas Douradas, Lisbon and Faro. Table I shows the accumulated precipitation recorded by the meteorological networks of the meteorology institute of Portugal during 11-13 March 2002 for the four selected cities.
2. Case description
The synoptic analysis describes the atmospheric conditions over the large-scale area indicating the evolution of the strong baroclinic episode within the active frontal system over the area of study. The mean sea level pressure (Pa) pattern for the period 11-13 2002 (Fig.1a) showed an intense depression located in the North Atlantic that advected moisture towards the European continent. The associated frontal system led to changes in the weather conditions of the affected areas causing short periods of heavy rainfall with snow and hail fall. The upper-level flow indicated a relatively cold column of air, with its core located west of Portugal, between the surface and 500 hPa, while areas of larger geopotential heights associated with relatively warm columns of air moved southward over northeast Africa (Figure 1b).
The satellite images and the UK Met-Office surface analysis charts provide an overview of the evolution of the system. On 10 March there was an oceanic air mass moving from the west within which a trough influenced the state of the weather in Continental Portugal (figure not shown). Twenty-four hours later this maritime air mass and associated frontal system intensified, causing a pronounced cloud band stretching from the Atlantic to west of Portugal across the British Isles as can be observed on 11 March at 17:00 UTC (Figure 2a).

A large cold air mass is clearly recognizable with a depression centred to the west of the Iberian Peninsula associated with the passage of a cold front that reached the continent, provoking instability in the area on 12 March (Fig. 2b). Twenty-four hours later (Fig. 2c) this system interacted with an area of strong convective activity, which had developed over the Atlantic Ocean, therefore intensifying the pressure gradients onshore. In association with a cold front, it produced southeasterly coastal winds maintaining convection activity over the area. By 23:30 UTC on 13 March (Fig. 2d) the system moved eastwards and dissipated.
On the track of radar echoes from 11 March precipitation cells were observed in the whole domain at 21:00 UTC (Fig. 3a), with deeper convection areas of about 16 mm h-1 in the north and along the coast associated with the frontal cloud band in the SW-NW direction (Fig. 2b). The rainfall cells did not change significantly from 00:00 UTC 12 March until 19:40 UTC 13 March, when the system began dissipating. Precipitation cells had rates between 25 and 40 mm h-1, although in transition areas the precipitation rates were less than 6.5 mm h-1, as it can be observed at 21:00 UTC (Fig. 3b). The core persisted after 19:40 UTC 13 March with rainfall rates less than 16 mm h-1 in northern slopes of Portugal (Fig. 3c).
The UK Met-Office analysis charts on 13 March at 00:00 UTC (Fig. 4a) show a low-pressure region to the west of the IP influencing Portugal where a cyclonic circulation had developed over the Atlantic Ocean. At 12:00 UTC on 13 March (Fig. 4b) the synoptic situation shows the system dissipating although it was still influencing the area. These conditions were favourable for rainfall formation. Observational data from stations of the National Meteorological Institute of Portugal (meteorological bulletin, 2003) confirmed the occurrence of rainfall.
3. Model setup
RAMS is a numerical code initially developed at Colorado State University and Aster Division of Mission Research Inc. as a research model (Pielke et al., 1992). RAMS is a highly versatile numerical code developed for simulating and forecasting meteorological phenomena, in which it is possible to selectively activate several options and parameterizations, according to the nature of the processes being simulated. Areas of interest are characterized starting from the limits in geographical coordinates, grid spacing and the corresponding numbers of gridpoints. Two-way interactive grid nesting allows for a wide range of motion scales to be modeled simultaneously and interactively. A detailed overview discussion of RAMS and these options is given in Pielke et al. (1992), Walko et al. (2000). Cotton et al. (2003) give an overview of the model's current status, focusing on new developments in the RAMS physics and computational algorithms since 1992. The microphysics parametrization (Flatau et al., 1989) used in the explicit cloud simulation describes the physical processes leading to the formation and growth of precipitation particles within a cloud.
The main options used in the simulations in the present study are described below:
• The initial and lateral boundary conditions necessary to drive RAMS were taken from the Brazilian Center of Weather Prediction and Climate Studies (CPTEC) global model forecasts (Bonatti 1996: Cavalcanti et al., 2002) in the form of spectral coefficients with T62 triangular truncation equivalent to 1.825° resolution in the meridional and zonal directions. The analyzed fields include geopotential, temperature, wind (u, v) and relative humidity with 11 isobaric levels and the surface pressure with a time interval of 6 hours (00:00 UTC; 06:00 UTC; 12:00 UTC and 18:00 UTC).
• The simulation elapsed time 87 hours, starting on the 10/03/2002 at 12:00 UTC. Three dimensional grids were used with nesting technique: the coarse grid with 48 x 48 km resolution on a 3840 x 3312 km domain (80 x 69 grid points), the second grid with 12 x 12 km resolution on a 1656 x 1656 km domain (138 x 138 grid points) and an inner grid with 3 x 3 km on a 660 x 660 km (220 x 220 grid points) with all grids centred over the Atlantic Ocean (39.0°N 9.0°W) next to Lisbon.
• For all grids, 32 sigma-z vertical levels were used (Tripoli and Cotton, 1982; Clark and Farley, 1984), with the first level beginning at 100 m above the surface and increasing with a stretching factor from 1.2 to 1000 m, staying fixed up to a rigid top, which is located above the tropopause at 18 km. The time step was taken to be 90 s for grid 1, 30 s for grid 2 and 10 s for grid 3. All domains capture topographic characteristics of the area at the corresponding resolution. These are presented in Figures 5a, b, as well as the location of cities, respectively.
• A modified Kuo-type cumulus parameterization scheme, improved by Tremback (1990) was activated only over the coarser grid in order to allow an explicit convective dynamic reconstruction on the finer grid. The radiation scheme described by Chen and Cotton (1983) was used for long- and short-wave. The full microphysics package of RAMS was activated for grids 2 and 3. The model simulates all phase changes including latent heat. Each category may grow independently from vapor and self collection or may interact with the other categories through collision and coalescence (Flatau et al. 1989). This scheme includes the treatment of condensation of water vapour to cloud when supersaturation occurs as well as the prognostic treatment of rain, graupel, pristine ice and aggregates from Walko et al. (1995).
• For all grids the turbulence and diffusion parameterizations using the Smagorinsky deformation K method with a dependence on the local Richardson number (Tripoli and Cotton, 1986) were activated.
• A soil model developed by McCumber and Pielke (1981) and modified by Tremback and Kessler (1985) was used, considering seven levels assuming uniform saturation moisture for all depths to determine surface temperatures from surface energy balances involving net radiation, turbulent latent and sensible heat flux and soil heat flux.
• Topography, vegetation type, land percentage and sea surface temperature were obtained from the USGS datasets, which have been configured for use in RAMS, according to Mahrer and Pielke (1977). The simulation used silhouette-averaged topography (Bossert, 1990) in order to incorporate the desired terrain effects.
The Convective Available Potential Energy (CAPE) and the amounts of precipitable water (wg) are analyzed from model output data. CAPE (Joules per kilogram of air, J kg-1) exists within the conditionally unstable layer of the troposphere, the free convective layer (FCL), where an ascending air parcel is warmer than the ambient air. CAPE is calculated as Curry and Webster (1999):
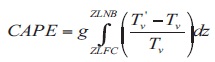
where g is acceleration by gravity, z is height (m), Tv is virtual temperature of the air parcel and Tv is virtual temperature of the environment. CAPE values in pre-thunder conditions range from a few hundreds of Jkg-1 up to thousands of Jkg-1.
The amount of precipitable water (wg), for the second domain (12 km), a parameter that gives the amount of moisture in the troposphere by integration of the specific humidity over each horizontal grid point simulated by RAMS, and the water vapor horizontal flux (Qh), that is the sum of zonal (QÃ) and meridional (Qv ) water vapor flux, were obtained using the following discretised formulae:

and the water vapor horizontal flux is: Qh = Qλ + Qφ
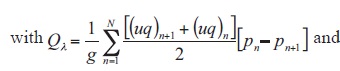

where g is the gravitational acceleration (9.806 m s-2); q is specific humidity between the two vertical pressure levels pn and pn+1; N is the total number of model layers and u and v are zonal and meridional wind components, respectively.
4. Results and discussion
Figure 6 shows the simulated geopotential height and wind (a) and (b) vorticity advection contoured in excess of ±1 x 10⁻⁵ s-1 at 500 hPa for days 11 to 13 March 2002 valid at 12:00 UTC. The geopotential height field and wind (grid 1) shows a predominantly southwesterly flux and is quite smooth with troughs stabilized over Portugal next to the closed center to the west of the Iberian Peninsula providing an extensive cloudiness area, forming a northwest-southeast oriented band spreading over the whole country (see Figs. 2 and 3). Figure 6b shows the positive relative vorticity advection (grid 2) broadly aligned with areas of falling geopotential height corresponding to the location of deep convective systems.
All results and discussion (below) refer to the simulations using 12 km (grid 2) and 3 km (grid 3) resolutions, in order to obtain a better representation of cloud microphysics processes that can be applied to any water phase, including the precipitation process.
The vertically integrated water vapor zonal flux is biased towards low levels of the atmosphere, since water vapour decreases exponentially with altitude. Figure 7a shows that the average transport of water vapor for the period is mostly zonal, and reflects the system performance over the Atlantic Ocean, where the water evaporated from the ocean and is transported towards the land. Such fluxes may lead to an increase of moisture advection at low levels.
The averaged water vapor flux convergence (Fig. 7b) was integrated from surface through the troposphere for whole period in the grid 2. The spatial distribution shows regions of high convergence occurring in the northern part of the country and reveals a very close similarity to that of the observed rainfall accumulation. At the south (Algarve region) the flux convergence is mainly the result of the transient activity where the highest rainfall value was observed on 13 March, when the whole system reached the continent.
The diurnal variation of precipitable water simulated by RAMS (12 km) varies in the early morning and begins to decrease before noon, continue decreasing the afternoon and again increasing in the early hours of the following day. Complex terrain often induces spatial thermal contrasts and local circulations, so that the diurnal variation of water vapor strongly depends on the local topography. Thus, in Penhas Douradas and Bragança shows minimum values that coincide with higher topography areas and the inverse occurs in Faro and Lisbon, cities near coast, with elevated values attributed to the sea breeze (Fig. 8).

Figure 9 represents the CAPE simulated by RAMS at the selected cities for first level model, representing average conditions and directly related to the maximum kinetic energy generated in the updraft. CAPE has non-zero values on the days of occurrence of rainfall over cities. The modeled values, in general, confirm a greater potential for severe weather namely about 1600 J kg-1 (moderately unstable) at the beginning of the event and reached the maximum of 2700 J kg-1 (very unstable atmosphere) on 12 March at 12:00 UTC and decreased during the dissipation phase on 13 March at 00:00 UTC. A high positive value of CAPE alone, even without a triggering mechanism in the form of a synoptic system, can induce convective activity in the atmosphere in the vicinity of the selected cities.
The spatial distribution of the accumulated total rainfall rates (mm h-1) for 11-13 March 2002 is shown in Figure 10 on grid 2 (12 km). The model showed some tendency to predict more precipitation over higher elevations in comparison to flat surfaces during the propagation of the system, but it was able to capture the regional character of the precipitation identified by observations in the cities through the track of radar echoes (Fig. 3). The general pattern is of high precipitation in an extensive area from northwest to southeast over the Portuguese coastline, with rainfall rates higher than 20 mm h-1 at 21:00 UTC on 11 March (Fig. 10a). The next day, moderate precipitation covers the whole region (Fig. 10b). In the dissipation phase, on 13 March at 20:00 UTC, some periods of heavy precipitation occurred in the north with rates higher than 10 mm h-1 (Fig. 10c). A possible explanation for the intensification of precipitation is due to the increased water vapor transport to the region as shown in Fig. 7 and the decreased stability with respect to moist convection.
The 3-hours accumulated rainfall from the high grid resolution (3 km) time series in general agree with the observed data for all cities during the event. In Bragança (Fig. 11a) the simulated curve followed the observed pattern, although it overestimated the amount the resulting correlation coefficient is 0.8. In Lisbon (Fig. 11b) the simulated results underestimated the observed values, but again maintain a correlation of 0.8. For Penhas Douradas (Fig. 11c), the simulation underestimated the observations, but are highly correlated with a correlation coefficient of 0.9. In Faro (Fig. 11d) the simulated rainfall shows the best fit relationship with the observed rainfall with correlation of 0.9.
The RAMS microphysical parameterization for grid 3 (Fig. 12) during the episode showed the presence of the liquid water content reaching heights above 10 km, with an intense core registered during the precipitation period. For all cities, the microphysical simulation produced a good result for the event, characterizing intense convection conditions for the period and captured the heavy precipitation development with a maximum amount of liquid water of about 60 g kg-1 in Bragança, 45 in Faro and about 100 g kg-1 in Lisbon and Penhas Douradas.
5. Conclusions
This study has described the numerical simulation of an event influenced by a depression centered west of the Iberian Peninsula associated with the passage of a cold front, causing heavy rainfall, hail and snow in the central and northern regions of Continental Portugal from 11 to 13 March 2002. The simulation was made using the RAMS. The observed synoptic conditions were favourable for rainfall formation during the episode and the model simulated in a quite reasonable way the synoptic scale system evolution, as well as the wind flow. The rainfall is associated with the warm advection present and seems to be correlated with a cold low which is evident on the surface. The average transport of water vapor for the period was predominantly zonal, leading to an increase of moisture advection at low levels. Since the complex terrain often induces spatial thermal contrasts and local circulations, the diurnal variation of water vapor content depends strongly on the local topography. Faro and Lisbon lying over flat land and situated in the coastal region as compared with Penhas Douradas and Bragança (mountain region and distant from the coastline), are good examples. The values of CAPE indicate an increase in atmospheric instability that favoured the heavy rainfall condition. The spatial distribution of the total accumulated rainfall showed some tendency to predict more precipitation over higher elevations, probably, influenced by dynamical forcing. The presence of supercooled water above 10 km with an intense core during the period led to the hail and snowfall events, principally in the mountain regions. Hence, the simulation using RAMS reproduced the heavy rainfall development over Continental Portugal as well as depicting the synoptic scale and the local circulation pattern.
References
Amorim Ferreira H., 1954b. Caracterização das massas de ar em Portugal. Memórias do Serviço Meteorológico, 35 pp. [ Links ]
Bonatti J. P. 1996. Modelo de circulação geral atmosférico do CPTEC. Boletim de Monitoramento e Análise Climática (CLIMANÁLISE): 10 anos de Edição Especial. [ Links ]
Bossert J. E., 1990. Regional-scale flows in complex terrain: an observational and numerical investigation. Paper N° 472. Department of Atmospheric Science, Colorado State University, CO, USA [ Links ]
Cavalcanti I. F. A., A. Marengo, P. Satyamurty, C. Nobre, I. Trosnikov, J. P. Bonatti, A. O. Manzi, T. Tarasova, L. P. Pezzi, C. D'Almeida, G. Sampaio, C. C. Castro, M. B. Sanches and H. Camargo, 2002. Global climatological features in a simulation using the CPTEC-COLA AGCM. J. Climate 15, 2965-2988. [ Links ]
Chen C., W. R. Cotton, 1987. The physics of the marine stratus cumulus-capped mixed layer. J. Atmos. Sci. 44, 2951-2977. [ Links ]
Chen. C. and W. R. Cotton, 1983. A one-dimensional simulation of the stratocumulus capped mixed layer. Bound.-Layer Meteor. 25, 298-321. [ Links ]
Clark T. L. and R. D. Farley, 1984. Severe downslope windstorm calculations in two and three spatial dimensions using anelastic interative grid nesting. A possible mechanism for gustmess. J. Atmos. Sci. 41, 329-350. [ Links ]
Cotton W. R. and R. Anthes, 1989. Storm and Cloud Dynamics. Academic Press. Inc., CA, USA, 828 pp. [ Links ]
Cotton, W. R., R. A. Pielke, R. L. Walko, G. E. Liston, C. Tremback, H. Jiang, R. Mcanelly, J. Y. Harrigton, M. E. Nicholls, G. G. Carrio and J. P. Mcfadden, 2003. RAMS 2001: Current status and future directions. Meteorol. Atmos. Phys. 82, 5-29. [ Links ]
Curry J. A. and P. J. Webster, 1999. Thermodynamics of Atmospheres and Oceans, Academic Press, CA, USA, 471 pp. [ Links ]
Doswell III C. A., A. E. Brooks and R. A. Maddox, 1996. Flash Flood Forecasting: An Ingredients-Based Methodology. Weather Forecast. 11, 560-581. [ Links ]
Fernández C., M. A. Gaertner, C. Gallardo and M. Castro, 1995. Simulation of a long-lived meso-b scale convective system over the Mediterranean coast of Spain. Part I: Numerical predictability. Meteor. Atmos. Phys. 56, 157-179. [ Links ]
Flatau P. J., G. J. Tripoli, J. Verlinde and W. R. Cotton, 1989. The CSU-RAMS cloud Microphysical Module: General Theory and Code Documentation. Paper N° 51. Department Atmospheric of Science, Colorado State University, 88 pp. [ Links ]
Gómez I., F. Pastor and M. J. Estrela, 2011. Sensitivity of a mesoscale model to different convective parameterization schemes in a heavy rain event. Natural Hazards 11, 343-357. [ Links ]
Harnack R. P., K. Apffel and J. R. Cermack, 1999. Heavy precipitation events in New Jersey: attendant upper air conditions. Weather Forecast. 14, 933-954. [ Links ]
Mahrer Y. and R. A. Pielke, 1997. A numerical study of the airflow over irregular terrain. Beitrage zur Physik der Atmosphare 50, 98-113. [ Links ]
Mariani S., M. Casaioli, C. Accadia, M. C. Llasat, F. Pasi, S. Davolio, M. Elementi, G. Ficca and R. Romero, 2005. A limited area model intercomparison on the "Montserrat-2000" flash-flood event using statistical and deterministic methods. Natural Hazards 5, 565-581. [ Links ]
Mccumber M. C. and R. A. Pielke, 1981. Simulation of the effects of surface fluxes of heat and moisture in a mesoscale numerical model. Part I: Soil layer. J. Geophys. Res. 86, 9929-9938. [ Links ]
Pastor F., I. Gómez and M. J. Estrela, 2010. Numerical study of the October 2007 flash flood in the Valencia region (Eastern Spain): the role of orography. Natural Hazards 10, 1331-1345. [ Links ]
Pielke R. E., W. R. Cotton, R. L. Walko, C. J. Tremback, W. A. Lyons, L. D. Grasso, M. E. Nicholls, M. D. Moran, D. A. Wesley, T. J. Lee and J. H. Copeland, 1992. A Comprehensive Meteorological Modeling System-RAMS. Meteor. Atmos. Phys. 49, 69-91. [ Links ]
Romero R., C. Ramis, S. Alonso, C. A. Doswell III and D. J. Stensrud, 1998. Mesoscale model simulations of three heavy precipitation events in the Western Mediterranean region. Mon. Wea. Rev. 126, 1859-1881. [ Links ]
Smith J. A., M. L. Baeck, M. Steiner, 1996. Catastrophic rainfall from an upslope thunderstorm in the central Appalachians: The Rapidan storm of June 27, 1995. Water Resour. Res. 32, 3099-3113. [ Links ]
Sotillo M. G., C. Ramis, R. Romero, S. Alonso and V. Homar, 2003. Role of orography in the spatial distribution of precipitation over the Spanish Mediterranean zone. Climate Res. 23, 247-261. [ Links ]
Teixeira M. S. and P. Satymurty, 2006. Synoptic scale waves associated with heavy rainfall episodes in southern Brazil. Proceed. of 8 ICSHMO. Foz do Iguaçu, Paraná, Brazil, April. [ Links ]
Tremback C. J., 1990. Numerical simulation of a mesoscale convective complex model development and numerical results. Ph.D. dissertation. Paper N° 465. Department of Atmospheric Sciencie, Colorado State University, CO, USA, 247 pp. [ Links ]
Tremback C. J. and R. Kessler. A surface temperature and moisture parameterization for use in mesoscale numerical models. 7th AMS Conference Numerical Weather Prediction. Montreal, Quebec, Canada, June 1985. [ Links ]
Tripoli G. J. and W. R Cotton, 1982. The Colorado State University three-dimensional cloud mesoscale model, 1982: Part I: General theoretical framework and sensitivity experiments. J. Res. Atmos. 16, 185-220. [ Links ]
Tripoli G. J. and W. R. Cotton, 1986. An intense quasi-steady thunderstorm over mountamous terrain. Part IV: Three-dimensional numerical simulation. J. Atmos. Sci. 43, 896-914. [ Links ]
Walko R. L. and C. J. Tremback, 1991. RAMS-The Regional Atmospheric Modeling System Version 2C: User's guide. Published by ASTeR, Inc., P.O. Box 466, Fort Collins, Colorado, 86 pp. [ Links ]
Walko R. L., W. R. Cotton, M. Meyers and J. Y. Harrington, 1995. New RAMS cloud microphysics parameterization. Part I: the single-moment scheme. Atmos. Res. 38, 29-62. [ Links ]
Walko R. L., L. Band, J. Baron and P. L. Vidale, 2000. Coupled atmosphere-biophysics-hydrology models for environmental modeling. J. Appl. Meteor. 39, 931-944. [ Links ]

