


Serviços Personalizados
Journal
Artigo
 Inglês (pdf)
 Artigo em XML
 Referências do artigo
 Enviar este artigo por email
Indicadores
-
 Citado por SciELO
 -
 Acessos
Links relacionados
-
 Similares em
SciELO
Similares em
SciELO
Compartilhar

 Permalink
Atmósfera
versão impressa ISSN 0187-6236
Atmósfera vol.25 no.2 Ciudad de México Abr. 2012
Weather forecast sensitivity to changes in urban land covers using the WRF model for central Mexico
E. D. López-Espinoza, J. Zavala-Hidalgo
Centro de Ciencias de la Atmósfera, Universidad Nacional Autónoma de México, Circuito Exterior, Ciudad Universitaria, México, D.F. 04510 México
Corresponding author: J. Zavala-Hidalgo; e-mail: jzavala@atmosfera.unam.mx
O. Gómez-Ramos
Instituto de Geofísica, Universidad Nacional Autónoma de México, Circuito Exterior, Ciudad Universitaria, México, D.F. 04510 México
Received April 4, 2011; accepted September 28, 2011
RESUMEN
En este trabajo se estudia el impacto en la temperatura superficial, de 1993 a 2009, debido al crecimiento urbano en el centro de México y la sensibilidad del pronóstico a cambios en la cobertura de suelo con base en simulaciones numéricas de alta resolución. El modelo Weather Research and Forecasting (WRF) emplea datos de cobertura de la tierra global Global Land Cover Characteristics (GLCC) creados a partir de imágenes del satélite NOAA-AVHRR tomadas entre 1992 y 1993. Sin embargo, de 1990 a 2010 la población del país ha crecido en un 29%, lo cual representa un incremento importante en la extensión de las zonas urbanas, particularmente en la parte central de la República, donde en lugares como el Estado de México o Tlaxcala la población ha crecido en un 34% y 33% respectivamente. Debido a lo anterior, con base en el mapa de uso de suelo del 2009 del Instituto Nacional de Estadística y Geografía (INEGI), en este trabajo se actualiza la cobertura urbana en los datos de cobertura de la tierra usados por el modelo WRF para la malla con resolución de 30". A partir de dos simulaciones se hace un análisis de sensibilidad del pronóstico de temperatura para la ciudad de México y su zona conurbada, así como para las ciudades de Puebla y Tlaxcala. Se analizaron ocho sitios en donde el uso de suelo cambió de cobertura vegetal a cobertura urbana y se encontró que la temperatura se incrementó entre 0.5 y 5.0 ºC. El promedio de las diferencias máximas en temperatura a lo largo del ciclo diurno es de 2.61 ºC y el promedio de las diferencias en temperatura a lo largo del periodo es de 0.66 ºC. Las diferencias máximas se registran entre las 10:00 y 15:00 horas (hora local). La temperatura máxima promedio obtenida empleando los nuevos datos de cobertura urbana es de 26.96 ºC, mientras que empleando los datos de cobertura urbana GLCC-1993 es de 25.63 ºC. El incremento promedio de la temperatura máxima diaria es de 1.33 ºC y para la temperatura mínima diaria de 0.12 ºC. La hora en la que se alcanza la temperatura máxima ocurre entre las 13:00 y 15:00 horas, mientras que la temperatura mínima se alcanza entre las 4:00 y 6:00 horas. El rango promedio diario usando nuevos datos urbanos es de 16.0 ºC, mientras que usando datos de GLCC-1993 es de 14.9 ºC. Estos resultados muestran que el cambio de cobertura vegetal a cobertura urbana ha incrementando la temperatura de las cuatro zonas de estudio.
ABSTRACT
The impact on temperature of the urban growth in central Mexico from 1993 to 2009 and the sensitivity of forecast to change in land cover are studied using high resolution numerical simulations. The mesoscale atmospheric Weather Research and Forecasting model (WRF) uses Global Land Cover Characteristics (GLCC) data created from NOAA-AVHRR satellite images from 1992 and 1993. However, from 1990 to 2010 the population of the country grew 29%, which represents an important increase in the extension of urban areas, particularly in the central part of the country, where the population in places like State of Mexico and Tlaxcala has grown around 34 and 33%, respectively. Due to the above, using the 2009 land use map of the Instituto Nacional de Estadística y Geografía (INEGI, by its abbreviation in Spanish), in this study an update of the 30" resolution urban coverage data used by the WRF model is performed. A sensitivity study is carried out for Mexico City and its suburbs, and for the cities of Puebla and Tlaxcala. Eight sites are analyzed where changes from vegetation cover to urban cover occur and temperature increases between 0.5 and 5.0 ºC. The average of the maximum differences in temperature throughout the diurnal cycle is 2.61 ºC and the mean of the differences in the whole period is 0.66 ºC. The maximum difference in temperature is registered between the 10:00 and 15:00 hours (local time). The average maximum temperature using new urban data is 26.96 ºC, whereas using GLCC-1993 urban data is 25.63 ºC. The average increase in daily maximum temperature is 1.33 ºC, and for the daily minimum temperature is 0.12 ºC. The maximum temperature is reached between 13:00 and 15:00 hours, whereas the minimum temperature is reached between 4:00 and 6:00 hours. The mean daily range using new urban data is 16.0 ºC whereas using GLCC-1993 data is 14.9 ºC. Results show that the change from vegetal cover to urban increased the temperature in the study area.
Keywords: WRF, land cover, urban cover, weather forecast, temperature forecast, Mexican Republic.
1. Introduction
The Weather Research and Forecasting model (WRF) (NCAR, 2009) is a mesoscale numerical weather prediction system designed to serve both operational forecasting and atmospheric research purposes. The effort to develop the WRF is a collaborative partnership between research centers, government institutions and United States universities (NCAR, 2009). Static land cover data included in the model to perform the forecast were obtained from the Global Land Cover Characteristics (GLCC) database (Sertel et al., 2009) generated by the United States Geological Survey (USGS). This database defines 24 classes and has been obtained from satellite images taken in 1992 and 1993 (Ran et al., 2010; Chen, 2007).
The exponential growth of the population is one of the various transformations that have occurred in recent years in central Mexico. Between 1990 and 2010 there was a change in the urban development of the country. In 1990 the country recorded a population of 83.97 million inhabitants, and for 2010 there were about 108.40 (CONAPO, 2010). In particular, the states of Puebla, Tlaxcala, Mexico and the Federal District are examples of different growth rates in the country. Figure 1 shows the evolution that occurred in the four states mentioned above, for the period 1990-2010.
The impact of urbanization on climate of cities is well documented in the literature (Oke, 1973; Jáuregui, 2005). As cities grow, the rural-urban thermal contrast increases (Oke, 1973; Jáuregui, 2005; Estrada et al., 2009); the temperature in the city rises compared to rural settings, creating a phenomenon called heat island (Jáuregui, 2005; Estrada et al., 2009). In addition, research on heat island events has concluded that as the cities become bigger, with less green areas, more intense and more frequent is the urban heat island effect (Jáuregui, 2005; Estrada et al., 2009).
Although the WRF model is relatively new, a variety of studies to investigate the performance of the model to changes in land cover has been conducted (Grossman-Clarke et al., 2005; Ran et al., 2010), however this kind of work has not been applied to the case of Central Mexico located at tropical latitudes and at average altitude of 2400 m above mean sea level. Studies using new land cover data collections like IGBP (International Geosphere-Biosphere Programme) based on images taken in 2001, suggest greater accuracy in forecast outputs (Ran et al., 2010). Considering the remarkable growth experienced by the urban land cover since 1993, the rather old GLCC land cover data, and the urban coverage that currently exists, it is expected that weather, specifically temperature, should be modified in the forecast when new urbanization data is used.
Therefore, using the WRF model, this study examines the sensitivity of temperature forecast to changes in urban coverage for a selected group of Mexican locations in the states of Puebla, Tlaxcala, Mexico and the Federal District (Fig. 2), which are representative of the urban population growth in recent decades.

2. Land cover data in the WRF model
Currently, the WRF model version 3.0.1 has GLCC data from USGS as input parameter for land cover. This data is based on images of the NOAA-AVHRR (Advanced Very High Resolution Radiometer) satellite for the period April 1992 to March 1993. Available resolutions in this data collection are 30" (around 1 km), 2' (around 3.7 km), 5' (around 9.25 km), and 10' (around 18.5 km). This dataset defines 24 classes which are presented in Figure 3.
The GLCC land cover of the WRF model is distributed in binary files that specify the static geographical data used by the pre-processing program GEOGRID (NCAR, 2009). The GEOGRID program defines the model domain and interpolates the geographic data mentioned above to the grid defined by the user. The static geographic data sets of land cover interpolated with GEOGRID are stored as 2-dimension (2D) or 3-dimension (3D) arrangements written in a simple binary raster format. To interpret this raster format, the program GEOGRID makes use of the files GEOGRID.TBL and INDEX (NCAR, 2009). 2D arrays are written to a file without a header row by row. In particular, for the resolution of 30", the GLCC land cover is divided into 1200×1200 arrays where each array represents a 10º × 10º subset.
To convert GLCC land cover data into a thematic map format, it is necessary to interpret the binary files from GEOGRID. For Mexico 12 of the 648 binary files defined in the WRF model static data are used. The resulting thematic map is shown in Figure 3.
3. New data of urban locations for Mexico
There is a large difference in the urbanization of central Mexico between the year 1993 and the current urbanization. The population change between 1993 and 2009 (CONAPO, 2009) is shown in Table I. The State of Mexico is the most populated region of the country with around 14 million inhabitants (14% of the national population); it has a total area of 22 357 km2 covering 1.1% of the surface of the country. On the other hand, the Federal District, which is the seat of the Federal Government and is the political and economic center of the country, covers an area of 1 452 km2 representing 0.1% of the surface of Mexico, with a population of eight million. Another region with a large number of people is the state of Puebla; it has a population of more than five million in an area of 34 290 km2. Finally, Tlaxcala has an area of 3 991 km2 representing 0.2% of the surface of the country with a population of about one million.

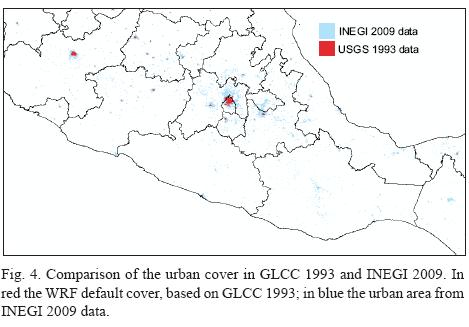
The webpage of the INEGI provides the 2009 municipal geostatistical framework (INEGI, 2009), in which urban locations can be found in shapefile format. The geographic data has a Lambert Conformal Conic projection (CCL) with ITRF92 reference datum. Using this product and comparing it with the urbanization obtained in the GLCC-1993 land cover (default WRF land cover), the difference between the two land cover products is evident (Fig. 4).
4. Configuration of numerical experiments
The model used to perform the simulation for this study was the Advanced Research WRF (ARW) version 3.0.1. The simulation was performed using three nested domains (Fig. 5) covering all of Mexico. The highest resolution domain has a grid of 541 × 371 points and approximately 1 km of horizontal resolution; both land cover data sources for this domain, GLCC-1993 and INEGI-2009, have a resolution of 30".
A 120 hour simulation was performed in forecast mode with hourly outputs beginning July 27, 2010 at 0Z and ending August 1, 2010 at 0Z. This period was chosen since there were no extreme events that could have caused strong winds or precipitation, abdecting the heat island effect. It was a typical period of the second half of July with a high pressure over the Gulf of Mexico and the presence of easterly waves coming from the Caribbean Sea. On July 27, when the numerical simulations begin, there was a high pressure system with center over the western Atlantic Ocean with the maximum pressure located north of the Bahamas and extending into the Gulf of Mexico. On the Mexican coasts of the Gulf of Mexico there were predominant southeasterly winds and the presence of a tropical wave over the Yucatan Peninsula. Another tropical wave was over central Mexico with a weak low pressure associated to it. During the simulation period the wave on the Yucatan Peninsula moved westward during 27, crossing the Bay of Campeche and reaching the middle of the country by July 28 at 0:00Z. A high pressure system also developed over the northeastern Gulf of Mexico which remained there during the rest of the simulated period, with small erratic movements west-southwestward. This high pressure caused the tropical waves to move west-northwestward crossing Mexico.
For the simulations the WRF model configuration uses a Mercator projection, with a time-step of 90 s, 35 vertical levels defined as in Figure 6 and one-way nesting. Schemes used in the model physics are: Kain-Fritsch cumulus parameterization, Thermal Diffusion Scheme as Land Surface Model, RRTM (Rapid Radiative Transfer Model) for longwave radiation, Dudhia for shortwave radiation and Yonsei University (YSU) scheme for the boundary layer (NCAR, 2009). The initial and boundary conditions were taken from the GFS global model, specifically 0Z data, which are available openly (GFS, 2008). An analysis for surface (2 m) temperature and vertical level different temperature is performed here.

5. Results
The numerical simulation was performed mainly to study four regions in central Mexico (Fig. 2). Eight sites were analyzed where there has been a change from vegetation cover to urban cover. The location of each site is shown in Table II and a map with these sites can be seen in Figure 7. Particularly, the two sites discussed for the State of Mexico are on the Naucalpan county. The first site identified as EM1 is part of an urbanized area in INEGI-2009 data and in GLCC-1993 the site is identified as part of a grassland cover. The second site analyzed, EM2, on INEGI-2009 urban cover data is part of a residential area that borders Naucalpan while in GLCC-1993 is part of grassland coverage. The first site in the Federal District, DF1, is located in the northeast limits of the Gustavo A. Madero county. In INEGI-2009 land cover this site is part of a residential area while in GLCC-1993 this site is part of an area covered by trees. The second site, DF2, is located in the Milpa Alta county, south of the Federal District. In INEGI-2009 this site is inside a residential area while in GLCC-1993 the site has grass coverage. Both sites are located at the outskirts of the Federal District, one to the north and the other to the south. The first site analyzed for Puebla, PUE1, is located in the town of Santa Maria Coronango. The site is currently part of an urbanized area while in GLCC-1993 has vegetation coverage. The second site analyzed, PUE2, is located in San Matias Tlalancaleca located at the northwest of Puebla city, now with crop land cover while in GLCC-1993 has grassland coverage. In the state of Tlaxcala the site TLAX1 is located near the road to Nativitas in a region with woodland coverage. In GLCC-1993 data this site has shrub cover. The last site TLAX2 is located in San Pablo del Monte, in southern Tlaxcala inside a farmland cover. In GLCC-1993 data the site has grass coverage.

Table III shows the maximum temperatures recorded in the five days studied period. In general, an average increase is observed in the daily maximum temperature of 1.33 ºC, which occurs between 13:00 and 15:00 hours (local time). Table IV shows the minimum temperatures and for the daily minimum temperature the average increase is 0.12 ºC and this is reached between 4:00 and 7:00 hours (local time). Table V shows the mean range change for each site. The daily temperature range in average using new data is 16.0 ºC whereas using old data is 14.9 ºC. Table VI illustrates the maximum differences in temperature recorded between the two simulations for the five days of simulation for each of the surveyed sites. The difference is obtained by subtracting the temperature field obtained using GLCC-1993 data from the temperature field obtained using INEGI-2009 temperature data. The average of the daily maximum differences in temperature is 2.61 ºC and the average of the differences is 0.66 ºC. The maximum differences in temperature are registered between 10:00 and 15:00 hours (local time).

Figures 8 through 11 show the details of the time evolution of the temperature and the change in the simulation for particular sites. The temperature series evolution using GLCC-1993 and INEGI-2009 urban cover data can be seen in panels b of Figures 8, 9, 10 and 11, for sites EM2, DF2, PUE1a, TLAX1 respectively and the difference between these two temperature series is presented in panels of Figures 8, 9, 10 and 11. In general, the temperature is higher most of the time when the INEGI-2009 urban cover is used. Also, note that the change from soil surface to urban coverage increased the temperature.
Results for the eight sites show a diurnal cycle with greater amplitude and higher maximum temperatures when data from 2009 urban locations is used. Largest temperature differences are observed in the morning, when the temperature is rising (Figures 8-11).
Table VII presents the average differences considering the entire temperature series for each of the eight sites of study. These results show that the temperature increases by more than 0.5 ºC when INEGI-2009 urban cover data is used.

Figure 12 presents hourly maps, from 10:00 to 15:00 hours (local time), of the temperature difference for day four of the simulation. The maps show the evolution of the temperature difference in Mexico City and the State of Mexico. The heat island begins to form around 8:00 hours and begins to fade around 16:00 hours, spreading from east to west. It can be observed that in places where there was already urban coverage (central and northern Mexico City) the temperature is barely affected although these areas are surrounded by those that changed land use. Figure 13 shows the temperature difference at 11:00 hours for each of the five days of the simulation. It can be seen that in most of the new urban areas, included in INEGI-2009 urban cover, temperature tends to be higher. Temperature increase varies from 0.5 to 5 ºC; also it can be observed that the temperature rise is higher in large urban centers compared to rural areas, as shown in Jauregui (2005) the urbanization is producing a heat island which is contributing to climates with higher temperatures.
In Figure 14 the heat island is shown for the 11 hours (local time) for the five-day simulation at different vertical levels. The heat island remains from 30 to 4700 m approximately (or model levels 1-8).
Figures 15 and 16 show the temperature in vertical cross-sections for specific latitudes and longitudes. Here the temperature anomaly is observed up to around 800 m above surface or model level 7.


5.1 Analysis of historical data
A historical data analysis to investigate the trends of the maximum and minimum temperatures for sites with similar land use change to the eight sites previously studied is performed. Figure 17 and Table VIII show the locations of the 15 stations analyzed and the observed period.

The analysis was carried out to study the long-term trends for 15 weather stations distributed in the four study regions, three located in the Federal District, seven in the State of Mexico, two in Puebla and three in Tlaxcala. The analysis considered the monthly averages for the month of July, which is the month of simulation, for maximum and minimum temperature obtained by the Servicio Meteorológico Nacional (SMN, by its abbreviation in Spanish).
We identified time series covering longer periods and the trend was estimated considering only the records that contain data from 31 days of July. In order to calculate the trends, we used the method of least squares and the uncertainty of the slope was calculated at 95% confidence (Zavala-Hidalgo et al., 2010). The trend, i.e. the average increase per month is calculated by the following equation:

where xi are the dates on which there are observations, yi the observations,  and
and  are the average of xi and yi, respectively.
The uncertainty in the slope was calculated as the product of the standard error (SE) and the critical value (CV) obtained from the t-Student distribution with n-2 degrees of freedom, where n is the number of observations:

where  are the values estimated from the straight-line fit by method of least squares.
The analysis of trends for minimum and maximum temperature for the different stations is shown in Figures 18-21. (19, 20)In these figures the monthly average for July by year is indicated by black dots and red line, the maximum temperature for the 31 days of each July is shown in blue line and the estimated trend is shown in thick black lines. Table IX summarizes the trends for maximum and minimum temperatures for the 15 stations analyzed.

It is noteworthy that the stations analyzed have a positive trend in maximum temperature while in minimum temperature positive and negative trends are obtained, but there are more frequent negative trends.
Results show for maximum temperature a lower positive trend in the station 15020 with 0.004 ± 0.027 ºC year-1 and the largest positive trend in the station 15126 with 0.090 ± 0.028 ºC year-1, both in the State of Mexico. Four stations have negative trends (9038, 15049, 15089, 29011); the trend in stations, 9038 and 15049 is –0.001 ºC year-1, that is smaller than the negative trends in stations 15089 and 29011. For minimum temperature the trends are between –0.078 ± 0.022 ºC year-1 and 0.034 ± 0.021 ºC year-1.
The average trend for maximum temperature is 0.03 ºC year-1 and 0.0 ºC year-1 for minimum temperature. These trends, with more increase in the maximum than in the minimum temperatures are consistent with the simulations results. Moreover, Englehart and Douglas (2005) showed for Mexico that the trend of diurnal range in surface temperatures (DTR = maximum – minimum temperature) is significantly positive and therefore the daily maximum temperature increase faster than the daily minimum temperature. One possible explanation given is that regional land use and land cover changes are identified as potential forcing mechanisms responsible for at least part of the observed DTR behavior.
6. Conclusions
Land cover in the central part of Mexico had considerable changes in a relatively short time, extending the urban areas and causing a temperature increase. Based on simulations using the WRF model with a new urban cover data, it is shown that regions that changed their vegetation cover into urban areas have higher temperatures with a larger diurnal temperature range and maximum temperature. Specifically, for four entities in the center of the country: State of Mexico, Federal District, Puebla and Tlaxcala, the temperature rises between 0.5 and 5 ºC in urban areas. Also the average temperature increase of a set of sites is larger for the daily maximum temperature (1.33 ºC) than for the daily minimum temperature (0.12 ºC).
In particular the heat island in Mexico City and the State of Mexico is formed with temperature anomalies that extend approximately 800 m from the surface.
In addition, the results of the analysis of historical data show generally increasing trends in maximum temperature between 0.004 ± 0.027 ºC year-1 and 0.090 ± 0.028 ºC year-1, while the minimum temperature trends are both positive and negative, but there are more frequent negative trends. The average trend for the maximum temperature is 0.03 ºC year-1, while that for the minimum temperature is 0.0 ºC year-1.
The WRF model has different options for Land Surface Models (LSM) like the Simple Soil Thermal Diffusion, the NOAH scheme, and the Rapid Update Cycle. Previous studies have shown that processes at the surface of the earth greatly affect the temperature forecast (Jin et al., 2010). Future work should study such schemes on simulations in forecast mode combined with the new land cover product in the central part of Mexico, in order to improve model performance.
Acknowledgments
This research was supported by a postdoctoral grant from the Universidad Nacional Autónoma de México. The first author wishes to thank Elena Osorio-Tai (CCA-UNAM) for his technical assistance.
References
Chen F., 2007. The Noah Land Surface Model in WRF: A short tutorial. NCAR, LSM group meeting, 30 pp.[Available at: http://www.atmos.illinois.edu/~snesbitt/ATMS597R/notes/noahLSM-tutorial.pdf]. Date 19-03-2012. [ Links ]
CONAPO, 2011. Indicadores Demográficos Básicos 1990-2030. Consejo Nacional de Población. [http://www.conapo.gob.mx/index.php?option=com_content&view=article&id=125&Itemid=193]. Date 19-03-2012. [ Links ]
Englehart, P. J., and A. V. Douglas, 2005. Changing behavior in the diurnal range of surface air temperatures over Mexico, Geophys. Res. Lett. 32, L01701, doi:10.1029/2004GL021139. [ Links ]
Estrada F., A. Martínez-Arroyo, A. Fernández-Eguiarte, E. Luyando and C. Gay, 2009. Defining climate zones in México using multivariate analysis. Atmósfera 22, 175-193. [ Links ]
GFS, 2011. Global Forecast System, NOAA. [ftp://ftpprd.ncep.noaa.gov/pub/data/nccf/com/gfs/prod/]. Date 19-03-2012. [ Links ]
Grossman-Clarke S., J. A. Zehnder, W. Stefanov and M. Moeller, 2005. Remote sensing derived land use/cover data for urban modeling in MM5 and WRF. WRF Land Surface Modeling Workshop. PowerPoint PPT presentation. Boulder, CO, USA. [http://www.ral.ucar.edu/research/land/technology/wrf/workshop_2005/LSMBoulder2005a.ppt]. Date 19-03-2012. [ Links ]
INEGI, 2009. Marco Geoestadístico Municipal (versión 4.1). Instituto Nacional de Estadística y Geografía. [http://www.inegi.org.mx/default.aspx]. Date 19-03-2012. [ Links ]
Jáuregui E., 2005. Possible impact of urbanization on the thermal climate of some large cities in México. Atmósfera 18, 249-252. [ Links ]
Jin J., N. L. Miller and N. Schlegel, 2010. Sensitivity study of four land surface schemes in the WRF model. Advances in Meteorology, Article ID 167436, doi:10.1155/2010/167436. 11 pp. [ Links ]
NCAR, 2009. Mesoscale and Microscale Metereology Division. Weather Research and Forecasting ARW: Modelling Systems User's Guide (version 3). National Center for Atmospheric Research, Boulder, 280 pp. [ Links ]
Oke T. R., 1973. City size and urban heat island. Atmos. Environ. 7, 769-779. [ Links ]
Ran L., J. E. Pleim and R. C. Gilliam, 2010. Impact of high resolution land-use data in meteorology and air quality modeling systems. Chapter 1, (G. Douw Steyn and S. Trivikrama Rao, Eds.). Air Pollution Modeling and its Applications XX. Springer Netherlands, Netherlands, C (Section 1.1), 3-7. [ Links ]
Sertel E., A. Robock. and C. Ormeci, 2009. Impacts of land cover data quality on regional climate simulations, Int. J. Climatol. DOI: 10.1002/joc.2036. [ Links ]
Zavala-Hidalgo J., R. de Buen Kalman, R. Romero-Centeno and F. Hernández Maguey, 2010, Tendencias del nivel del mar en las costas mexicanas. In: Vulnerabilidad de las zonas costeras mexicanas ante el cambio climático. (A. V. Botello, S. Villanueva, J. Gutiérrez and J. L. Rojas Galaviz, Eds.). Semarnat-INE, UNAM-ICMyL, Universidad Autónoma de Campeche. Ciudad de Campeche, 249-267. [ Links ]

