


Services on Demand
Journal
Article
 English (pdf)
 Article in xml format
 Article references
 Send this article by e-mail
Indicators
-
 Cited by SciELO
 -
 Access statistics
Related links
-
 Similars in
SciELO
Similars in
SciELO
Share

 Permalink
Atmósfera
Print version ISSN 0187-6236
Atmósfera vol.24 n.4 Ciudad de México Oct. 2011
Verification of an algorithm (DWSR 2500C) for hail detection
M. PARASCHIVESCU
National Meteorological Administration, Sos. Bucuresti-Ploiesti 97, 013686 Bucharest, Romania Corresponding author: E-mail: mihneap@gmail.com
S. STEFAN
University of Bucharest, Faculty of Physics, P. O. BoxMG-11, Magurele, Bucharest, Romania
M. BOGDAN
National Meteorological Administration, Sos. Bucuresti-Ploiesti 97, 013686, Bucharest, Romania
Received July 13, 2010; accepted March 23, 2011
RESUMEN
El objetivo de este trabajo es determinar los criterios de advertencia y pronóstico en tiempo real para eventos de granizo utilizando los productos altura de reflectividad máxima (Hmax), agua líquida integrada verticalmente (VIL), probabilidad de ocurrencia de granizo (HailP) y reflectividad de radar (PPIZ). Adicionalmente, se buscaron criterios para estimar el tamaño de las partículas de granizo. El estudio se basa en los datos proporcionados por el radar climatológico de banda C de Bucarest y en los datos de observaciones del período 2001-2008. Para cada evento de granizo reportado por una estación se determinaron los siguientes productos del radar (por sus siglas en inglés): HailP, Hmax, PPIZ y VIL. Se analizaron 320 casos en los que se determinó granizo por 20 estaciones en el área de Muntenia, Rumania. Un resultado relacionado es que en los casos cuando la isoterma de 0 °C está entre 3000 y 4000 m, la frecuencia de eventos certificados con granizo en el suelo es de 50%. Otra conclusión es que si la reflexividad máxima aparece entre 7000 y 8000 m hay una posibilidad del 20% de que haya eventos de granizo. Se calcularon HailP, Hmax, PPIZ y VIL para las localidades exactas donde se reportó granizo y para una área de 5 km alrededor de dichas localidades. El análisis realizado mostró que ambos conjuntos de datos pueden utilizarse con confianza. Se realizó una comparación, para el año 2008, entre los valores de HailP del sondeo vertical de Bucarest y los extraídos del modelo Aladin utilizando los parámetros requeridos. Los resultados muestran una sobreestimación de la probabilidad de ocurrencia de granizo (HailP) cuando se utiliza el modelo Aladin.
ABSTRACT
The aim of this paper is to determine the real-time forecast and warning critera for hail events, using height of maximum reflectivity (Hmax), vertically integrated liquid water (VIL), hail occurrence probability (HailP) and reflectivity radar products (PPIZ). In addition, criteria were sought for use in estimating the size of hail stones. The study is based on data supplied by the Bucharest C-band weather radar along with observation data during the 2001-2008 period. The following radar products: HailP, Hmax, (PPIZ) and VIL, have been determined for each hail event reported by the weather station. A number of 320 cases have been analyzed when hail was determined for 20 weather stations in Muntenia area, Romania. One related result is that in situations when the 0 °C isotherm is between 3000 and 4000 m, the frequency of hail events certified on the ground is 50%. Another conclusion is that if the maximum reflectivity appears at heights between 7000 and 8000 m, there is an approximately 20% chance of hail events. The HailP, Hmax, Reflectivity and VIL were computed both for the exact locations where hail was reported and for an area of 5 km around those locations. The performed analysis showed that both obtained data sets can be used with confidence. A comparison was performed regarding the year 2008 between the values of HailP from the Bucharest vertical sounding and those extracted from the Aladin model, using its requested parameters. The results show an overestimate of the hail occurrence probability (HailP) when the Aladin model was used.
Keywords: hail, size of hail, radar products, C-band weather radar, Aladin model.
1. Introduction
Hail events are among the most severe weather phenomena, with disastrous effects, especially in agriculture. Therefore, their study and forecast are being of major preoccupation in Romania, with crucially important economical effects. The Romanian Doppler radar network of the National Meteorological Administration (NMA) is a part of the integrated meteorological system (SIMIN), unique in Europe (Ioana etal., 2004). Romanian National Doppler Weather Radar Network consists of eight radars ( five radars- S band and three- C band). For this study a C band radar was used whose type of volume coverage pattern varies between 0.5-22°. Radar products resolution is 1 x 1km.
At the National Administration of Meteorology, Bucharest, Romania, research concentrated on convection mechanism and on the hail occurence conditions (Antonescu, 2006), as well as on the peculiarities distribution of the hail events over the Romanian territory (Pop, 1964).
Currently, a tool for the detection and display of severe weather phenomena related to convective systems, like wind gusts and summer hail (Sánchez et al., 1995) uses radar reflectivity and Doppler winds which are the primary source of information, complemented with other observations and data from numerical weather prediction (NWP) models (Holleman et al., 2000).
The main purpose of radar-based remote sensing of hailstorms is the identification of the dynamical structure of hail cells and the assessment of storm cell propagation modes (Lemon, 1978). Radars provide near-ground information of hailfalls and much research has been done, both to identify hail in thunderstorms and quantify intensities of hailfall (Hohl, 2001). An overview of radar-based identification of meteorological targets and operating principles of different types of radars is given in Rinehart (1978) and Atlas etal. (1990). Doppler radars provide additional information on the phase, comparing the change in phases of the transmitted and received signals to determine the Doppler frequency shift (motion of particle towards or away from the radar).
An enhanced hail detection algorithm has been developed at the National Severe Storms Laboratory (NSSL, USA) and replaces now the original algorithm (Kessinger et al., 1995; Witt et al., 1998). The new algorithm estimates the probability of hail (any size), probability of severe-size hail (diameter > 19 mm), and maximum expected hail size for each detected storm cell. The detection of hail of any size is based on the criterion proposed by Waldvogel and Grimm (1979). The probability of hail is derived from the difference between the maximum height at which a reflectivity of 45 dBZ is observed (HZ45) and the height of the freezing level (HT0) (Mather et al., 1976). When the height difference is larger than 1.4 km, a positive indication of hail exists. The probability of hail increases with the height difference (Foote and Knight, 1979).
A preliminary condition for the development of hail is a strong updraft that supports growing hailstones (Edwards and Thompson, 1997). Updraft velocities are mainly influenced by the convective available potential energy (CAPE): the greater the CAPE, the higher the potential for large hail to develop in a thunderstorm (Emanuel, 1994).
The microphysical processes responsible for hail development are not yet completely understood. Ice particles may form in a cloud if the temperature drops below zero. At temperatures below 0 °C, the coexistence of supercooled water drops and ice particles is an important factor for the development of hail stones (Klaassen, 1988). Three different mechanisms are responsible for the growth of ice particles: The first mechanism is the collision and aggregation of ice particles. The second mechanism is the deposition, i.e. water vapor diffusion to the ice particles. The last mechanism is the riming, i.e. the collection and freezing of water droplets colliding with ice particles (Delobbe etal., 2003).
The hail forecast cannot be elaborated using only a statistical model that provides solely mathematical probabilities (Thomson, 1998). More complex related knowledge is required, namely knowing the current meteorological situation, obtaining additional information from other radar products (Billet et al., 1997), as well as knowing the geographic and climatic peculiarities of the area in question (Bordei Ion, 2008). Moreover, none of the products VIL, CAPE, melting level or various combinations of them should be used specifically as an instrument for forecasting hail occurrences until local or regional detection methods have been adapted to the various regions of the country (Lemon, 1998).
The present paper reports criteria for estimating hail events using radar products: height of the maximum reflectivity (Hmia), vertically integrated liquid water (VIL), hail probability (HailP), radar reflectivity (PPIZ), 0 °C isotherm height and hail stones sizes. In Section 2 we describe the radar products used in the study. Section 3 presents the database and the methods. Results obtained during the eight years over which the hail events and the hail stones size have been analyzed are presented and discussed in Section 4. The main hail forecasting criteria are finally summarized in the Conclusions section.
2. Description of the used radar products
The vertically integrated liquid water (VIL) is an indicator of the severity of a storm cell which was introduced by Greene and Clark (1972). Reflectivity values can be converted to liquid water contents using a semi-empirical relationship similar to the Z-R relationship used for the conversion of reflectivities to precipitation rates (Boudevillain and Andrieu, 2003).
The upper and lower limits of the altitude against the mean sea level (msl) can be defined by the user, so that VIL can be computed for a certain layer of the atmosphere (Greene and Clark, 1972). The computed liquid water amount assumes that the drops of water within the cloud fall on the surface (Amburn and Wolf, 1997).
The first step in the calculation of VIL is to convert all refectivities to liquid water content (M) using the semi-empirical relation between M in g/m3 and Z in mm6/m3(Roeseler and Wood, 1997):

Subsequently, the obtained liquid water content at each location is integrated vertically:

where the VIL is expressed in kg/m2 or in mm of potential rainfall and the height in km (Holleman, 2001).
Discrimnating between thunderstorms with and without hail using VIL only is however not straightforward since there is a large variability in the VIL threshold associated with the presence of hail.
The relationship between PPIZ and the rain intensity (R) is given by the Marshall-Palmer distribution: Z = aRb (Pruppacher and Klett, 1997). The values of the parameters used by WSR-98D in the case of convective precipitation are: a = 300 and b = 1.4. The liquid water content (W) is computed through the following Z-W relationship: W = A x Zb. The parameters values for VIL are: A = 3.44 x 10~6 and b = 0.57 (Doppler Radar Meteorological Observations, 2006).
One of the most common products is the radar reflectivity PPIZ (Auer, 1994). In a simple description, radar reflectivity represents a measure of the energy reflected by targets and received by the weather radar. If there are no targets in the atmosphere, no fraction of the energy amount is reflected back (absence of radar echo). The higher the value of the Z (dBZ) reflectivity, the greater the amount of energy reflected and received by the radar (Auer, 1994).
The HailP product (Mervin et al., 1987) uses VIL measurements as determined by the radar. The user must also insert the local atmospheric vertical sounding data (height of the 0 °C isotherm, wind speed at 500 hPa and mean relative moisture between 0 and 500 hPa) (Petrocchi, 1982). Results obtained in the operational practice clearly show that this radar product is a very useful tool(Lenning etal., 1998).
The hail probability is calculated from the following equation:

Where Prob it is the hail probability (%); MaxVIL is maximum value for the VIL (kg/m2); MLTLVL is the height of the 0 °C isotherm (m); U500 is wind speed at 500hPa (m/s); RH relative moisture between 0 and 500 hPa (%).
Another product, Hmax (highest maximum intensity) provides an estimate of the hight of the maximum intensity observed above each point on the surface for the selected moment (Ananova et al., 2007). This product can be used to assess the development stage of convective clouds (Tuomi et al., 2008). It can also be used to identify and localize the freezing level in stratiform precipitations where the maximum reflectivity coincides with the melting level ("bright band") (Klaassen, 1988; Balakrishan et al., 1989). Associated with Hmax is Cmax -the column maxima product that provides an estimates of the maximum echo observed above each point on the ground for the selected moment.
3. Data and methods
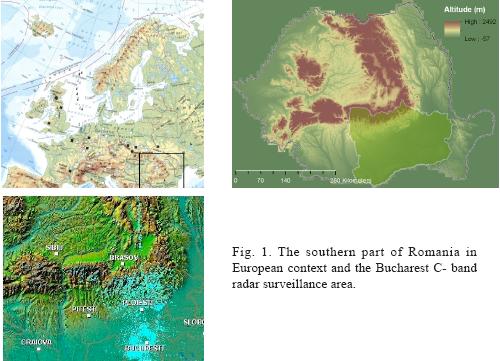
A study of the hail events observed between 2001 and 2008, in the area covered by the Bucharest C radar (Muntenia region) which is 150 km in radius, is presented. Noteworthy, the radar data acquired from distances of up to 150 km are comparable to data supplied by rain gauges, since the errors induced by the Earth's curvature are not very important. It is generally considered that the reliable distance is about 100 km around the radar.
All hail events occurred during each year between 2001 and 2008 have been taken into account, irrespective of the place where those events have been noticed (320 cases in 142 localities). The 2001 -2008 period was built from observational data recorded. For all observed cases, the Reflectivity, VIL, Hmax and HailP products have been constructed; for the latter one there were used in addition the upper air data concerning moisture, 500 hPa wind speed and height of the 0 °C isotherm, from the database of the Aerology laboratory within the National Meteorological Administration.
In order to construct these products, second level radar data have been used, i.e. raw data that were corrected through processing after the acquisition. Corrections referred to the bright band and to the square of the distance from radar to target (Klaassen, 1988).
The present article considered that: (i) the reference time for the hail occurrence is the beginning moment, and the duration of the phenomenon is the one stated by the warning and (ii) the analyzed radar data have a 10-min step, being those extracted from the raw data volume within the time interval of ± 20 minutes centered on the occurrence moment, as stated by the warning. It is well known that there are differences between the spatial resolution of the radar data (approximately 1 km) and the precision (sometimes of 1 or even 2 arcminutes, i.e. approximately 4 km) with which the weather stations are localized. It is also a fact that, because of the evolution and motion of the convective cells, hail may occur between two successive observations. Given these two evidences, the values of HailP, VIL and Hmax have been analyzed for a reference station and within a circular area of 5 km in radius around it.
Regarding the data extracted from the Aladin model (http://www.cnrm.meteo.fr/aladin/), the parameters have been computed from the location where hail fell on the ground. In other words, the geographic coordinates were determined for each location where hail occurred and the Aladin model was used to produce, for those coordinates, the upper air moisture data (computed as a weighted average between the ground and the 500hPa levels, respectively), the wind speed at 500 hPa and the height of the 0 °C isotherm.
There are limitations both concerning the radar observation and the warning message issued by the observer. The most frequent errors occur from the lack of precision in determining, from the warning message, the starting moment of hail falling and its duration. Many messages are incomplete regarding the items "phenomenon duration" and "beginning moment". The same can be said about the estimation of hail stone sizes. Due to the high technical performance of the existing sensing technology, no significant errors can be attributable to the equipment operation. Precision improvement in this last respect would require a measurement every 3 or 5 minutes at most (NOAA, 1991). With an observation every 10 minutes, there will be enough cases when the various stages of the hail process are placed between two successive samplings.
4. Results
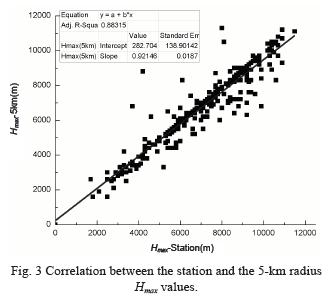
Each case of hail occurrence at the weather stations within the area covered by the C band radar was considered (Fig. 1). Also, as seen in Table I, the frequency of the hail events is particularly variable. Moreover, it can be observed that the year 2001 yielded the highest number of hail events.
The HailP, Hmax, VIL and Z radar products were computed for all the hail events observed at the 142 weather stations in order to determine criteria usable to estimate the hail events and the size of the hail stones. The radar products were also determined for a circular area of 5 km in radius around the considered hydrological stations, rain gauges and weather stations, for the situations when hail occurs between the stations and is not reported by the observers.
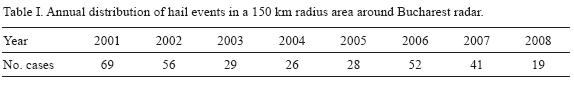
4.1 Correlation between values of products at the station and those within the 5 km-area
Figures 2, 3, 4 and 5 render the correlation between the HailP, Hmax, Z and VIL products, obtained for all the stations within the analyzed period and for the 5 km-area around the stations. As regards the VIL product, the correlation coefficient for the station and the 5 km-radius values exceeds 90%. The poorest correlation was obtained for the HailP product (44%).
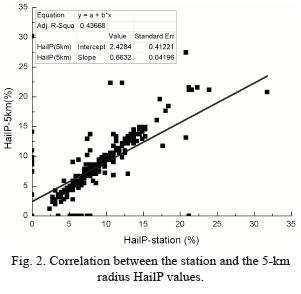
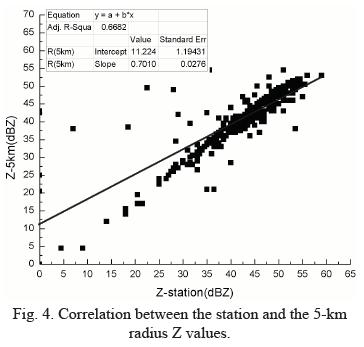
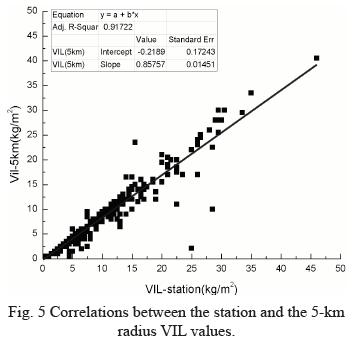
The good correlation between the radar product values at the stations and within the surrounding areas, respectively, allows forecasting hail occurrence in those areas, by taking into account the radar product values, especially VIL.
4.2 Correlation between radar products and hail falling on the ground
The distribution of the hail events observed at the station and in the 5km-area allowed us to infer criteria for estimating the chances of hail events through the values of radar products.
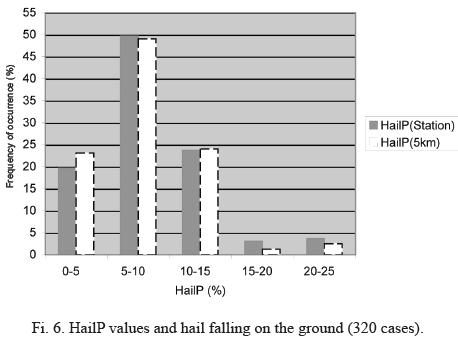
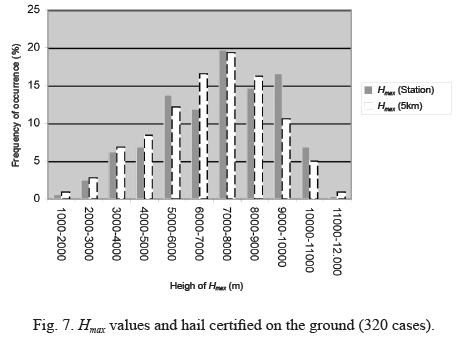
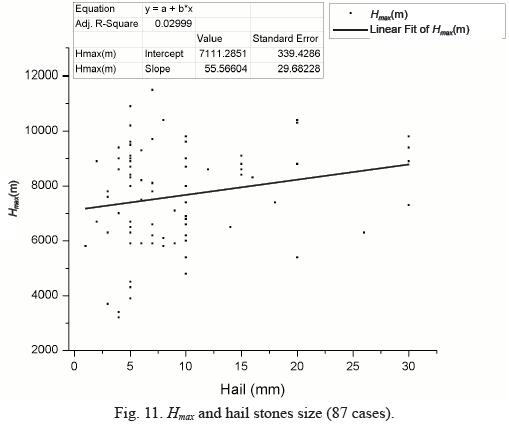
For the obtained HailP, Hmax and VIL radar products, for both the stations and their surrounding areas and also for the height of the 0 °C isotherm, the percent of the hail events was determined (Figs. 6, 7, 8 and 9). In the case of the HailP product, the most numerous cases of hail falling on the ground were reported in the 5-10% probability interval. Figure 6 allows extracting a criterion for estimating the hail events, although the frequency of hail certified on the ground was very small. For values of the Hmax (m), i.e. the height where the reflectivity is maximum, ranging from 7000 to 8000 m, the maximum observed value was 19%. The distribution of the hail events following the height of the maximum reflectivity is Gaussian, translated towards high values by 1000 m (Fig. 7).
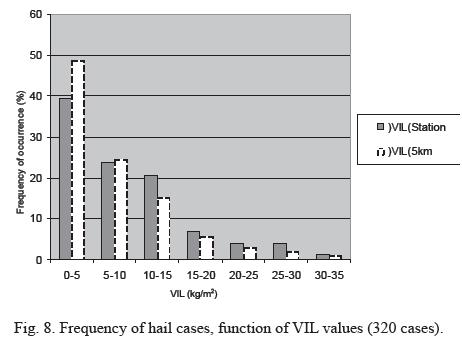
Another criterion may be materialized through VIL. The highest percent of observed hail occurrences is 40 at the stations and 48 for the areas surrounding them for the VIL values in the range 0-5 kg/m2. The percentage decrease of the hail events is exponential when the interval of the VIL values increases (Fig. 8).
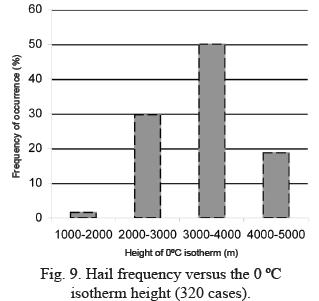
As regards the height of the 0 °C isotherm, the importance of the 3000-4000 m interval is noticeable, with a 50% of the observed hail events (Fig. 9).
4.3 Determination of criteria regarding hail stones sizes
In many cases with hail observed at the weather stations, the size of the hail stones reachs even 5 cm in diameter. For the forecasters it is interesting to know if the use of the radar products can estimate not only if hail should fall or not, but also the size it may have. Figs. 10, 11, 12 and 13 show the connection between the sizes of the hail stones and the radar products to which the 0 °C isotherm height is added. The study was based on 87 cases of hail certified on the ground.
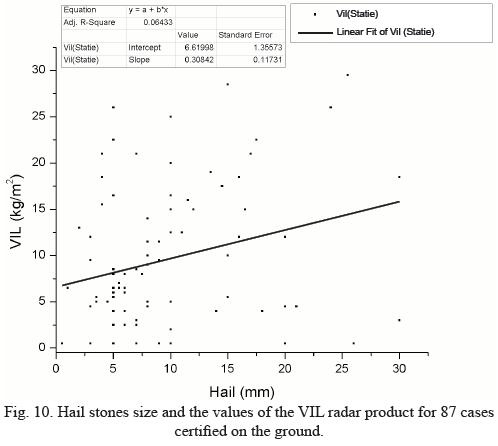
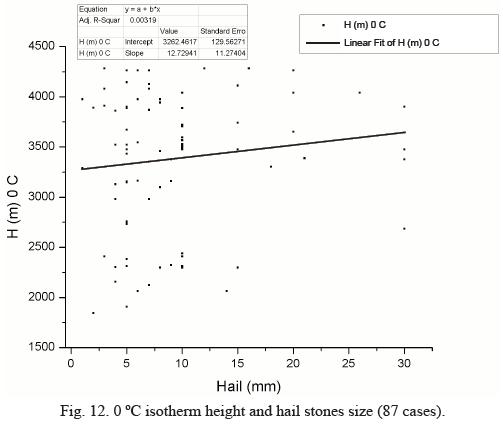
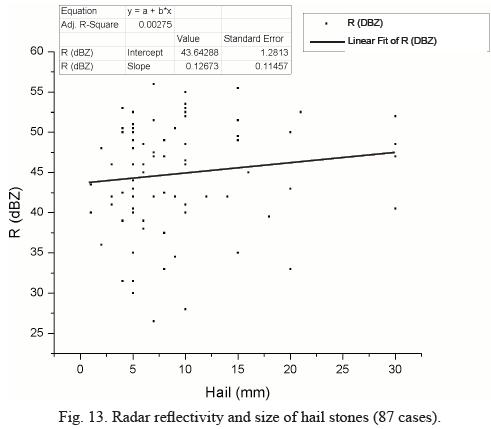
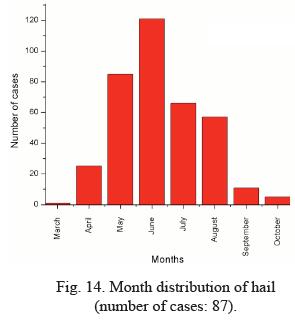
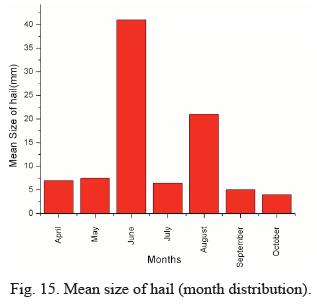
Unfortunately, the correlation between the size of the hail stones and the radar product is very poor (i. e. for VIL, R = 0.064). This proves that one single product is unable to estimate the hail stones size although it does show the total water amount. Radar reflectivity is the most important related parameter (Fig. 13). The monthly distribution of hail is illustrated in Figure 14 and mean size of hail is illustrated in Figure 15. Figures 14 and 15 show that in June occurs most of the cases of hail and the average size of the hail stones increases in June, too.
In the verification process, i.e., the comparison between the outcomes of the hail detection method and the verification data, the hail events will be classified using a 2-by-2 contingency table (Table II). Hail detected by a radar-based method which is confirmed by the verification data will be classifed as a hit (H), hail detected by a radar-based method which is not confirmed by verification data as a false alarm (F), hail observations or reports in the verification data that are not detected by the radar-based method as a miss (M), and no event at all as a non-event (N). These four classes can be shown schematically in the 2-by-2 contingency table:
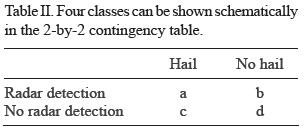
The Probability of Detection (POD), the False Alarm Ratio (FAR), the Critical Success Index (CSI), and the bias are defined as:
The probability of detection and the false alarm ratio always have to be used together to characterize the result of a verification, where the method with a high POD and a low FAR is preferred, while the critical success index characterizes the verification result in a single number, where the method with the highest CSI is preferred. The bias is the ratio between the number of detections or forecasts and the number of actual occurrences. A method that detects or predicts events with a too high (low) frequency has a bias greater (smaller) than one, and a method with a bias of one has no bias. The POD, FAR, and/or CSI are often used to characterize the performance of hail detection methods. A more elaborate discussion on the behavior of these and other verification scores can be found elsewhere (Doswell etal., 1990; Kok, 2000).
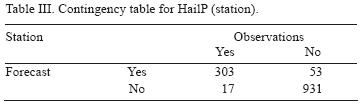
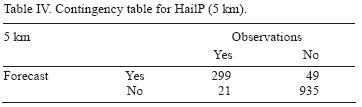
The following data were obtained for HailP (Table III and Table IV): POD = 0.9468(st); POD = 0.9469(5 km); FAR = 0.1501(st); FAR= 0.1408(5 km); Bias = 1.11(st); Bias =1.08(5 km); CSI = 0.8123(st); CSI = 0.8102(5 km).
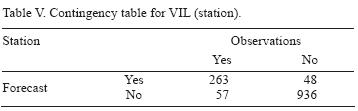
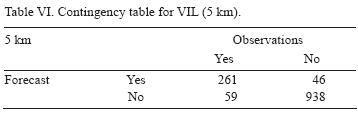
The following data were obtained for VIL (Table V and Table VI): POD = 0.8218(st); POD = 0.8156(5 km); FAR = 0.1543(st); FAR = 0.1498 (5 km); Bias = 0.9718 (st); Bias = 0.9593 (5 km); CSI = 0.7146(st); CSI = 0.7131(5 km).
4.4 HailP computed from radiosounding data sampled at Bucharest and from the Aladin model
The probability that hail forms and falls on the ground, HailP, was computed in two ways, using data from the Aladin model and data from the Bucharest vertical sounding, for the occurrences of the 2008 summer (19 cases). Such intercomparison allows validating the HailP product (Fig. 16).
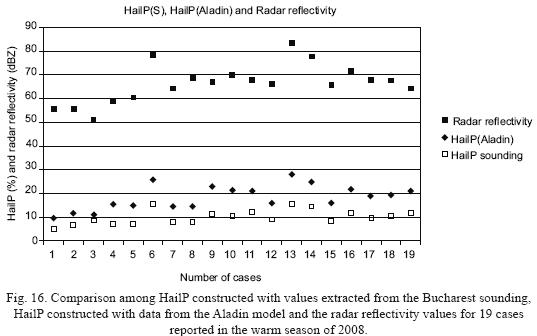
A rather good correlation is noticed in principle between the two ways of computing the hail probability (HailP). However, the scarcity of the number of cases (19) for which the comparison was performed must not be disregarded. It can also be noticed that the radar reflectivity values are those that drive the behaviour of the HailP product, irrespective of how this one is computed.
5. Conclusions
The study spans over an 8-year period and the total number of situations with hail certified on the ground is 320 cases. Results and conclusions are therefore preliminary and the study will further be elaborated thoroughly, as the data series becomes longer.
Results obtained both at the station and in the 5 km-area allow the use with a fair amount of certitude of the values for HailP, Hmax, VIL and Reflectivity for forecasting hail occurrence in any of the two areas.
For Hmax values ranging from 7000 to 8000 m, there are around 20% hail events (at the stations), whereas for Hmax ranging from 6000 to 9000 m, there are 46.23% events (at the stations) and 52.18% (in the 5 km-area).
For values of the height of the 0 °C isotherm ranging within 3000-4000 m, there are 50% hail events certified on the ground.
A 5% threshold for HailP can be considered as a cautious threshold by the forecaster. HailP values ranging in the interval 5-15% cover 73.43% of the total hail events. VIL values ranging within 0-5kg/m2 certify a 39.55% hail presence on the ground. For higher values of the VIL product, a percentage decrease of the hail events is noticed.
Regarding the comparison between the HailP values obtained by using the necessary parameters both from the Bucharest vertical sounding and those extracted from the Aladin model, a good correlation is observed, in principle, between the two ways of computing the hail probability. However, further research will be completed in order to performe this comparison on an increased number of cases.
References
Aladin, 2008. Aire Limitee Adaptation Dynamique Developpement InterNational: http://www.cnrm.meteo.fr/aladin/, 03.10.2008. [ Links ]
Amburn S. A. and P. L. Wolf, 1997. VIL density as a hail indicator. Weather Forecast. 12, 473-478. [ Links ]
Ananova L. G., V. P. Gorbatenko and I. A. Lukovskaya, 2007. Radar characteristics of convective clouds during squalls in the southeastern part of western Siberia. Russ. Meteorol. Hydrol. 32, 449-452. [ Links ]
Antonescu B., C. Oprea, A.Tanase and A. Stan-Sion, 2006. A forecasting and monitoring method for convective events in Romania. Proceedings of the Fourth European Conference on Radar in Meteorology and Hidrology, Barcelona, Spain, 18-22. [ Links ]
Atlas D., D. Rosenfeld and D. Short, 1990. The estimation of convective rainfall by area integrals 1. The theoretical and empirical basis. J. Geophys. Res. 95(D3), 2153-2160. [ Links ]
Auer Jr., A. H., 1994. Hail recognition through the combined use of radar reflectivity and cloud-top temperatures. Mon. Wea. Rev. 122, 2218-2221. [ Links ]
Balakrishan N. and D. S. Zrnic, 1989. Estimation of rain and hail rates in mixed phase precipitation. J. Atmos. Sci. 47, 565-583. [ Links ]
Billet J., M. DeLisi and B. G. Smith, 1997. Use of regression techniques to predict hail size and the probability of large hail. Weather Forecast. 12, 154-164. [ Links ]
Bordei Ion N., 2008. Meteoclimate phenomena induced by the Carpathians mountains configurations in the Romanian Plain (in Romanian), Romanian Academy, 238 pp. [ Links ]
Boudevillain B. and H. Andrieu, 2003. Assessment of Vertically Integrated Liquid (VIL) water content radar measurement. J. Atmos. Oceanic Technol. 12, 404-409. [ Links ]
Delobbe L., D. Dehenauw, K. Hamid and J. Neméghaire, 2003. Hail detection using radar observations: case studies in the summer 2002. Scientific report N. 29. Royal Meteorological Institute of Belgium, Brussels. [ Links ]
Edwards R. and R. L. Thompson, 1997. Nationwide comparisons of hail size with WSR-88D vertically integrated liquid water and derived thermodynamic sounding data. Weather Forecast. 13,277-285. [ Links ]
Emanuel, K.A., 1994. Atmospheric convection, Oxford University press, 230-270. [ Links ]
Foote G. B. and C. A. Knight, 1979. Results of a randomized hail suppression experiment in northeast Colorado. Part I: Design and conduct of the experiment. J. Appl.Meteor. 18, 1526-1537. [ Links ]
Greene D. R. and R. A. Clark, 1972. Vertically integrated liquid water -Anew analysis tool. Mon. Wea. Rev. 100, 548-552. [ Links ]
Hohl, R., H. H. Schiesser, and D. Aller, 2001. Hailfall: The relationship between hail kinetic energy and hail damage to buildings. Atmosferic Research. Submitted October 2001. [ Links ]
Holleman I., H. R. A. Wessels, J. R. A. Onvlee and S. J. M. Barlag, 2000. Development of a Hail-Detection-Product. Phys. Chem. Earth (B) 25, 1293-1297. [ Links ]
Holleman I., 2001. Hail detection using single-polarization radar. Royal Netherlands Meteorological Institute (KNMI), De Bilt, The Netherlands. Scientific Report, KNMI WR-2001-01, 70 pp. [ Links ]
Ioana M., V. Ivanovici, E. Cordoneanu, D. Banciu, A. Apostu and B. Ford, 2004. SIMIN- the integrated system for meteorological surveillance, forecast and alert in Romania. 20th International Conference on Interactive Information and Processing Sysems (IIPS) for Meteorology, Oceanography and Hydrology. [ Links ]
Kessinger C. J., E. A. Brandes and J. W. Smith, 1995. A comparison of the nexrad and nssl hail detection algorithms. 27th Conference on Radar Meteorology, AMS,Vail, CO, USA, 603-605. [ Links ]
Klaassen W., 1988. Radar observations and simulation of the melting layer of precipitation. J. Atmos. Sci. 45, 3741-3753. [ Links ]
Lemon L. R.,1978. On the use of storm structure for hail identification. Preprints, 18th Conference on Radar Meteorology, Atlanta, GA, Amer. Meteor. Soc. 203-206. [ Links ]
Lemon L. R., 1998. The radar "Three-Body Scatter Spike": An operational large-hail signature. Weather Forecast. 13, 327-340. [ Links ]
Lenning E. and H. E. Fuelberg, 1998. An evaluation of WSR-88D severe hail algorithms along the Northeastern Gulf Coast. Weather Forecast. 13, 1029-1045. [ Links ]
Mather G. K., D. Treddenick and R. Parsons, 1976. An observed relationship between the height of the 45 dBz contours in storm profiles and surface hail reports, J. Appl. Meteor. 15, 1336-1340. [ Links ]
Mervin H., F. Hey and P. R.Waylen, 1987. Probabilities of daily hail and thunder occurrences, J. Appl. Meteor. 26, 1014-1020. [ Links ]
NOAA, 1991. Doppler Radar Meteorological Observations. Federal Meteorological Handbook no. 11, National Oceanic and Atmospheric Administration. Washington D. C., 125 pp. [ Links ]
Pop Gh., 1964. Climatology (In Romanian), Didactic and Pedagogical Printing House, Bucharest, 114-122. [ Links ]
Pruppacher H. R. and J. D. Klett, 1997. Microstructure of atmospheric clouds and precipitation. Kluwer Academic Publishers, Netherlands 954 pp. [ Links ]
Rinehart R. E., 1978. On the use of ground return targets for radar reflectivity factor calibration checks. J. Appl. Meteor. 17, 1342-1350. [ Links ]
Roeseler C. A. and L. Wood, 1997. VIL density and associated hail size along the northwest Gulf coast. Preprints, 28th Conference on Radar Meteorology. American Meteorological Society. Austin, TX, 434-435. [ Links ]
Sánchez J. L., R. Fraile, J. L. de la Madrid, M. T. de la Fuente, P. Rodríguez and A. Castro, 1995. Crop damage: The hail size factor. J. Appl. Meteor. 35, 1535-1541. [ Links ]
Tuomi T. J. and A. Mäkelä, 2008. Flash cells in thunderstorms. In: Lightning: principles, instruments and applications. (H. D. Betz, U. Scumann and P. Laroche, Eds.). Springer, Netherlands, 508-520. [ Links ]
Waldvogel Federer A. B. and P. Grimm, 1979. Criteria for the detection of hail cells. J. Appl. Meteor.18, 1521-1525. [ Links ]
Witt A., M. D. Eilts, G. J. Stumpf, J. T. Johnson, E. De Wayne Mitchell and K. W. Thomas, 1998. An enhanced hail detection algorithm for the WSR-88D. Weather Forecast. 13, 286-303. [ Links ]

