


Services on Demand
Journal
Article
 English (pdf)
 Article in xml format
 Article references
 Send this article by e-mail
Indicators
-
 Cited by SciELO
 -
 Access statistics
Related links
-
 Similars in
SciELO
Similars in
SciELO
Share

 Permalink
Atmósfera
Print version ISSN 0187-6236
Atmósfera vol.24 n.4 Ciudad de México Oct. 2011
Comparison between LDA technique and fuzzy membership roster method for pre-monsoon weather forecasting
S. CHATTERJEE
Atmospheric Science Research Group, School of Environmental Studies, Jadavpur University, Kolkata-700032, India
S. GHOSH
Department of Mathematics, Barrackpore Rastraguru Surendranath College, Kolkata 700120, India
U. K. DE
Atmospheric Science Research Group, School of Environmental Studies, Jadavpur University, Kolkata-700032, India & Centre for Interdisciplinary Research and Education, 404 B Jodhpur Park, Kolkata 700068, India Corresponding author; e-mail: deutpal2003@yahoo.com
Received May 10, 2010; accepted June 14, 2011
RESUMEN
En este trabajo se hace un intento para proponer una nueva técnica operacional para la predicción del tiempo en Calcuta (22.53° N, 88.33° E), India, durante la temporada premonzónica (marzo, abril y mayo). La técnica se basa en el método de listado de funciones de pertenencia difusa que maneja la linealidad no inherente de un fenómeno físico. Para establecer este nuevo método se realizó un estudio comparativo entre las técnicas multivariadas existentes, el análisis lineal discriminante y la nueva técnica basada en el método de listado de funciones de pertenencia difusa. Es interesante observar que para la predicción del tiempo a 12 horas con base en las observaciones de la sonda Radio/Rawin de un día, el método de listado de funciones de pertenencia difusa es mejor que las técnicas multivariadas. Sin embargo, ambos métodos son casi igualmente efectivos para predecir el tiempo de las siguientes 12 horas conbase en las observaciones de la sonda Radio/Rawin a las 0000 UTC. Así, la técnica basada en la lógica difusa adoptada aquí es igual de eficiente que las de la estadística lineal pero computacionalmente más sencilla. Los grados de compatibilidad y de funciones discriminantes se definen utilizando un conjunto de datos de entrenamiento para el período 1985-1996 validado para el período 1997-1999.
ABSTRACT
In the present study, an attempt is made to propose a new operational technique for weather forecasting at Kolkata (22.53° N, 88.33° E), India, during the pre-monsoon season (March, April and May). The technique is based on fuzzy membership roster method. It can handle inherent non-linearity in a physical phenomenon. To establish the new method, a comparative study is performed between the existing multivariate technique, the linear discriminant analysis and the newly suggested technique based on fuzzy membership roster method. It is interesting to note that for the prediction of weather of next 12 hours based on Radio/Rawin Sonde observation at 1200 UTC of a day, the fuzzy membership roster method is better than the multivariate technique. Both the methods are however almost equally suitable to predict the weather of the next 12 hours based on Radio/ Rawin Sonde observation at 0000 UTC. So, the fuzzy logic based technique, adopted here, is as efficient as the linear statistical rules, but computationally simpler. The degrees of compatibility and the discriminant functions are defined using a training data set for the period 1985-1996 and validated for the period 1997-1999.
Keywords: Convective development, fuzzy membership roster method, linear discriminant analysis, instability.
1. Introduction
Prediction of any atmospheric phenomenon is always of ultimate interest to the weather forecasters as well as researchers and others. Specially, in recent years, there has been growing interest in the prediction of pre-monsoon convective developments (CD), not only for the possible hazards caused by them, but also for their beneficial character like cooling due to rain during the hot summer days.
The convective developments occurring during March, April and May in Kolkata, India are usually termed as pre-monsoon thunderstorms. The principal component analysis (PCA) technique was applied by previous workers to identify the significant parameters for the occurrence of pre-monsoon thunderstorms (TS) in Kolkata. They have also shown how the linear discriminant analysis (LDA) technique alone as well as in conjunction with PCA can be successfully applied to the set of 20 parameters to predict the pre-monsoon thunderstorms for Kolkata (Ghosh et al. 1999, 2004; Chatterjee et al., 2009). Cluster analysis and LDA technique (Maryon and Storey, 1985) were utilized to describe a multivariate statistical model for forecasting anomalies of surface pressure present over Europe and North Atlantic. In another study, multiple linear regression (Ward and Folland, 1991) was compared with LDA for making hindcasts and real time forecasts of north-east Brazil wet season rainfall using sea surface temperature. Though a number of attempts (Showalter, 1953; Darkow, 1968) were made to establish empirical models for the prediction of atmospheric stability/instability, the work done on Kano (Oduro-Afriyie and Adefolalu, 1993) is perhaps the first successful attempt for tropical region. Another attempt was made to predict the occurrence of CD at Dhaka (Bangladesh) in terms of stability indices (Chowdhury et al., 1996).
Convective developments are strongly favored by convective instability, abundant moisture at lower levels, strong wind shear, and a dynamical lifting mechanism that can release the instability (Kessler, 1982). Moreover, the vertical shear of the environmental winds has to match the value of the convective instability for proper development of a large convective cloud (Asnani, 1992). It has also been emphasized that the presence of conditional instability is an essential criterion for supporting electrification and lightning (Williams and Reno, 1993). In addition to the parameters just mentioned, two more parameters, viz. (θes-θe) and (P-PLCL) have been used in the present study, where θes and θe denote the saturated equivalent potential temperature and equivalent potential temperature respectively. P is a level pressure and PLCL is the pressure at the corresponding lifting condensation level.
The thermodynamic parameter (θes-θe) was originally introduced by Betts (1974) as a measure of the unsaturation of the atmosphere. PLCL for the surface parcel was considered as the cloud base (Kuo, 1965) and hence (P-PLCL) is taken as a forcing factor for the saturation of a parcel.
The present study has been confined up to the 500 hPa level only. Importance of this level had already been stressed upon by a number of scientists (Galway, 1956; Fujita et al., 1970; Miller, 1972). Here, we propose a new method based on fuzzy membership roster method. The main objective is to apply the multi-valued logic i.e. fuzzy logic in weather prediction, because all the methods which have been developed so far, mainly involve bi-valued logic. That is why, in the present work, the multivariate technique LDA and the technique based on fuzzy membership roster method have been compared.
Fuzzy set theory, originally proposed by Zadeh (1965a, b), aims at imitating the model of human thought process. It is to be noted that the basic premises of bi-valued true-false Boolean notion are redefined here, as in the case of transition of classical mechanics of physics to quantum mechanics. It may be stated that 'fuzzy logic' is one of the four basic technical issues of soft computing (Dutta, 2006).
In spite of strong resistance to fuzzy logic, many researchers started working in the field during 1965-1975. During the first decade, many mathematical structures were fuzzified by generalizing the underlying sets to be fuzzy, i.e. the sets with no sharp boundaries. The 1990s is an era of new computational paradigms. The fuzzy toolbox for MATLAB was introduced as an add-on component to MATLAB in 1994 (Yen and Langari, 2005).
The applications of the fuzzy set theory include studies in many fields, e.g. meteorology, biology and others (Klir and Folger, 1998). Recently good number of studies have been performed by different researchers on the application of fuzzy logic in atmospheric science.
In 1995 Murtha applied the fuzzy logic in operational meteorology. Yu and Tao (2000) developed a fuzzy multi-objective function for rainfall-runoff model calibration in 2000. In 2002, Gomes and Casanovas reported a case study of solar irradiance which involved fuzzy logic and meteorological variables. In 2003, Mackay et al. used fuzzy logic in automated parameterization of land surface process models. Chang et al. (2005) applied fuzzy theory in genetic algorithm to interpolate precipitation. Mitra et al. (2008) used rule-based fuzzy inference system for weather forecasting. In recent time Ma et al. (2009) have applied the same technique for the verification of meso-scale NWP forecasts. Hubbert et al. (2009) have developed a technique for real time identification and filtering using fuzzy logic. Dhanya and Kumar (2009) have used a fuzzy rule based modeling approach for the prediction of monsoon rainfall in India.
The science of meteorology deals with a vastly complex system and has meteorological descriptions as well as forecasts. It often includes the vague linguistic terms such as hot weather, low pressure etc. Applications of fuzzy set theory to meteorology, therefore, make an attempt to deal with the complexity of the study by taking advantage of the representation of vagueness offered in the mathematical formalism (Cao and Chen, 1983; Zhang and Chen, 1984).
According to Aristotle, propositions about future events are neither actually true nor actually false, but potentially either (Klir and Yuan, 2002). The basic assumptions of classical two-valued logic have been questioned since Aristotle. With this underlying idea the present attempt has been made, in which the true/false dichotomy of classical two-valued logic has been relaxed.
More specifically, the present study aims at forecasting the pre-monsoon weather of Kolkata on the basis of degree of compatibility of a day to the two fuzzy sets, a set of days with convective development and a set of days with fair weather. The sets have been termed as fuzzy sets, as some of their elements (i.e. the parameters involved in the study) cannot be discriminated clearly for the two atmospheric situations, viz. convective development and fair weather (Ghosh et al., 1998)
2. Data
The number of CD and fair weather (FW) days linked with the morning and afternoon Radio Sonde/Rawin Sonde (RS/RW) observations at Kolkata are presented in Table I. These data have been used to derive the required thermodynamic parameters, which have been used to construct the discriminant indices as well as the fuzzy rule. Any convective development occurring within the next 12 hours from the morning RS/RW observation taken at 0000 UTC (0530 Indian Standard Time) is considered as CD related to morning RS/RW, otherwise it is FW related to the same RS/ RW. A similar consideration for afternoon RS/RW observation taken at 1200 UTC is utilized for the classification of CD or FW linked with afternoon or evening RS/RW observations. On many occasions the data, either at one or more of the significant levels i.e. 1000, 850, 700, 600 and 500 hPa were not available. Naturally those occasions could not be taken into consideration. The linear discriminant functions and the fuzzy rule (morning and afternoon) for forecasting the convective development at Kolkata have been constructed utilizing all the available radiosonde data of 12 years (1985-1996) and for the validation of these techniques, the radiosonde data of 3 years (1997-1999) have been used.

In the literature, Oi (i =1 to 20) represent the following thermodynamic and dynamic parameters of the atmosphere which has been split into four layers up to 500 hPa:
O1 = (θes-θe) at 1000 hPa level ; O2 = (P-PLCL) at 1000 hPa level; O3=∂θes/∂z at 1000-850 hPa layer ; O4 = ∂θe/∂z at 1000-850 hPa layer; O5 = ∂v/∂z at 1000 -850 hPa layer; O6 = (θes-θe) at 850 hPa level;O7= (P-PLCL) at 850 hPa level; O8=∂θes/∂z at 850-700 hPa layer; O9 = ∂θe/∂z at 850-700 hPa layer; O10=∂v/∂z at 850-700 hPa layer; O11 = (θes-θe) at 700 hPa level; O12= (P-PLCL) at 700 hPa level; O13=∂θes/∂z at 700-600 hPa layer; O14=∂θe/∂z at 700-600 hPa layer; O15=∂v/∂z at 700 -600 hPa layer; O16 = (θes-θe) at 600 hPa level ; O17= (P-PLCL) at 600 hPa level; O18=∂θes/∂z at 600-500 hPa layer; O19=∂θe/∂z at 600-500 hPa layer; O20=∂v/∂z at 600 -500 hPa layer. It is worth mentioning that the values of (θes - θe) and (P - PLCL) at the lower level of each layer have been treated as their respective values for that layer. Here, z stands for the vertical height, ∂θes/∂z for conditional instability ∂θe/∂z for convective instability and ∂v/∂z for the vertical shear of horizontal wind.
3. Methodology
The present study considers separately the following four situations:
1. Prediction of convective development from the data of 0000 UTC (Morning CD or MCD)
2. Prediction of fair-weather from the data of 0000 UTC (Morning FW or MFW)
3. Prediction of convective development from the data of 1200 UTC (Evening CD or ECD)
4. Prediction of fair-weather from the data of 1200 UTC (Evening FW or EFW).
All the above mentioned predictions have been made for the next 12 hours from the time of observations.
The work involves two techniques, viz. LDA, a popular multivariate technique (Morrison, 1976; Wilks, 1995) and fuzzy membership roster method (Klir and Yuan, 2002). The main features of the techniques have been discussed, in short, in the following two sections.
3.1 Basics of LDA applied in the present study
Let us consider two groups X and Y, where X consists of the parameters of FW situations and the elements of Y are the parameters representing the situations of CD.
Let us suppose that there are k parameters, Oi (i = 1 to k) on which we have the following two sets of observations:
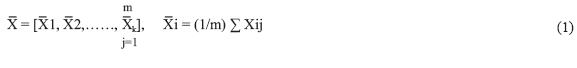
X = [Xij] (i = 1 to k, j = 1 to m) and Y = [Yij] (i = 1 to k, j = 1 to n)
In the present study, Oi ( i = 1 to 20 ) denote the above mentioned 20 parameters, Xij denotes the value of the ith parameter on jth FW day and Yij gives the value of the ith parameter on jth CD day.
The work has been performed with k = 20, m = the number of FW days, which is 280 for morning and 201 for afternoon and n = the number of CD days, which is 123 for morning and 165 for afternoon. The LDA technique has been performed with the k-dimensional row data vector.
Each of the groups X and Y has been characterized as follows:

Without any loss of generality, let us assume that the population underlying each of the groups, X and Y have the same covariance matrix. Then the sample covariance matrices Sx and Sy can be computed from the data matrices as follows:

Since the covariance structures are assumed to be the same, the above two matrices are averaged to yield a pooled estimate of the dispersion of the data around their means as follows:

Finally, given a single observational vector U = [ U1, U2..., Uk ] where the elements Ui (i = 1 to k), denote the values of the parameters on a particular day , the nature of which is unknown. The following discriminant functions are calculated to determine which group U belongs to:

where '/' means as usual the transpose of a matrix.
If |DX - DU| < |Dy - DU|, then U belongs to the X-group, i.e. the nature of the unknown day is expected to be as that of a FW day. Similarly, if |DX - DU| > |Dy - DU|, then U belongs to the Y-group, i.e. the nature of the unknown day resembles the nature of a CD day.
Here, the number of days of unknown category involved in the validation is 44 for MCD, 84 for MFW, 53 for ECD and 65 for EFW. The discriminant functions for morning FW (MDX), morning CD (MDy), evening FW (ADX) and evening CD ( ADy), which have been calculated for the present study using (5) are given in Table I.
3.2 Basics of fuzzy-rule based technique suggested for the present analysis
Here we consider the same two groups X and Y as in the previous section which are taken as two standard pattern classes. X and Y are termed as fuzzy sets since it is difficult to identify sharp boundaries between these two sets so far the parameters, viz., convective instability, conditional instability and vertical shear are concerned. Then the degrees of compatibility of a parameter, Oi (i=1 to 20) with the standard pattern classes, Y and X are computed as follows:

Where
miCD: mean of the ith parameter of CD days (123 days for morning and 165 days for afternoon).
σ iCD: standard deviation of the ith parameter of CD days (123 days for morning and 165 days for afternoon).
miFW: mean of the ith parameter of FW days (280 days for morning and 201 days for afternoon).
σiFW: standard deviation of the i* parameter of FWdays (280 days for morning and 201 days for afternoon).
In the present study, the range of values of the degree of compatibility is the unit interval [0,1], so that the infinite-valued logic can be incorporated in place of classical two-valued logic. Here, the univariate or one-dimensional Gaussian function has two parameters m and o, such that

where m1 and σ1 denote the center and width of the values of O1 respectively. Since, the numerical values of the selective parameters are not scattered, the respective means of the thermodynamic and dynamic parameters represent the two patterns in a reliable way.
Finally, the degrees of compatibility of a day (i.e. a relevant pattern) defined by
O = (O1, O2,O3................, O20) with the two standard pattern classes, Y and X are constructed as follows:

If, now, an unknown pattern ora day, say U = (U1 ,U2 ,.., U20) is given, where U1 is the measurement associated with the ith parameter of the pattern, then the degrees of compatibility of U with the standard patterns, Y and X, denoted by AY(U) and AX(U) respectively, are computed as follows:

Next, an unknown pattern or a day, U is classified by the larger value of Ay(U) or AX(U), i.e. if Ay(U) > AX(U), then there is a possibility for U to be more of the pattern Y than of the pattern X for next 12 hours. Hence it may be predicted that U is possibly a day with convective development for next 12 hours (Klir and Yuan, 2002).
It is worth mentioning in this context that there is no sound principle yet for guiding the choice of membership function or degree of compatibility. But, here Gaussian membership function has been selected because of the following reasons:
i) Since some of the parameters are found to follow Gaussian distribution and usually the physical parameters are assumed to be Gaussian or quasi Gaussian in nature, for each parameter, the Gaussian membership function has been chosen to construct the one dimensional or univariate degree of compatibility.
ii) Gaussian membership functions are continuously differentiable as well as parametrizable.
iii) Gaussian membership functions are factorizable. Hence, we may synthesize amulti dimensional or multivariate degree of compatibility as the product of one dimensional or univariate degree of compatibility. That is why the product forms have been used in the relations (9a) and (9b) to handle the nonlinearity (Yen and Langari, 2005).
Moreover, that the product form of membership functions is used already by Dhanya and Kumar (2009).
In order to measure the degree of fuzzyness of the pattern classes X and Y, the membership based validity measures, named as the partition coefficients (Yen and Langari, 2005) have been computed separately for the four situations under consideration; viz, MFW, MCD, EFW, ECD as follows:
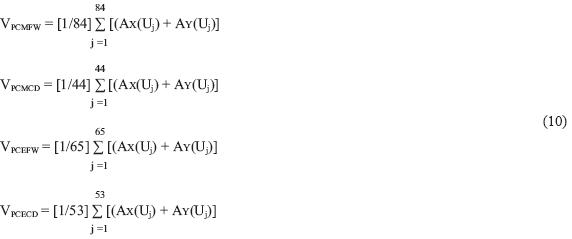
where Uj denotes an unknown pattern or a day, which belongs to the dataset used for validation. It is to be mentioned here that the number of unknown days used for validation of this technique are same as those of the previous section.
4. Results and discussion
In the LDA technique, the number of days involved are 280 for MFW, 123 forMCD,201 forEFW and 165 for ECD; those are used for constructing the discriminant functions, using the relation (5). The 20 thermodynamic and dynamic parameters computed from the RS/RW data of 0000 UTC and 1200 UTC as mentioned earlier are used here. It has been already mentioned that the linear discriminant functions constructed by the LDA technique are presented in Table I. It should be noted that the results using LDA technique are already available in the literature (Chatterjee et al., 2009). We are quoting those results for the purpose of comparison with the fuzzy technique.
The results of the categorical discrimination of an unknown day (U) belonging to the dataset used for validation, have been presented in Table III using the two techniques, where the dataset consists of the pre-monsoon days of 1997, 1998 and 1999.

Similarly, the following number of days are used for constructing the means and standard deviations in the fuzzy membership roster method: 280 for MFW, 123 for MCD, 201 for EFW, and 165 for ECD. The same 20 thermodynamic and dynamic parameters as in the LDA techniques are used here.
The degrees of compatibility computed using the relations (9a) and (9b) have been applied to classify a pre-monsoon day of unknown category (U) of the year 1997, 1998, 1999 and the results are presented in Table II. The membership validity measures for MFW, MCD, EFW and ECD are computed with the help of the relation (10) and are presented in Table III.

Here, the study has been performed separately for morning and afternoon, since a previous study reveals that during the pre-monsoon season in Kolkata, the weather of the morning differs significantly from that of the afternoon (Ghosh etal., 1999). It is well known that any atmospheric phenomenon is essentially complex and multivariate in nature. So, the multivariate technique, LDA, works well for weather prediction. But it is more stringent than a technique based on generalized multiple-valued logic, the fuzzy logic. Moreover, since both the techniques involve joint effect or joint contribution of all the parameters, they are comparable.
For prediction from the dataset of morning, the present analysis reveals that in case of convective development, the LDA and fuzzy rule based techniques produce respectively 77.2 and 77.3 % correct information, whereas in case of fair weather the respective techniques produce 42.8 and 38.1 % correct results. (Table II). Hence it may be inferred that the two techniques are almost equivalent for forecasting the pre-monsoon weather of Kolkata on the basis of the observations at 0000 UTC, though the second technique is computationally simpler and less time consuming. One should also note that the fuzzy membership method has ample scope for further development in the field of pre-monsoon weather forecasting.
But in the afternoon, the percentage of correct results in both the situations, convective development and fair weather improves noticeably in the fuzzy rule based technique. In case of convective developments in the afternoon, the correct results are respectively 56.6 and 75.4 % in LDA and fuzzy rule based methods and in the fair weather situations, the respective techniques produce 50.8 and 60.0% correct results (Table II). It is also to be noted that both the methods work better in detection of the convective development than that of the fair weather.
Regarding the membership validity measures (Table III), which have been computed using (10) it can be stated that the classes X and Y, are not hard, as VPCMFW ≠1, VPCMCD ≠1, VPCMFW≠1 and VPCECD≠1. Hence the fuzzy rule based technique as suggested here, has a possibility for improvement (Yen and Langari, 2005).
5. Conclusions
The conventional mathematical or statistical models are essential for prediction, because they represent the behavior of the system in a quantitative fashion. But it is interesting to note that fuzzy models have the same ability to process numerical information as conventional models.
The study reveals that though both the techniques used in the present analysis, are efficient for forecasting pre-monsoon weather of Kolkata, India, the technique based on fuzzy membership roster method is more efficient than the multivariate technique based on LDA. The new fuzzy logic based method works either equally well as the LDA technique or better than it. Moreover, the fuzzy membership roster method is computationally simpler than the LDA technique. So, it might be preferable to the field forecasters. Hence it may be concluded that the technique based on fuzzy membership roster method is preferable to the LDA technique for operational purpose.
Acknowledgements
The authors are grateful to the India Meteorological Department for supplying the necessary data for the present study. They are also thankful to Dr. S. K. Ghosh, Retired Deputy Director General of Meteorology, India Meteorological Department; Prof. S. Bandyapadhyay and Prof. M. T. Kundu of the Department of Computer Science Engineering, Jadavpur University for some helpful suggestions. One of the authors (UKD) wishes to express thanks to the All India Council for Technical Education, Government of India for the sanction of Emeritus Fellowship and the present work is a part of that program.
References
Asnani G. C., 1992. Tropical Meteorology Vol. 2. Publisher: G. C. Asnani, Pune, India, pp 829, 833-852. [ Links ]
Betts A K., 1974. Thermodynamic classification of tropical convective soundings. Mon. Weather Rev. 102, 760-764. [ Links ]
Cao H. and G. Chen, 1983. Some application of fuzzy sets to meteorological forecasting. Fuzzy Set. Syst. 9, 1-12. [ Links ]
Chang C. L., S. L. Lo and S. L. Yu, 2005. Applying fuzzy theory and genetic algorithm to interpolate precipitation. J. Hydrology 314, 92-104. [ Links ]
Chatterjee S., S. Ghosh and U. K. De, 2009. Reduction of number of parameters and forecasting convective developments at Kolkata (22.53° N, 88.33° E), India during pre-monsoon season: An application of multivariate techniques, Indian J. Radio Space Phys. 38, 275-282. [ Links ]
Chowdhury A. M., S. Ghosh and U. K. De, 1996. Analysis of pre-monsoon thunderstorm occurrence at Dhaka from 1983 to 1992 in terms of (Qes-Qe) and convergence/ divergence at surface. Indian J. Phys. 70B, 357-366. [ Links ]
Darkow G. L., 1968. The total energy environment of storms. J. Appl. Meteoro. 7,199-205. [ Links ]
Dhanya C. T. and D. N. Kumar, 2009. Data mining for evolving fuzzy association rules for predicting monsoon rainfall of India, J. Intell. Systems 18, 193-210 [ Links ]
Dutta A. K., 2006. Proceedings of the National Seminar on Techniques in Applied Mathematics, Calcutta University, Kolkata, India. [ Links ]
Fujita T. T., D. L. Bradbury, C. F. van P. Thillender, 1970. Sunday tornadoes of April 11, 1965. Mont. Weather Rev. 98, 26-29. [ Links ]
Galway J. G., 1956. The lifted index as a predictor of latent instability. B. Amer. Meteorol. Soc. 37, 528-529. [ Links ]
Ghosh S., A. Manna and U. K. De, 1998. A comparative study of thermodynamic nature of the atmosphere at Dumdum, Calcutta (22.38 N, 88.28 E) on thunderstorm and favourable fair-weather days. Indian J. Phys. B. 72, 137-144. [ Links ]
Ghosh S., P. K. Sen and U. K. De, 1999. Identification of significant parameters for the prediction of premonsoon thunderstorm at Calcutta. Int. J. Climatol. 19, 673-681. [ Links ]
Ghosh S., P. K. Sen and U. K. De, 2004. Classification of thunderstorm and non-thunderstorm days in Calcutta (India) on the basis of LDA. Atmósfera 17,1-12. [ Links ]
Gomes V. and A. Casanovas, 2002. Fuzzy Logic and meteorological variables: a case study of solar irradiance, Fuzzy Set. Syst. 126, 121-128. [ Links ]
Hubbert J. C., M. Dixon and S. M. Ellis, 2009. Weather radar ground clutter, Part II: Real-time identification and filtering. J. Atmos. Ocean. Technol. 26, 1181-1197. [ Links ]
Kessler E., 1982. Thunderstorm morphology and dynamics. National Oceanic and Atmospheric Administration. US Department of Commerce, USA, 263 pp. [ Links ]
Klir G. J. and T. Folger, 1988. Fuzzy Sets, uncertaity and information. Prentice Hall, Englewood Cliffs, New Jersey, USA, 355 pp. [ Links ]
Klir G. J. and B. O. Yuan, 2002. Fuzzy sets and fuzzy logic, theory and applications. Prentice Hall of India Pvt. Ltd. [ Links ]
Kuo H. L., 1965. On formation and intensification of tropical cyclones through latent heat release by cumulus convection. J. Atmos. Science 22, 40-63. [ Links ]
Ma Y., X. Huang, G. A. Mills and K. Parkyn, 2009. Verification of mesoscale NWP forecasts of abrupt cold frontal wind changes. Weather Forecast. Early on-line release, posted July 2009. DOI: 10.1175/ 2009WAF2222259, 93 pp. [ Links ]
Mackay D. S., S. Samanta, D. E. Ahiy, B. E. Ewers, T. S. Gowerand S. N. Burrows, 2003. Automated parameterization of land surface process model using fuzzy logic. Transition in GIS 7, 139-153. [ Links ]
Maryon R. H. and A. H. Storey, 1985. A multivariate statistical model for forecasting anomalies of half-monthly mean surface pressure. Int. J. Climatol. 5, 561-578. [ Links ]
Miller R. G., 1972. Notes on analysis and severe storm forecasting procedure of the Air Force Global Weather Control, in AFGWC Technical Report 200 (rev.), Air Weather Service, US Air Force, 184 pp. [ Links ]
Mitra A. K., S. Nath and A. K. Sharma, 2008. For forecasting using rule-based Fuzzy Inference System. J. Indian Society Rem. Sens. 36, 243-253. [ Links ]
Morrison D. F., 1976. Multivariate Statistical Methods. 2nd ed. McGraw Hill, New York, USA, 415 pp. [ Links ]
Murtha J., 1995. Application of fuzzy logic in operational meteorology. Scientific Services and Professional Development Newsletter, Canadian Weather Service, 42-54. [ Links ]
Oduro-Afriyie K. and D. O. Adefolalu, 1993. Instability indices for severe weather forecasting in West Africa. Atmos. Res. 30, 51-68. [ Links ]
Showalter A. K., 1953. A stability index for thunderstorms forecasting. B. Am. Meteorol. Soc. 34, 250-252. [ Links ]
Ward M. N. and C. K. Folland , 1991. Prediction of seasonal rainfall in the North Northeast of Brazil using eigenvector of sea-surface temperature. Int. J. Climatol. 11, 711-743. [ Links ]
Wilks D. S., 1995. Statistical methods in the atmospheric sciences. 2nd ed. Academic Press, New York 648 pp. [ Links ]
Williams E. and N. Renno, 1993. An analysis of the conditional instability of the tropical atmosphere. Mon. Weather Rev. 121,23-26. [ Links ]
Yen J. and R. Langari, 2005. Fuzzy logic, intelligence, control and information. Pearson Education (Singapore) Pvt. Ltd., India Branch, Delhi. [ Links ]
Yu P. S. and C. Y. Tao, 2000. Fuzzy multi-objective function for rainfall- runoff model calibration. J. Hydrology 238, 1-14. [ Links ]
Zadeh L. A., 1965a. Fuzzy Sets. Inform. Control 8, 338-353. [ Links ]
Zadeh L. A., 1965b. Fuzzy sets and systems. In: System Theory (Fox J., ed.). Polytechnic Press, Brooklyn, New York, 29-38. [ Links ]
Zhang W. and Y. Chen, 1984. Mathematical models of multifactorial decisions and weather forecast.In: Fuzzy Information, knowledge representation and decision analysis (E. Sánchez, Ed.). Pergamon Press, Oxford, U.K., 265-269. [ Links ]

