


Serviços Personalizados
Journal
Artigo
 Inglês (pdf)
 Artigo em XML
 Referências do artigo
 Enviar este artigo por email
Indicadores
-
 Citado por SciELO
 -
 Acessos
Links relacionados
-
 Similares em
SciELO
Similares em
SciELO
Compartilhar

 Permalink
Atmósfera
versão impressa ISSN 0187-6236
Atmósfera vol.24 no.3 Ciudad de México Jul. 2011
A proposal for a vulnerability index for hydroelectricity generation in the face of potential climate change in Colombia
J. E. OSPINA NOREÑA, C. GAY GARCÍA, A. C. CONDE
Centro de Ciencias de la Atmósfera, Universidad Nacional Autónoma de México, Circuito Exterior Ciudad Universitaria, México, D.F. 04510 México. Corresponding author: C. Gay–García; e–mail: cgay@servidor.unam.mx.
G. SÁNCHEZ TORRES ESQUEDA
Universidad Autónoma de Tamaulipas, Facultad de Ingeniería Arturo Narro Siller, División de Estudios de Posgrado, Centro Universitario Tampico–Madero, Tamaulipas.
Received November 8, 2008; accepted March 29, 2011
RESUMEN
Se analizó la incidencia del cambio climático potencial sobre la relación recursos hídricos/generación de energía hidroeléctrica en la cuenca del Sinú–Caribe, Colombia, identificando algunas variables climático–hidrológicas que mejor expresan la vulnerabilidad (entendida ésta como los cambios positivos o negativos sobre los recursos hídricos y los sistemas relacionados con éstos y no precisamente la definición de vulnerabilidad dada por el IPCC) de los recursos hidrológicos en la región, teniendo en cuenta los valores actuales y proyectados para el periodo 2010–2039, los cuales fueron estimados mediante la aplicación de algunos modelos de circulación general bajo los escenarios de emisiones de gases de efecto invernadero A2. Estos escenarios fueron elegidos considerando su análisis como un principio conservacionista y de prevención ante los efectos más adversos. Se propuso el uso de un escenario promedio ponderado y se elaboró un índice de vulnerabilidad para la generación de energía hidroeléctrica. En el escenario promedio ponderado se logró determinar la disminución del volumen almacenado en la presa de 13.3% con respecto al escenario actual y de 22.8% con respecto al volumen máximo técnico y la disminución de la generación de energía de 16.2% con respecto a la generación actual y de 29.5% con respecto a la máxima capacidad de generación. El índice de vulnerabilidad del sistema de generación hidroeléctrica permitió determinar la probabilidad de que el sistema sea vulnerable en grado bajo (44.4%), en grado medio (22.2%) y en grado alto (33.3%) respectivamente, es decir, de 9 modelos analizados, 4 proyectan grado bajo de vulnerabilidad, 2 grado medio y 3 grado alto.
ABSTRACT
The effect of potential climate change on the relationship water resources/hydropower generation in the Sinú–Caribbean Basin, Colombia, was analyzed. Climatic–hydrological variables that best express the vulnerability (positive or negative changes on water resources and related systems, and not precisely the definition of vulnerability given by the IPCC) of water resources in the region were identified, taking into account the current and projected values for the period of analysis 2010 to 2039. These variables were estimated based on the application of several general circulation models under greenhouse gas emissions scenarios A2. These scenarios were chosen considering that its outputs could provide a better basis to prevent adverse effects. The use of a weighted average scenario was proposed, and a vulnerability index for hydroelectric energy generation was established. In using the weighted average scenario was possible to determine the reduction of 13.3% in water storage volume in the reservoir with respect to the current scenario (year 2005 historic average), and the reduction of 22.8% in water storage volume with respect to the top of conservation storage capacity, and also, the reduction of 16.2% in energy generation with respect to current generation, and the reduction of 29.5% in energy generation with respect to the maximum hydropower generation capacity. The vulnerability index made it possible to determine (according to the models applied) that the hydropower generation system has a 44.4% low degree of vulnerability, a 22.2% medium degree of vulnerability, and a 33.3% high degree of vulnerability. In other words of nine analyzed models, four project a low degree of vulnerability, two medium degree and three a high degree of vulnerability.
Keywords: Water resources, climate change, general circulation models, vulnerability index, hydropower sector.
1. Introduction
Climate change, according to the definition by the Intergovernmental Panel on Climate Change (IPCC, 2001), refers to any change in climate over time whether due to natural variability or as a result of human activity. For the Instituto de Hidrología, Meteorología y Estudios Ambientales de Colombia (IDEAM, 2000) this change can determine differences in the average values of a climate factor, that is, its change can be shown as a new normal climate and, therefore, lead to an adjustment in human activities.
Many human and environmental systems are susceptible to climate change, among them, water resources, agriculture, forestry, coastal zones and marine systems, human settlements, energy, industry, insurance, financial services and public health. Vulnerability to climate changes in these systems will depend on geographical location, weather, social, economic and regional and/or local conditions (Watson et al., 1998; IPCC, 2001).
Trenberth et al. (2003) argue that global warming could increase rainfall intensity and reduce its frequency, and that could have an impact on water resources big enough to trigger conflicts among users, regions and countries, and that changes in surface runoff processes will depend on changes in temperature and precipitation, among other variables. Arnell et al. (2001), and Gay (2000) found, using climatic models to simulate future climate conditions under different emissions scenarios, that all simulations indicate an increase in mean global precipitation, but at the same time, they found areas of significant reductions in surface runoff, leading them to conclude that the increase in precipitation does not translate into regional increases in the availability of surface and ground water.
Approximately 81.2% of the electrical energy used in Colombia comes from hydropower generation (Unidad de Planeación Minero Energética de Colombia, UPME, 2005), from which the Urrá 1 reservoir (located on the Sinú–Caribe river basin) contributes with about 3.7% (340 MW) of that electrical energy. Therefore, this study intends to establish the vulnerability of water resources to climate change, to evaluate its relationship to hydropower generation in the Sinú–Caribe river basin, and to identify a relevant hydropower generation vulnerability index.
2. Methodology
The methodology described in this paper includes three stages:
Stage 1. Collection of information
a) Information collected from recent studies conducted at the Centro de Ciencias de la Atmósfera (CCA, acronyms in Spanish) of the Universidad Nacional Autónoma de México (UNAM, acronyms in Spanish) by Ospina (2009), and Ospina et al. (2009), where potential climate changes projected by different general circulation models have been determined for the period 2010 to 2039, specifically in maximum temperature (Tmax), precipitation (PCP) and inflows from the Sinú River to the Urrá 1 reservoir.
b) Data used from the Urrá 1 reservoir to determine and compute the relationship between current and projected stream flows, reservoir storage volumes and hydropower generation.
Stage 2. Proposed weighted average scenario
In this stage, following the logic and goals inherent to environmental impact assessment (EIA) studies to prevent negative environmental impacts, a new scenario was proposed, called weighted average scenario, according to the following procedure:
1) The previously analyzed scenarios were ranked from highest to lowest, or vice versa, according to the changes recorded in stream flows and hydropower generation in the Tmax and PCP projections.
2) The stream flows obtained from the 8 models applied, that showed higher increase in Tmax and higher decrease in PCP, were assigned with higher weights and then weighted average factors were computed.
Stage 3. Proposed vulnerability index for hydropower generation
For this purpose, a sensitivity analysis was performed on the hydropower generation resulting from the Tmax and PCP projections given by the different scenarios that were analyzed. Therefore, the proposed vulnerability index was calculated as follows:
a) Changes in the Tmax and PCP variables that were clearly explanatory for stream flow changes, and therefore, changes in hydropower generation were categorized or entered within certain ranges (high, medium, low, very low and others). The classifications given to the ranges obtained for each variable were made on a hierarchy scale of 1 to 5 according to the degree of impact on hydropower generation, being 1 equivalent to slight impact, and 5 to maximum impact. For example, changes in Tmax from 0.1 to 0.5 °C were classified as low impact and given a category 1; from 0.6 to 1.4 °C were classified as medium impact and given a category 2; and changes equal or higher than 1.5 °C were classified as high impact and given a category 3.
b) For the vulnerability index calculation, the variables involved were multiplied by a coefficient according to the weight assigned to each variable in the model, and then their weighted average values were calculated. Those variables were also given a value of 1 or 0, according to whether they were present (1) or not (0), in the modeling of the different scenarios.
c) The previous step allowed to find the magnitude of vulnerability of hydropower generation in each of the sensitivity analyses, and to infer the degree of impact (high, medium or low) on the system.
3. Analysis and results
3.1 Compilation of information.
Because of the geographical location of Colombia, with lower latitudes in the northern and southern hemispheres, it is under the influence of the northeast and southeast trade winds. These warm and humid wind currents from subtropical latitudes of both hemispheres meet on a strip called the Inter Tropical Convergence Zone (ITCZ), which favors the development of clouds and rainfall (IDEAM, 2001). As a result, the climate is tropical, the four thermal seasons are absent, and there are only prolonged summers, and during winters rainfalls are more frequent. Days and nights are almost of equal length.
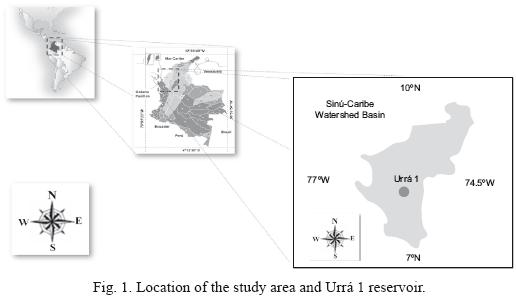
In the Sinú–Caribbean basin the monthly rainfall ranges from approximately 20 to 350 mm, with an annual average precipitation of 2212.0 mm. Maximum temperatures of about 37.5 °C, mean temperatures of about 28.2 °C, and minimum temperatures of about 18.7 °C have been recorded. The study area is located approximately between latitude 7° and 10° north and longitude 74.5° and 77° west, in the the northeast of the Republic of Colombia. Figure 1 shows the location of the study area, including the Urrá 1 reservoir.
A brief description of the methodology applied in this study, also documented by Ospina (2009), and Ospina et al. (2009), is given in this section of this paper. Two meteorological stations were selected in the study area, with codes number 1 307 502 and 2 502 524, with sufficient information for the purposes of this study. The stations have daily records of maximum and minimum temperatures, and precipitation records for over 30 years from 1964 to 2005 (IDEAM, 2006). It should be noted that only records from these two weather stations were taken into account, because of the difficulty in obtaining those climatological data bases, and because they had the most complete historic records of all IDEAM data bases. These stations were therefore assumed to be representative of the whole basin, although it is clear that only two stations are not enough to characterize the whole basin.
The behavior of the climatic variables in the study area was analyzed for establishing a baseline for later analyses and generation of scenarios.
–Forecasts, simulation and comparison of models
Using outputs from the HadCM3 model under emissions scenarios A2, and taking into account current climate characteristics, an analysis was made of the projected potential climate change at a regional level, and its incidence over hydrometeorological parameters for the periods 2010 to 2039 (2020s), 2040 to 2069 (2050s) and 2070 to 2099 (2080s), through the application of the SDSM1 (Statistical Downscaling Model) developed by Wilby and Dawson (2001), specifically on temperature and precipitation variables. A subsequent analysis found its relationship to water levels.
After estimating the current precipitation conditions in each station, various tests were carried out to compare the observed and estimated data in each station, and their average values were calculated using the Statgraphics Plus 4.0 software package, in order to observe whether or not there were any significant differences.
Many models and scenarios differ in the projection of regional climatic variables (uncertainty); therefore, in order to obtain better information about these differences, and to be able to introduce them into the hydrological modeling process, the outputs from experiments CCSRNIES–A21, CSIROMK2B–A21, CGCM2–A21, CGCM2–A22, CGCM2–A23, HadCM3–A21, HadCM3–A22, HadCM3–A23, carried out by the Canadian Institute for Climatic Studies (CICS), were analyzed for the scenarios reported in the SRES, and the emission families for scenarios A2 for the time periods 2020s, 2050s and 2080s. Further information about these experiments can be found at: http://www.cics.uvic.ca/scenarios/data/select.cgi. The Tmax and PCP anomalies found in the studies mentioned above, and records of the listed variables were used to calculate expected monthly and annual precipitation and temperature for the period under analysis, according to the models used.
– Estimation of the Sinú River inflow to the Urrá 1 reservoir
Using the database of Colombia’s Interconexión Eléctrica S.A. (ISA) of the stream flow from the Sinú River into the Urrá 1 reservoir, different regression analyses were tested to try to find the relation between the stream flows and other variables: maximum temperature (Tmax), mean temperature (Tmean), minimum temperature (Tmin) and cumulative monthly and annual precipitation (PCP). The following model, that provided a good fit of the data (see table I), was selected from the regression analyses:

where IF is the monthly inflow (m3/s) to the Urrá 1 reservoir.
This procedure was carried out based on the historical monthly records from 1960 to 2004 of the variables included in the analysis, and the stream flow records at the dam site. Equation (1) provided a reliable relationship between the Tmax and PCP variables.
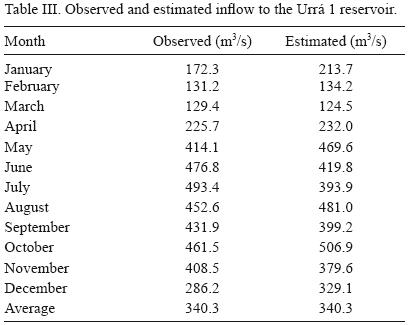
After using model (1), comparison tests were performed between the observed and estimated values which showed no statistically significant differences for mean, standard deviations, median and sample distribution, to a reliability level of 95 percent (Table II). The observed and estimated values are shown in Table III with the observation that the model tends to overestimate low flows during the dry months and underestimate high flows during the rainy months.
– Sensitivity and vulnerability of the hydropower generation system
The results obtained, in relation to monthly stream flows, allowed the definition of a series of scenarios to perform the sensitivity analyses for several sectors and/or systems, in particular the water resources/hydropower generation sector. In addition, more detailed information on the study area and the Urrá 1 reservoir was compiled for those scenarios such as: resource supply/demand, current and future population growth projections, technical issues and operation policies of the reservoir, bathymetry and reservoir evaporation. All this information was needed to create the input data bases required by the Water Evaluation and Planning (WEAP) System software package that was also applied in this study. This information was obtained from various Internet sources, and in some cases given directly by staff members of the following Colombian institutions: Instituto Geográfico Agustín Codazzi (IGAC), Departamento Administrativo Nacional de Estadística (DANE), UPME, IDEAM, Consejo Nacional de Operación Sector Eléctrico (CNO), Empresa Urrá.
Through the use of the WEAP software package, which allows the performance of integrated water resources systems simulations aimed at establishing sound river basin management policies, various sensitivity analyses were conducted in the hydropower generation sector, according to the different climate projections determined previously. The main algorithm incorporated in the WEAP model is based on the principle of mass balance in a river basin, including all kinds of water demand centers (municipal, agricultural, industrial, and other water demand centers), different hydraulic infrastructure, and different water resource management policies, for a single watershed or complex river basins systems. WEAP can also simulate a wide range of natural and intervening components of these systems, including precipitation, surface runoff, and groundwater recharge. Also, WEAP can incorporate different water demand schemes by sectors, water conservation policies, water rights and water allocation priorities, reservoir operations, hydropower generation, water quality and pollution tracking, vulnerability assessments and ecosystem water requirements. Also, a financial analysis module incorporated in WEAP, allows the user to investigate project cost–benefit comparisons (Lee et al., 2005, Sieber and Purkey, 2007). Therefore, considering of the characteristics of the WEAP model, it was used because of the intention to subsequently analyze the current and projected water resource supply and demand ratios for the different water uses and sectors in the 28 water demand sites identified in the watershed.
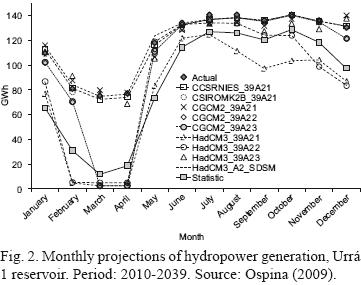
Tables IV and V summarize the variables and data extracted from the studies conducted by Ospina (2009), and Ospina et al. (2009), in which detailed information is found on climate change models, methodology, tools applied, scenario construction, and the different analyses performed on the required data bases. These tables illustrate how all the models and scenarios identified negative effects on the inflows to the Urrá 1 reservoir, the water storage volumes in the reservoir, and the hydropower generation for the period 2010 to 2039. Figure 2 shows the current and projected behavior of hydropower generation for some of the scenarios analyzed in this study.
3.2. Proposed weighted average scenario
As it is seen in Tables V and VI, the different general circulation models show an increase in maximum temperature, increase or decrease in precipitation and reduction in stream flow at the dam site resulting in changes in the generation of electrical energy (see Fig. 2). At this point a weighted average scenario is proposed as an alternative to follow in the management and planning of the operation of the reservoir. The goal is that this scenario will serve as a reference for future hydropower generation projections, for mitigation and adaptation studies on forecasting adverse effects, for hydropower generation efficiency, and for cost–benefit and supply–demand ratios, among others. The weighted average scenario that is shown in Table V was built as specified in the methodology briefly described before, giving weights to the inflows in each model according to Table VIII, and then obtaining their normalized values, keeping in mind the changes of the Tmax and PCP variables, which have greater influence in the stream flows, as it is shown by equation 1.
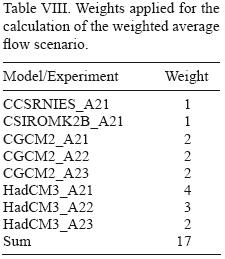
The weighted average scenario is built following the idea of avoiding the worst adverse effects that may be found. To accomplish this, the greater weight is given to the models that project higher Tmax and the biggest decrease in precipitation. In this way, HadCM_A21 model receives a score of 4 due to its higher Tmax increase (1.9 °C), and the highest decrease in PCP (21%) and in flow (34.9%). On the contrary, CCSRNIES_A21 model, projecting a low increase in Tmax (0.5°C), a small increase in precipitation (0.2%) and a slight reduction in flow (2.3%), receives a score of 1 (see Tables VI and VII).
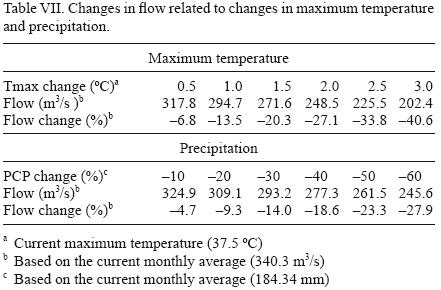
As tables V and VI show, changes in flow and stored volume in the dam, as well as the generation of electrical energy, are directly related to changes in precipitation and maximum temperature.
From Equation (1), considering the present conditions, it follows that every 0.5 °C rise in temperature can represent a 6.8% flow decrement. As well, this change in flow represents a 44.6% of the percentage of change in precipitation.
Table IX shows the results of the monthly values for stream flows at the dam site, water storage volumes and hydropower generation after the application of the process described above.
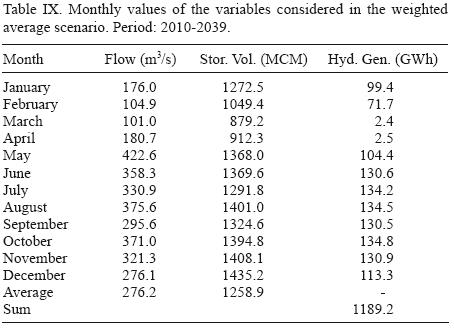
With the help of the Statgraphics Plus, version 4.0, software package, the "one–variable analysis" was applied to the monthly stream flows, so the mean annual stream flow at the dam site for the weighted average scenario was computed (276.2 m3/s), with a standard deviation of 69.5 m3/s, and a confidence interval of 95%.
The reductions observed in hydropower generation in the Sinú–Caribe river basin are important when it comes to covering power demands which, according to the UPME (2006), showed an average annual growth of 2.8% for the period 2000 to 2005. Furthermore, the demand for energy in 2005 showed a higher growth of 5.8%, and it is expected to reach an annual growth rate of 3.3% for the period 2006 to 2025 at a national level.
In the weighted average scenario, the reduction in average water storage volume in the reservoir, with respect to the maximum storage capacity (MSC), would be 22.8%, and some scenarios showed higher reductions (see Table V). For example, the HadCM3–A21 projects a water storage volume reduction at the Urrá 1 reservoir of 37.3%, and also a reduction of hydropower generation of 45.5%. The HadCM3–A22 scenario projects reductions of 28.8% for water storage volume, and 37.7% for hydropower generation. Additionally, this scenario only contemplates the period of analysis from 2010 to 2039. Estimations for the period 2040 to 2069 are even more severe, and those projections must be carefully analyzed because of the implications such reductions might have on the study area, as it was pointed out by Ospina (2009).
In the past, according to the Corporación Andina de Fomento, (CAF, 2000), the phenomenon "El Niño" 1997–1998 caused reductions in stream flows up to 33% in the flow on the Sinú River, which caused severe losses in agriculture, hydropower generation, and other economic sectors, but also an increase in water demand and electricity, and therefore, a higher costs of these services to the consumer, among other consequences.
3.3 Proposed vulnerability index for hydroelectricity generation
A vulnerability index of the system was proposed, which is easy to apply based on maximum temperature and precipitation. According to the values shown in Table VI, and the analysis of the results shown in Table IV, it can be established certain ranges of influence of those variables on hydropower generation: low, medium and high based on temperature, and high, medium, slightly low, low and very low based on precipitation, in accordance with the sensitivity analysis of the system, whose results are shown in Table X.
The proposed index is:

Where:
VIRHG = Vulnerability Index in relation to Hydropower Generation
Tmaxr = Relative maximum temperature change index

Where "presence or not of Tmax" is equal to 1, if present, and equal to zero, if not present.
Influence degree could be equal to 1, 2 or 3.
PCPr = Relative precipitation change index

Where "presence or not of PCP" is equal to 1, if present, and equal to zero, if not present.
Influence degree could be equal to 1, 2, 3, 4 and 5.
Tables XI and XII show the calculation of Tmaxr and PCPr for models CCSRNIES–A21 and HadCM3–A21, and the corresponding values of maximum temperature and precipitation are selected from Table VI. These two scenarios were selected as examples of the results obtained, and from the results shown in Table VI, the CCSRNIES–A21 was the model showed the minimum change in temperature (0.5 °C), and almost no change in precipitation (0.2%). In contrast, the HadCM3–A21 model showed the greatest change in temperature (1.9 °C), and the greatest reduction in precipitation (–21%). When these values are applied to equation (1), greater reductions of monthly stream flows are obtained from the HadCM3–A21 scenario, than from the CCSRNIES–A21 scenario, and also with their corresponding impacts on water storage volumes and hydropower generation.
As specified in the methodology, the variables considered in the computational procedure were classified according to their presence or not in the different degrees of influence, and given the values of 1, if present, and zero if not present. Those variables were then multiplied by a coefficient according to the importance assigned to each category, and subsequently normalized by the sum of the weights, as part of the "quantification" process.
The vulnerability index in relation to hydropower generation (VIRHG) for the CCSRNIES–A21 and HadCM3–A21 models would be:
VIRHG = (1×0.17 +2×0.2)/3 = 0.19 (CCSRNIES_A21)
VIRHG = (1×0.5+2×0.33)/3 = 0.39 (HadCM3_A21)
As can be seen, the VIRHG index can only have values in the range 0.1 to 0.4, since the Tmaxr and PCPr can only have one value, according to the influence degree criteria. Evaluating both indexes at the upper and lower limits, results in the 0.1 to 0.4 range. Within this range, the vulnerability index criteria of the system can, in turn, be established as follows: low vulnerability, when VIRHG is ≤ 0.21; medium, when 0.22 ≤ VIRGH ≤ 0.28, and high, when VIRGH ≥ 0.29. These vulnerability index ranges were established taking into account the proportional relation of the distance between the upper and lower limits, and the number of categories considered in the total range. Applying the VIRGH index to all the scenarios shown in Table VI, it can estimated that the probability of a high vulnerability index is of 33.3%, medium vulnerability 22.2%, and low vulnerability 44.4% (see Table XIII). When applying the vulnerability index to projections over the broader time horizon of 2040 to 2069, it was found that some scenarios classified in the low and medium categories, would gradually move up into the category immediately above to that found for the period 2010 to 2039.
There are some precedents for the application of the proposed index in Ospina (2004), Ospina and Lema (2004) and Ospina and Lema (2005), by giving a treatment to the variables and quantitative analyses to overcome the limitations of nominal variables, and to apply sound qualification tests, and diverse series of analyses and inferences.
As it can be seen, the vulnerability index procedure is easy to apply, and is highly functional when attempting to integrate variables that are easy to measure and to obtain, in order to avoid high study costs and time consuming measurements. Its additive nature allows for the inclusion of other variables, for example, vegetation cover, erosion rates, sedimentation speed, and technical and operational efficiency. Replicating this vulnerability index procedure in different regions and hydropower generation projects, would bring this procedure closer to multivariate analyses, such as principal components analysis (PCA), factor analysis (FA), and cluster analysis (CA), resulting in a broader and better interpretation of the effects of climate change on systems similar to the one described in this paper. More detailed information on the construction, handling and statistical treatment of the indexes can be found in Ospina (2004), Ospina and Lema (2004), and Ospina and Lema (2005).
Furthermore, the projections of the climate change models applied in the Sinú–Caribe river basin showed higher temperature and less precipitation for most of the scenarios analyzed in the river basin (see Tables V and IX) and those changes in temperature and rainfall will definitely have an impact on other variables or processes such as increase of evaporation, reduction of natural stream flows and water availability, reduction of water storage volumes at reservoirs, and reduction on hydropower generation. Also, in other studies performed by IDEAM (2000) and Bernal (2000), it was also found that because of climate change, for different time periods and different scenarios, higher temperatures and less rainfall are expected in most of the hydrologic regions in which Colombia is divided. These projected conditions are highly sensitive because of the dependency that Colombia has on hydropower generation for satisfying the increasing demand of energy throughout the country, and the impact that hydropower generation shortages could have on the national economy.
4. Conclusions
The methodology proposed in this study integrates different tools and models that allow the incorporation of potential climate changes in the vulnerability analyses of water resources and related sectors, such as the hydropower generation system at the Sinú–Caribe river basin.
The sensitivity analysis and vulnerability index established for the hydropower generation system of the Sinú–Caribe river basin allowed to establish a probability of 44.4% that the system be classified as low degree vulnerability. This condition implies a range of 0 to 11% reduction in water storage volume at the reservoir, a 0 to 8.5% reduction in stream flows, and a 0 to 10% reduction in hydropower generation. The hydropower generation system had a 22.2% probability that the system be classified as medium degree vulnerability, and in this case a range of 12 to 16% reduction in water storage volume at the reservoir, a 8.5 to 20% reduction in stream flows, and a 11 to 22% reduction in hydropower generation. Finally, the hydropower generation system had a 33.3% probability that the system be classified as high degree vulnerability, with a reduction in water storage volume at the reservoir greater than 16%, a reduction in stream flows greater than 20%, and a reduction in hydropower generation greater than 22%.
The VIRHG index provided information on the trend and degree of effect that climate change could have on hydropower generation at the Sinú–Caribe river basin, and also allowed to keep track of the evolution of the hydropower system through the analysis of few variables that were both, easy to measure and highly indicative of the vulnerability of the hydropower system.
The weighted average scenario offered an alternative for identifying adaptation and mitigation strategies for the projected climate changes, because it included the projections of all the scenarios to prevent the most adverse effects of climate change, to contribute to the management and planning of hydropower generation, to reduce uncertainties, to avoid contingencies and overpricing, and to provide better information of how the hydropower system could be managed and operated.
As a result of the modeling procedure, it can be concluded that the reduction of hydropower generation over time could cause an increase in hydropower generation costs, which may be passed on to the consumer, provoking an imbalance in the supply–demand ratio, and affecting users and sectors that depend on water resources and hydropower generation.
Climatic variations, as a result of global warming, must be included in environmental impact studies and assessments, at sectoral level and in the planning, execution and scope of development projects since, as could be seen, these climatic variations give clear indications of the vulnerability and/or potentiality of future systems, providing better information to planners and decision–makers. This in turn, may result in lower management costs, better contingency plans, disaster reduction, and to improve the design and implementation of environmental strategies and policies.
Acknowledgements
The authors thank the Centro Virtual de Cambio Climático and to the Instituto de Ciencia y Tecnología del Distrito Federal (ICyTDF) for its financial support, enabling development of this research. Thanks to Claudio Amescua for his valuable comments about writing and document structure.
References
Arnell N., R. Compagnucci, L. da Cunha, K. Hanaki, C. Howe, G. Mailu, I. Shiklomanov, E. Stakhiv, 2001. Hydrology and water resources In: Climate Change 2001: Impacts, Adaptation, and Vulnerability. Contribution of Working Group II to the Third Assessment Report of the Intergovernmental Panel on Climate Change. (J. J. McCarthy, O. F. Canziani, N. A. Leary, D. J. Dokken, K. S. White, Eds.). Cambridge University Press, 192–233. [ Links ]
Bernal N., 2001. Aplicación del método de reducción de escala (statistical downscaling) al modelo climático global CCM3 en el territorio colombiano. Universidad Nacional de Colombia. Bogotá, 119 pp. [ Links ]
CAF, 2000. El Fenómeno El Niño 1997– 1998 Memoria, retos y soluciones Volumen III: Colombia. Corporación Andina de Fomento, Caracas, VE. 232 pp. [ Links ]
Gay C., 2000. México: una visión hacia el siglo XXI. El cambio climático en México. Resultados de los Estudios de Vulnerabilidad del País Coordinados por el INE con el Apoyo del U.S. Country Studies Program. SEMARNAP, UNAM, USCSP, 220 pp. [ Links ]
IDEAM, 2000a. Estudio Nacional del Agua. Instituto de Hidrología, Meteorología y Estudios Ambientales. Colombia, 39 pp. [ Links ]
IDEAM, 2000b. La Atmósfera, el tiempo y el clima. 2000. Instituto de Hidrología, Meteorología y Estudios Ambientales. Colombia, 80 pp. [ Links ]
IDEAM, 2000c. Flujo de materiales y energía en la economía colombiana. 2000., Instituto de Hidrología, Meteorología y Estudios Ambientales. Colombia, 52 pp. [ Links ]
IDEAM, 2001. Colombia: Primera Comunicación Nacional ante la Convención Marco de las Naciones Unidas sobre el Cambio Climático. Instituto de Hidrología, Meteorología y Estudios Ambientales. Colombia, 271 pp. [ Links ]
IPCC, 2001. Tercer Informe de Evaluación. "Impactos, adaptación y vulnerabilidad". Cambio climático. Parte de la contribución del Grupo de trabajo II al Tercer Informe de Evaluación Grupo Intergubernamental de Expertos sobre el Cambio Climático. OMM. PNUMA. 110 pp. [ Links ]
IPCC, 2001. Tercer Informe de Evaluación. "Mitigación". Cambio climático. Parte de la contribución del Grupo de trabajo III al Tercer Informe de Evaluación Grupo Intergubernamental de Expertos sobre el Cambio Climático. OMM. PNUMA. 95 pp. [ Links ]
IPCC, 2001. Special Report on Emission Scenarios. A Special Report of Working Group III. Published for the Intergovernmental Panel on Climate Change. 27 pp. [ Links ]
Lee A. H., J. Sieber. and Chris Swartz, 2005. WEAP. Water Evaluation and Planning System User Guide. Stockholm Environment Institute, Tellus Institute, 11 Arlington Street Boston, MA 02116–3411 USA, 176 pp. [ Links ]
Ospina J. E. and A. Lema, 2004. Indicadores cuantitativos de los impactos generados en proyectos de desarrollo lineales. Gestión y Ambiente 7, 91–112. [ Links ]
Ospina J. E. and A. Lema, 2005. Tratamiento estadístico para indicadores cuantitativos de impactos, aplicados a líneas de transmisión eléctrica. Revista Facultad Nacional de Agronomía, Medellín, Universidad Nacional de Colombia. 58, 2945–2961. [ Links ]
Ospina J. E., 2004. Propuesta de indicadores cuantitativos de los impactos por su grado de incidencia identificados por un modelo de gestión ambiental por dimensiones. Proyectos De Transmisión Eléctrica de ISA. Facultad de Minas. Universidad Nacional de Colombia. Sede Medellín, 186 pp. [ Links ]
Ospina J. E., 2009. Efectos del cambio climático en la generación hidroeléctrica con énfasis en proyecciones de generación–transmisión eléctrica en Colombia. Ph. D. Thesis on Atmospheric Physics. Programa de Posgrado en Ciencias de la Tierra. Universidad Nacional Autónoma de México. México D.F., 206 pp. [ Links ]
Ospina–Noreña, J. E., C. Gay–García, A. C. Conde, G. Sánchez–Torres Esqueda. 2009. Analysis of the water supply–demand relationship in the Sinú–Caribe Basin, Colombia, under different climate change scenarios. Atmósfera 22, 399–412. [ Links ]
Ospina–Noreña, J. E., C. Gay–García, A. C. Conde, V. O. Magaña, G. Sánchez–Torres Esqueda. 2009. Vulnerability of water resources in the face of potential climate change: generation of hydroelectric power in Colombia. Atmósfera 22, 229–252. [ Links ]
Sieber J. and D. Purkey, 2007. WEAP. Water Evaluation and Planning System User Guide for WEAP21. Stockholm Environment Institute. U.S. Center, 219 pp. [ Links ]
Trenberth K. E., A. Dai, R. M. Rasmussen and D. B. Parsons, 2003. The changing character of precipitation. Bull. Am. Meteorol. Soc. 84, 1205–1217. [ Links ]
UPME, 2005. Boletín Estadístico de Minas y Energía 1999–2005. Unidad de Planeación Minero Energética. Colombia, 132 pp. [ Links ]
UPME, 2005. Plan de Expansión de Referencia Generación–Transmisión 2006–2020. Ministerio de Minas y Energía. Unidad de Planeación Minero Energética. Colombia, 200 pp. [ Links ]
UPME, 2006. Plan Energético Nacional Contexto y Estrategias 2006–2025. Unidad de Planeación Minero Energética. Colombia, 240 pp. [ Links ]
Watson R., M. C. Zinyowera, R. H. Moss, 1998. The regional impacts of climate change: an assessment of vulnerability. Summary for policymakers. Report of IPCC Working group II, 16 pp. [ Links ]
Wilby R. L., C. W. Dawson and E. M. Barrow, 2001. SDSM – a decision support tool for the assessment of regional climate change impacts. Environmental and Modelling Software, 64 pp. [ Links ]

