


Servicios Personalizados
Revista

Articulo
 Inglés (pdf)
 Artículo en XML
 Referencias del artículo
 Enviar artículo por email
Indicadores
 Citado por SciELO
 Links relacionados
-
 Similares en
SciELO
Similares en
SciELO
Compartir

 Permalink
Atmósfera
versión impresa ISSN 0187-6236
Atmósfera vol.24 no.3 Ciudad de México jul. 2011
Winter aerosol and trace gas characteristics over a high–altitude station in the Western Ghats, India
S. KUMAR, P. C. S. DEVARA, M. G. MANOJ and P. D. SAFAI
Indian Institute of Tropical Meteorology, Dr. Homi Bhabha Road, Pashan, Pune 411 008, India. Corresponding author: P. C. S. Devara, e–mail: devara@tropmet.res.in.
Received March 19, 2009; accepted Juanuary 24, 2011
RESUMEN
Este artículo presenta la distribución espectral de la profundidad óptica de aerosoles (y su distribución de tamaño derivada), y la concentración de vapor de agua y ozono en la columna atmosférica total, en conjunto con la concentración de partículas en masa en el rango de tamaño entre 0.3 a 20 µm y la concentración de carbón negro en masa a nivel superficie durante cuatro diferentes campañas llevadas a cabo durante diciembre–enero–2006–2007 (Campaña I), febrero–2007 (Campaña II), enero–2008 (Campaña III) y noviembre–2008 (Campaña IV) en una estación ubicada a gran altitud, Sinhgad (18°22’N, 73°45'E, 1450 metros sobre el nivel del mar) en los Ghats Orientales de la Península Índica. La profundidad óptica de los aerosoles (AOD) medida dentro del rango espectral 440–1020 nm resulta menor en comparación con la AOD medida sobre una estación urbana cercana, Pune, pero relativamente más alta que la medida sobre otras estaciones remotas a gran altitud en la India. El exponente Angstrom de la columna derivado dentro del rango espectral de 440–870 nm mostró valores cercanos a 1 indicando una contribución relativamente alta de partículas en el modo fino al espectro del tamaño de aerosoles. De manera interesante, este parámetro muestra valores más bajos cuando la concentración total de aerosoles en masa exhibe valores más altos durante la tarde. Tanto la columna de vapor de agua (CWV) como la de ozono (TCO) presentan valores menores en la mañana y mayores en la tarde. La concentración en masa del carbón negro mostró una asociación con la AOD a lo largo del periodo de estudio sobre la estación. Las mediciones de las concentraciones en número de la superficie de partículas de aerosol son usadas para reconstruir el espectro de la AOD utilizando el paquete Optical Properties of Aerosols and Clouds (OPAC) y son comparadas con espectros de AOD de columnas disponibles de manera simultánea.
ABSTRACT
This paper presents spectral distribution of aerosol optical depth (and derived size distribution), water vapor and ozone in total atmospheric column; in conjunction with particulate mass concentration in the size range from 0.3 to 20 µm and black carbon mass concentration at the surface–level during four different campaigns, conducted in months of December–January–2006–2007 (Campaign I), February–2007 (Campaign II), January–2008 (Campaign III) and November–2008 (Campaign IV) at a high–altitude station, Sinhgad (18°22’N, 73°45’E, 1450 m AMSL) in the Western Ghats of Indian Peninsula. Aerosol optical depth (AOD) measured within the spectral range 440–1020 nm is found lower as compared to that measured over a nearby urban station, Pune; but relatively higher than that over other remote high–altitude stations in India. The columnar Angstrom exponent derived within the 440–870 nm spectral range showed maximum values close to 1 indicating relatively higher contribution from fine–mode particles to aerosol size spectrum. Interestingly, this parameter shows lower values when the total aerosol mass concentration exhibits higher values during afternoon hours. Both columnar water vapor (CWV) and ozone (TCO) exhibit lower values in the morning hours and higher in the afternoon hours. The mass concentration of black carbon shows an association with AOD during the study period over the station. The measured surface aerosol particle number concentrations are used to reconstruct AOD spectra using the Optical Properties of Aerosols and Clouds (OPAC) software package and compared with simultaneously available columnar AOD spectra.
Keywords: Sun/Sky radiometer, aerosol optical depth, black carbon, columnar water vapor and ozone, high–altitude station.
1. Introduction
Climate and climate change greatly affect human society and are of common concern to people across national and regional boundaries. At the same time, human activities in turn play an important role in climate change. There is a growing consensus that uncertainties in quantifying the aerosol direct and indirect effects on climate, particularly of anthropogenic origin, must be reduced through combined efforts involving both observational and modeling studies (IPCC, 2007). A key to understand these direct and indirect radiative forcing of aerosols is quantitatively characterizing aerosol properties on regional basis because both aerosol properties exhibit drastic spatial and temporal variations.
Increasing evidence suggests that the influence of aerosols on the energy and water cycles of the Earth’s system is significant (Ramanathan et al., 2001), and they cause profound changes in atmospheric circulation, which may in turn alter monsoon behavior (Lau et al., 2006; Lau and Kim, 2006), culminating sometimes into severe storms (Zhang et al., 2007). Despite rapid increase in the number of studies dealing with aerosol issues in recent years, it remains a daunting task to determine the extent of the influence exerted by aerosols, especially those produced by human activities on weather, climate and ecosystem. Unraveling this question is urgent in the heavily populated and rapidly developing regions of the world, where more than half of the world’s population resides. Changes in weather patterns and climate would affect the wellbeing of billions of people.
Fully accounting for aerosol effects on climate requires extensive measurements of aerosol optical, microphysical, chemical and radiative properties. Rarely is pure aerosol types found in the atmosphere, as they are generally mixtures of different types, which further increases the complexity of quantifying the effect that aerosols have on local and regional climate (Jacobson, 2000). Hence, aerosol optical properties are considered as one of the important global geophysical variables of paramount importance by the scientific community. Microphysical and chemical characteristics of aerosols are also gaining importance in the studies related to global change, and long–term measurements of these parameters at different locations spatially across the globe are important. Megacities are significant sources for aerosols and it is critical to understand the key chemical and physical processes controlling the concentrations of such species in those regions.
Over urban, rural and desert locations, aerosols behave entirely in different way as compared to the high–altitude stations. For example, measurements over high–altitude locations yield background aerosol levels against which the urban impacts can be compared and quantified. Moreover, these stations generally lie in the boundary layer during daytime and in the free troposphere during the nighttime, thus providing unique opportunity to investigate the transport/mixing of aerosols and gases from/between the boundary layer to/and the free troposphere. In order to address some of these issues, special observations of optical, microphysical and chemical properties of aerosols have been carried out during the winter season over Sinhgad, a high–altitude rural background station in the Western Ghats of Indian Peninsula. This station, possessing flat terrain, represents an ideal place for studying the impact of regional and long–range air mass transport on free troposphere/remote atmospheres.
2. Experimental site, setup and methodology
In the winters of 2006–2007–2008, four campaigns were conducted at a high–altitude station, Sinhgad (18°22´N, 73°45´E, 1450 m AMSL). The experimental site is situated approximately 40 km to the south–west of Pune. Figure 1a shows the geographical location of Sinhgad, which is a historical fort situated at a mountain top in the Western Ghats region of Indian Peninsula. The mountain top is a flat terrain with an area of about 500 m2. And surface is composed of rocks and rock dust. Although this place is a favored outing site for people in and around Pune, it is sparsely inhabited. The only local source of pollution is wood burning mainly for cooking and an intermittent small–scale vehicular traffic during daytime. Also, sometimes in winter, the villagers burn the dry grass along the slope of the hill to make the way for their transit. The experimental terrain forms a valley–like structure with the surrounding hills. Due to this, the anabatic (warm upslope) flow during daytime and katabatic (cold down–slope) flow during nighttime are prevalent over the site. And these flows aid in formation and dissipation of haze within/from the valley floor during winter.
The actual location where the instruments were installed is shown with an arrow in Figure 1b. All the instruments used in the present study are shown in Figure 1c. A Cimel Sun/Sky radiometer, installed on the terrace of a building adjacent to this experimental location, is shown in Figure 1d. The weather at Sinhgad is composed of four distinct seasons, marked with different air circulation pattern, namely monsoon (June – September), post monsoon (October – November), Winter (December to February) and Summer (March to May). During monsoon season this site remains under consistent cloud cover. Weather during November to February months, largely, comprises a synoptic northwesterly or northeasterly circulation, dry ambient atmosphere with RH ~30 to 70% and scanty rainfall. The temperature varies from 4 °C (nighttime) to 35 °C (daytime). The December month is the coolest of all months with lowest occurring nighttime temperature. Figure 2 shows the daytime average variation of temperature and humidity for the study period. The wind speed is highly variable (0 to 7 m/s) during daytime.
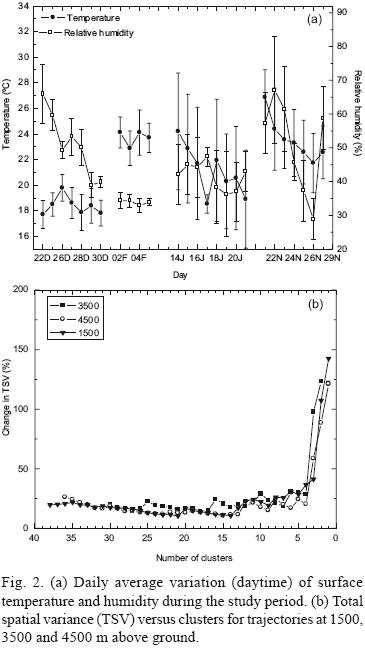
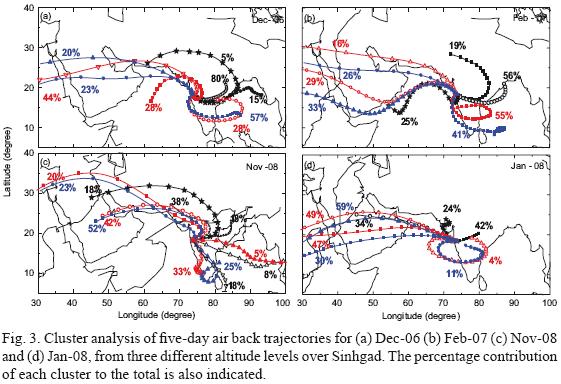
The analysis of back trajectories is a common and widely used approach for studying how atmospheric compounds and aerosols are transported from the source to receptor sites. A review of the calculation, use, and errors in back trajectories can be found in Stohl (1998). In order to establish the links between the synoptic air masses and the optical and microphysical properties of aerosols over Sinhgad, the 5–day air back–trajectories are analyzed for all days, campaign–wise, using the Hybrid Single Particle Lagrangian Integrated Trajectory (HYSPLIT; Draxler and Hess 1998; information available online at http://www.arl.noaa.gov/HYSPLIT.php) model. The trajectories are considered at three different height levels, namely, 1500, 3500 and 4500 m above ground. We separated the trajectories into different clusters, to ascertain the primary pathways that favor advection of aerosol particles originated elsewhere. The main criterion of the trajectory clustering is to minimize the variability among the trajectories within a cluster and maximize the variability between the clusters. Initially each trajectory is defined to a cluster, in other words if there are N trajectories there are N clusters. Now, for every combination of trajectory pairs, the cluster spatial variance (SPVAR) is calculated. SPVAR is the sum of the squared distances between the endpoints of the cluster’s component trajectories and the mean of the trajectories in that cluster. Then the total spatial variance (TSV), the sum of all the SPVAR, is calculated. The pairs of clusters combined are the ones with the lowest increase in TSV (which is initially zero). After the first iteration, the number of clusters is N – 1. Clusters paired always stay together. For the subsequent iterations, the clusters are either individual trajectory or the cluster that were initially paired. Again, every combination is tried, and the SPVAR and TSV for each are calculated. The iterations are continued until the last two clusters are combined. Initially during clustering iterations, the TSV increases faster, subsequently slowly and at a nearly constant rate. At some point in the iterations, it again increases rapidly, indicating that the clusters being combined are not very similar. This latter increase suggests where to stop the clustering and this can be seen by plotting percentage change in TSV versus number of clusters. The iterative step just before the large increase in the change of TSV gives the final number of clusters. It is readily seen from Figure 2b that the TSV increases abruptly when the number of cluster decreases to 2 or 3. The most acceptable value of cluster can thus be considered here as 4 or 3. Following the above procedure, the cluster mean trajectories and their percent contributions are evaluated for each campaign at different heights. These are shown in Figure 3a, b, c, d. It is readily noticed from Figure 3 that the cluster–mean trajectories distinctly change their orientation, traversing distinct geographic locations at different heights during different months. The percentage contribution of each cluster is also indicated in Figure 3.
The chemical makeup of aerosol is important to determine the optical properties of aerosols such as scattering, absorption, single scattering albedo and hence their radiative forcing. We used the software package OPAC (Hess et al., 1998) to derive the AOD spectra and compared them with the measured ones. The relevant aerosol components for this study are insoluble (INSO), water–soluble (WASO), soot, sea–salt (accumulation, coarse modes). For a given aerosol type (defined as new particles formed by mixture of above aerosol components), OPAC calculates the aerosol extinction, extinction coefficients, single scattering albedo, asymmetry parameter and optical depth. These parameters can also be obtained for different values of relative humidity. The results obtained on the derived AODs over Sinhgad using OPAC and their comparison with measured AODs are discussed in Section 3.3.
2.1 Instrumentation
The details of instruments operated during each campaign and number of observation/clear sky days, are presented in Table I. Keeping in view of the remoteness of the site in regard to many logistic aspects like electricity, weather etc., each campaign is planned to accommodate maximum possible number of observation days. The columnar AOD and water vapor measurements were made with a Cimel Sun/Sky radiometer manufactured by M/s Cimel Electronique, France. This radiometer essentially measures direct sun radiance at eight spectral channels between 440 and 1020 nm and diffuse sky radiances in the solar almucantar at four wavelengths (440, 675, 870, 1020 nm). Uncertainty in AOD measurements varies between 0.01 and 0.02. The methodology involved in the derivation of AOD has been described by Holben et al. (1998). Discussion on the retrievals of aerosol and columnar water vapor parameters from Cimel Sun/Sky radiometer data can be found in the works of Dubovik et al. (2000, 2002) and Smirnov et al. (2000). The sky radiometer used in the present study works within the framework of the Aerosol Robotic Network (AERONET) program, managed by NASA/GSFC.
Microtops II (Solar Light Co., USA), sunphotometer and ozonometer are hand–held photometers having 10 channels with central wavelengths at 305, 312, 320, 380, 440, 500, 675, 870, 940 and 1020 nm and FWHM (full width at half maximum) of ~ 2–10 nm. The field of view of each optical channel is 2.5°. Microtops II measures direct solar irradiance and gives instantaneous AODs, columnar water vapor content (CWV) and total columnar ozone (TCO). The performance and methodology of data acquisition with Microtops II have been described (Devara et al., 2001; Morys et al., 2001; Porter et al. 2001; Ichoku et al. 2002; Raj et al., 2004b). Collocated measurements of mass concentration of near–surface aerosols were also made using a GRIMM aerosol spectrometer (Model 1.108 of Grimm Aerosol Technik, Germany). This portable instrument gives single particle count or mass for size classifications in 15 size intervals (from 0.30 to >20 µm size), in real time. Ambient air is sampled by a volume controlled in–built pump at the flow rate of about 1.2 L/min. The flat light beam produced by a focused laser diode is passed through the sample. Each scattered signal generated crossing this beam is detected with a high speed photodiode at 90°, so that particle color changes can be neglected. This pulse is analyzed by an integrated pulse height analyzer and classified in 15 different size ranges and then counted. Data for every 5 minute interval was obtained and categorized into TSP, PM10, PM2.5, and PM1.0 size ranges.
Black carbon (BC) aerosol mass concentration (MB) was measured using a dual–channel (double–beam) aethalometer (Model AE–42 of Magee Scientific, USA). It uses a continuous filtration and optical transmission technique to measure the concentration of BC in near real–time and aspirates ambient air using both its inlet tube and pump at a flow rate of 3 L/min. Continuous observations on BC at 5 min time interval were obtained. More details on the instrument and operational technique are available elsewhere (Hansen et al., 1984; Safai et al., 2007). The measured values of MB were corrected for the changes in pressure and temperature following the method adopted by Moorthy et al. (2004). The filter based absorption technique used in aethalometer is reported to have shown good comparison with the other methods used for monitoring of BC particles (Allen et al., 1999; Babich et al., 2000). However, scattering and filter loading are the major primary corrections while using this method (Weingartner et al., 2003; Arnott et al., 2005). The uncertainties arising from the above mentioned factors could not be characterized for this data as they depend upon information on aerosol type (fresh/aged) and scattering coefficients.
3. Results and discussion
3.1 Aerosol optical depth (AOD)
Daily average variation of AOD at all four (common) wavelengths, measured during each campaign in Dec–06, Jan–07, Feb–07, Jan–08 and Nov–08, is shown in Figure 4a. Vertical lines at each data point represent ±1σ variation about the daily mean. Although the average AOD values during these campaign are more or less equal, the daily variations in AOD during campaign I, III and IV (December–2006, January and November 2008) are more pronounced than those in the campaign–II (February 2007), which is mainly due to haze formation at the valley floor by cold down–slope (katabatic) winds, caused by the valley–like terrain during early–winter/winter period, and their subsequent lifting/dissipation by up–slope (anabatic) winds during daytime over Sinhgad. These AOD values are compared with those measured at Pune (an urban site 40 km away from Sinhgad) in Figure 4b. The data archived on clear–sky days alike/close to the days of observations at Sinhgad, have been selected for comparison. Interestingly, the variations in AOD at Pune were also similar to those observed at Sinhgad, i.e. daily variability is more pronounced in December–2006, January and November 2008 than in February 2007.
Lower values of AOD at Sinhgad as compared to Pune may be attributed mainly to its location, but at the same time in comparison to other high–altitude stations such as Nainital (Pant et al., 2006a, b); the observed values are noticed to be high. This may be because Nainital is situated in a remote region while the site chosen in the present study has influence from the adjacent urban fast growing city, Pune which lies in the upwind direction during winter.
Angstrom wavelength exponent (α) is an important parameter that occupies a prominent role in modeling of the radiative effects of aerosols on the Earth–atmosphere system. It can be utilized to provide information on the relative influence of coarse–versus accumulation–mode aerosols. This parameter can be calculated by using the Angstrom’s (1964) empirical equation:
τaer = βλ–α
where β denotes Angstrom turbidity coefficient; the wavelength (λ) is in µm. In the present study, α is deduced from a least squares fit of ln (τaer) versus ln (λ) over a selected range of available wavelengths from the sunphotometer measurements (440 to 870 nm). The daily average values of α and β are shown in Figure 5a. These values are compared with those observed over Pune for the same/similar period (see figure caption) in Figure 5b. It is interesting to note that in all campaign α value is smaller at Sinhgad than at Pune. The average α values through out these campaign are 1.10 and 1.23 with range 0.88 to 1.23 and 0.82 to 1.44 for Sinhgad and Pune, respectively. This indicates that contribution from accumulation–mode particles to AOD is relatively more over Pune as compared to Sinhgad. However, the β values remained high at Pune as compared to Sinhgad throughout the period of study, as expected.
As the Angstrom exponent varies with wavelength, the more precise empirical relationship between aerosol extinction and wavelength, as suggested by Eck et al. (1999) is obtained with a second order polynomial fit:
ln(AOD)λ = a0 + a1 ln(λ) + a2 (ln(λ))2
where the coefficient a2 accounts for a curvature (spectral variation of τ w.r.t. λ) often observed in Sun photometry measurements. The curvature can be an indicator of the aerosol particle size, with negative curvature indicating aerosol size distribution dominated by the fine–mode and positive curvature indicating size distribution with a significant contribution by the coarse–mode.
The values of the derivative of α with respect to the logarithm of the wavelength, which is a measure of rate of change of slope, have been computed following Eck et al. (1999) using 440, 675 and 870 nm wavelengths for both the sites, and shown in Figure 5a, b. Large positive values (negative curvature) of α´ are characteristic of fine–mode dominated aerosol size distributions, while near zero and negative values (positive curvature) are characteristic of size distributions with a dominant coarse–mode or bimodal distributions with coarse–mode aerosols having a significant relative magnitude (Eck et al., 1999; O’ Neill et al., 2001; Kaskaoutis et al., 2007). Thus, from the prevailing values of α´ (Fig. 5a), it is clear that contribution by the coarse–mode particles is low, barring a few days in Jan–07/08, while maximum contribution to the AOD is by fine–mode particles, possible due to anthropogenic aerosols either locally generated (domestic cooking) or advected through long–range transport. The variability in α´ values can be ascertained from Figure 3, the values during Dec–06 and Feb–07 remained close to one represented by the trajectories during this time of the year, whereas during Jan–08 and Nov–08 there is drop and rise in α´ values with corresponding changes in trajectories. As seen from Figure 3, in Jan–08 trajectories predominantly from west (Sahara/Arabian Sea) and in Nov–08 from Indian landmass. Over Pune α´ has values close to 0.5 or negative, indicating the presence of mixed type or coarse–mode aerosol particles.
3.2 Columnar water vapor (CWV) and total column ozone (TCO)
Figure 6a shows the daily variation of CWV, where the error bars indicate ±1s variation. Campaign–wise, daily mean values of CWV vary from 0.59 to 0.98 (I), 0.91 to 1.02 (II), 0.58 to 0.82 (III), and 0.29 to 0.76 cm (IV). The maximum (1.02 ± 0.08) and minimum (0.29 ± 0.07) values of CWV are found during campaign II and IV, respectively. It is known that a relationship exists between measure of the water vapor content of the air near the surface and the amount of moisture aloft. In order to examine if a relationship exist between CWV and surface relative humidity (RH), the day to day variations in RH and CWV are shown plotted in Figure 6a. The daily variability in both parameters seems to be similar. In the present study, CWV during daytime (0730 to 1800, LT) showed a consistent and systematic diurnal variation on all the days of observation. The diurnal variation that was typically observed during these campaign is shown in Figure 6b. Albeit there is considerable day–to–day variability in CWV, the trend of this variability appears similar i.e. low in the morning and relatively high in the afternoon for all the days considered in the study. It is interesting to note that diurnal variation in CWV at Pune also shows low similar variation during November to February months (Raj et al., 2004a). This gives an idea of how the daytime diurnal behavior of CWV over an urban site resembles from that of a remote background station. Unlike over Pune, the diurnal variation in CWV over Sinhgad may be attributed to solar heating, which brings up moisture, as the day progresses, confined to low lying areas in the surrounding valleys.
Ozone concentration in the atmosphere exhibits significant variation in space and time because it is influenced in many ways by its sources, sinks and chemical reactions. Chemical reactions involving ozone formation and removal occur within a timescale of a few hours. Therefore examining ozone diurnal pattern is an important way to understand its dynamics. The daytime diurnal variations of TCO for a few representative days observed during these campaign are shown in Figure 6c. The TCO measurements could not be made during campaign I due to some technical problems with the instrument. These problems were rectified during rest of the campaign. A look at the available data suggests that the diurnal pattern is distinctly different in different months, with reasonably good repeatability in a particular month. It is clear from the figure that, on all the days (except on 26 November 2008), the TCO starts increasing from morning, peaks during the afternoon hours and thereafter decreases during evening hours. This is considered to be due to the strong photochemical activity during afternoon hours. The campaign–wise daily mean TCO values are in the range of 280–289, 249–286 and 259–264 DU respectively. Small scale, but multiple, controlled fire activities (fire lit by villagers to make way for their transit and also to avoid forest fire) were observed on 16 and 17 January 2008 around the observation site. This could be one of the reasons for high variation in TCO as well as AOD on those days. It is interesting to note that diurnal variation in TCO at Pune shows two maxima, one in the morning and the other in the afternoon hours during November to February months with wider range of values from around 201 to 290 DU (Raj et al., 2004b). This gives an idea of how the daytime diurnal behavior of TCO differs from a high–altitude remote background station to an urban station.
3.3 Near–surface aerosol measurements
Simultaneous columnar and near–surface aerosol measurements are available during campaigns I, III and IV conducted in December 2006, January 2008 and November 2008, respectively. Figure 7 shows the daily average variations of near–surface BC, PM10 mass concentrations observed during these campaign. The AOD, CWV and BC values observed in the present study at Sinhgad have been compared with those of another high–altitude location (Nainital, India) in Table II. The values at Pune appear to be greater as compared to Nainital due to main reasons such as (i) location of measuring station and (ii) sources contributing to the constituents at both places.
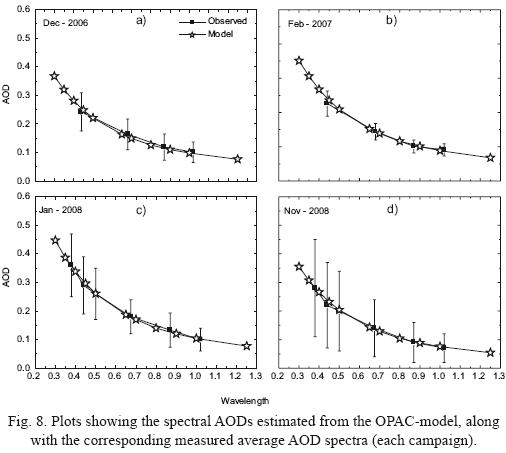
Aerosol properties are highly variable in space and time and it is difficult to model aerosol climatology at any location. However, an attempt is made in OPAC model, which reduces the variability of naturally occurring aerosols and clouds to typical cases, without neglecting possible fluctuations (Hess et al., 1998). The chemical composition of TSP and observed soot concentrations have been used in conjunction with OPAC model to determine certain optical properties of aerosols like AOD, SSA and asymmetry factor. There are ten different aerosol models available in OPAC. Based on the physicochemical history of aerosols over the experimental site, we have used a new mixture, consisting of five aerosol components i.e. water soluble, insoluble, soot or BC, sea–salt accumulation mode and sea–salt coarse mode.
The relative humidity measurements over Sinhgad on the observational days are taken into account for the estimation of AOD using OPAC. The mean relative humidity is found to be close to 50%. We maintained the aerosol components that form the aerosol type but changed the number concentrations of individual component to derive the AODs. The AODs are estimated for each campaign using different combinations of the components. In Figure 8a–d the mean observed AOD spectra for the entire campaign are plotted along with the OPAC estimated AODs for the observed mean relative humidity. The number and mass density of aerosol components used to estimate the AODs for the mean RH value are given in Table III.
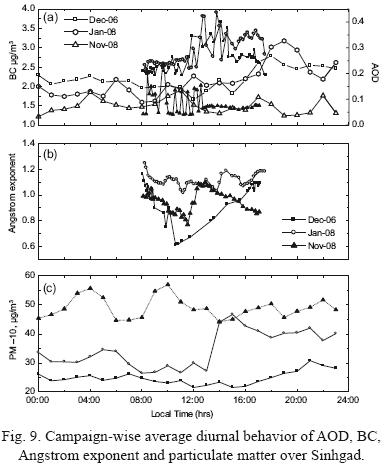
The average diurnal variations (each campaign separately) of near–surface BC, PM10 mass concentrations, columnar AOD and Angstrom exponent are shown plotted in Figure 9 (a, b, c). It is evident from Figure 9a that columnar AOD is high when near–surface BC mass concentration is minimum implying mass contribution from abundance of scattering aerosols to the AOD as compared to those of absorbing aerosols over the site. The time variation in Angstrom exponent (indicator of aerosol size distribution) is compared with near–surface size–segregated aerosol concentration recorded by GRIMM spectrometer in Figure 9b. The pattern appears to be the same for all other days too, i.e. dawn and dusk peaks, with campaign wise varying amplitude. Subsequently, values decrease gradually and the lowest values are observed in and around noon hours. Interestingly, the columnar Angstrom exponent is found to show lower values indicating predominance of larger particles during afternoon hours over the station. The low mass concentration contribution from smaller aerosol particles also confirms this feature.
4. Conclusions
Four special campaigns, during different months, were conducted at a high–altitude station, Sinhgad, in the Western Ghats region of Indian Peninsula in the span of 2006–2007–2008. The measurements include column–integrated (columnar) as well as surface–level properties of aerosols and precursor gases. The results of the analysis indicated the following:
Spectral dependence of AOD showed higher values at smaller wavelengths and viceversa. AODs during campaigns I, III and IV exhibited more variability than during campaign II. AODs observed at Sinhgad are quite low as compared to Pune, a nearby urban site, mainly due to less anthropogenic activities over this high altitude station.
Angstrom wavelength exponent indicated the presence of fine/accumulation–mode to coarse–mode particles. Their diurnal pattern depicts larger values (abundance of fine– or accumulation–mode particles) during forenoon and evening, and lower values (dominance of coarse–mode particles) during noon hours. Diurnal pattern of BC aerosols also showed similar variation indicating presence of BC in fine/accumulation mode.
Columnar water vapor showed considerable variation, during all campaign, with minimum value in the morning and maximum in the afternoon hours. The mean values are found to be smaller in comparison to that over an urban station, Pune.
The diurnal variation in TCO over Sinhgad showed single maximum around noon hours unlike over an urban site, Pune, where it shows dual maxima, one in the forenoon and another in the evening hours.
The temporal variations in near–surface mass–size distribution of particulate matter including black carbon aerosols showed an association with columnar AOD and aerosol size distribution, suggesting significant contribution of aerosols at surface to the air column at the experimental site.
Acknowledgements
The authors are highly thankful to the anonymous reviewers for their insightful comments and valuable suggestions. The research work reported here was carried out under the ISRO–GBP/ARBS Project. Authors are thankful to AERONET Federation for their support. ARL, NOAA is acknowledged for providing the HYSPLIT transport and dispersion model and wind data used in the air back trajectory analysis. The authors are thankful to the authorities of BSNL, Pune at Sinhgad site and the Director, IITM for necessary support.
References
Allen G. A., J. Lawrence and P. Koutrakis, 1999. Field validation of a semi continuous method for aerosol BC (aethalometer) and temporal patterns of summertime hourly BC measurements in south western PA. Atmos. Environ. 33, 817–823. [ Links ]
Angstrom A., 1964. The parameters of atmospheric turbidity. Tellus 16, 64–75. [ Links ]
Arnott W. P., K. Hamasha, H. Moosmüller, P. J. Sheridan and J. A. Ogren, 2005. Towards aerosol light–absorption measurements with a 7–wavelength aethalometer: evaluation with a photo acoustic instrument and 3–wavelength nephelometer. Aerosol Sci. Tech. 39, 17–29. [ Links ]
Babich P. C., M. Davey, G. A. Allen and P. Koutrakis, 2000. Method comparisons for particulate nitrate, elemental carbon and PM2.5 mass in seven U.S. cities. J. Air Waste Manage. Assoc. 5D, 1095–1105. [ Links ]
Devara P. C. S., R. S. Maheskumar, P. E. Raj, K. K. Dani and S. M. Sonbawne, 2001. Some features of columnar aerosol optical depth, ozone and precipitable water content observed over land during the INDOEX–IFP 99. Meterol. Zeitschrift 10, 123–130. [ Links ]
Draxler R. R. and G. D. Hess, 1998. An overview of the HYSPLIT_4 modeling system for trajectories, dispersion, and deposition. Aust. Meteor. Mag. 47, 295–308. [ Links ]
Dubovik O. and M. D. King, 2000. A flexible inversion algorithm for retrieval of aerosol optical properties from Sun and sky radiance measurements. J. Geophys. Res. 105, 20 673–20 696. [ Links ]
Dubovik O., B. N. Holben, T. F. Eck, A. Smirnov, Y. J. Kaufman, M. D. King, D. Tanre´ and I. Slutsker, 2002. Variability of absorption and optical properties of key aerosol types observed in worldwide locations. J. Atmos. Sci. 59, 590–608. [ Links ]
Dumka U. C, K. Krishna Moorthy, S. K. Satheesh, R. Sagar and P. Pant, 2008. Short–period modulations in aerosol optical depths over the Central Himalayas: Role of mesoscale processes. J. Appl. Meteor. Climatol. 47, 1467–1475 [ Links ]
Eck T. F., B. N. Holben, J. S. Reid, O. Dubovic, A. Smirnov, N. T. O'Neil, I. Slutsker and S. Kinne, 1999. Wavelength dependence of the optical depth of biomass burning, urban, and desert dust aerosols. J. Geophys. Res. 104, 31 333–31 349. [ Links ]
Hansen A. D. A., H. Rosen and T. Novakov, 1984. The aethalometer: an instrument for the real time measurements of optical absorption by aerosol particles. Sci. Total Environ. 36, 191–196. [ Links ]
Hess M., P. Köpke, and I. Schult, 1998. Optical properties of aerosols and clouds: The software package OPAC. Bull. American Met. Soc. 79, 831–844. [ Links ]
Holben B. N., T. F. Eck, I. Skitske, D. Tanré, J. P. Bziis, A. Setzer, E. Vermote, J. A. Reagan, Y. J. Kazlfnzan, T. Nnknjima, F. Lauemi, I. Jankozoink and A. Smirnov, 1998. AERONET—A federated instrument network and data archive for aerosol characterization. Remote Sens. Environ. 66, 1–16. [ Links ]
Ichoku C., R. Levy, Y. Kaufman, L. A. Remer, R. R. Li, V. J. Martins, B. N. Holben, N. Abuhassan, I. Slutsker, T. F. Eck and C. Pietras, 2002. Analysis of the performance characteristics of the five–channel Microtops II Sun photometer for measuring aerosol optical thickness and precipitable water vapor, I. Geophys. Res. 107, 4179, doi:10.1029/2001JD001302. [ Links ]
IPCC, 2007. Summary for Policymakers. In: Climate change 2007: The physical science basis. Intergovernmental Panel on Climate Change. (S. Solomon, D. Qin, M. Manning, Z. Enhen, M. Marquis, K. B. Averyt, M. Tignor and H. L. Miller, Eds.). Cambridge University Press, Cambridge, United Kingdom and New York, USA, 1056 pp. [ Links ]
Jacobson M. Z., 2000. A physically–based treatment of elemental carbon optics: Implications for global direct forcing of aerosols. Geophys. Res. Lett. 27, 217–220. [ Links ]
Kaskaoutis D. G., H. D. Kambezidis, N. Hatzianastassiou, P. G. Kosmopoulos and K. V. S. Badarinath, 2007. Aerosol climatology: dependence of the Angstrom exponent on wavelength over four AERONET sites. Atmos. Chem. Phys. Discussion 7, 7347–7397. [ Links ]
Lau K. M., M. K. Kim and K. M. Kim, 2006. Asian monsoon anomalies induced by aerosol direct effects. Clim. Dyn. 26, 855–864. [ Links ]
Lau K. –M. and K. –M. Kim, 2006. Observational relationships between aerosol and Asian monsoon rainfall, and circulation. Geophys. Res. Lett. 33, L21810. [ Links ]
Moorthy K. K., S. S. Babu, S. V. Sunil Kumar, P. K. Gupta and B. S. Gera, 2004. Altitude profile of aerosol BC, derived from aircraft measurements over an inland urban location in India. Geophys. Res. Lett. 31, L22103. [ Links ]
Morys M., F. M. Mims III, S. Hagerup, S. E. Anderson, A. Backer, J. Kia and T. Walkup, 2001. Design, calibration and performance of Microtops II hand–held ozone monitor and sun photometer, J. Geophys. Res. 106, 14 573–14 582. [ Links ]
O’Neill N. T., T. F. Eck, B. N. Holben, A. Smirnov, O. Dubovik and A. Royer, 2001. Bimodal size distribution influences on the variation of Angstrom derivatives in spectral and optical depth space. J. Geophys. Res. 106, 9787–9806. [ Links ]
Pant P., P. Hegde, U. C. Dumka, R. Sagar, S. K. Satheesh, K. K. Moorthy, A. Saha and M. K. Srivastava, 2006a. Aerosol characteristics at a high–altitude location during ISRO–GBP Land Campaign–II. Current Sci. India 91, 1053–1061. [ Links ]
Pant P., P. Hegde, U. C. Dumka, R. Sagar, S. K. Satheesh, K. K. Moorthy, A. Saha and M. K. Srivastava, 2006b. Aerosol characteristics at a high–altitude location in central Himalayas: Optical properties and radiative forcing. J. Geophys. Res. 111, D17206. [ Links ]
Porter J. N., M. Miller, C. Pietras, and C. Motell, 2001. Ship–based sunphotometer measurements using Microtops sun photometers, J. Atmos. Oceanic Technol. 18, 765–774. [ Links ]
Raj P. E., P. C. S. Devara, R. S. Maheskumar, G. Pandithurai, K. K. Dani, S. K. Saha, S. M. Sonbawne and Y. K. Tiwari, 2004a. Results of sun photometer–derived precipitable water content over a tropical Indian station. J. Appl. Meteorol. 43, 1452–1459. [ Links ]
Raj P. E., P. C. S. Devara, G. Pandithurai, R. S. Maheskumar, K. K. Dani, S. K. Saha and S. M. Sonbawne, 2004b. Variability in Sun photometer–derived total ozone over a tropical urban station. J. Geophys. Res. 109, D08309. [ Links ]
Ramanathan V., P. J. Crutzen, J. T. Kiehl and D. Rosenfeld, 2001. Aerosols, climate and the hydrologic cycle. Science 294, 2119–2124. [ Links ]
Safai P. D., S. Kewat, P. S. Praveen, P. S. P. Rao, G. A. Momin, K. Ali and P. C. S. Devara, 2007. Seasonal variation of black carbon aerosols over a tropical urban city of Pune, India. Atmos. Environ. 41, 2699–2709. [ Links ]
Smirnov A., B. N. Holben, T. F. Eck, O. Dubovik and I. Slutsker, 2000. Cloud screening and quality control algorithms for the AERONET data base. Remote Sens. Environ. 73, 337–349. [ Links ]
Stohl A., 1998. Computation, accuracy and applications of trajectories: A review and bibliography. Atmos. Environ. 32, 947–966. [ Links ]
Weingartner E., H. Saatho, M. Schnaiter, N. Streit, B. Bitnar and U. Baltensperger 2003. Absorption of light by soot particles: determination of the absorption coefficient by means of aethalometers. J. Aerosol Science 34, 1445–1463. [ Links ]
Zhang R., G. Li, J. Fan, D. L. Wu and M. J. Molina, 2007. Intensification of Pacific storm track linked to Asian pollution. Proc. Natl. Acad. Sci. USA, 104, 5295–5299. [ Links ]

