


Servicios Personalizados
Revista
Articulo
 Inglés (pdf)
 Artículo en XML
 Referencias del artículo
 Enviar artículo por email
Indicadores
-
 Citado por SciELO
 -
 Accesos
Links relacionados
-
 Similares en
SciELO
Similares en
SciELO
Compartir

 Permalink
Atmósfera
versión impresa ISSN 0187-6236
Atmósfera vol.24 no.3 Ciudad de México jul. 2011
Numerical simulation of wind gusts in intense convective weather and terrain–disrupted airflow
P. W. CHAN, C. C. LAM and P. CHEUNG
Hong Kong Observatory, 134A Nathan Road, Kowloon, Hong Kong, China. Corresponding author: Mr. P.W. Chan; email: pwchan@hko.gov.hk
Received June 2, 2010; accepted February 8, 2011
RESUMEN
Las ráfagas o rachas de viento son un elemento importante en el pronóstico del clima. Las ráfagas asociadas con chubascos convectivos pueden ocasionar daños a la población. En meteorología aeronáutica, las aeronaves no pueden aterrizar en pistas con rachas de viento cruzado, lo cual puede afectar el tráfico aéreo y la eficiencia del aeropuerto. El método convencional de pronóstico de ráfagas está basado principalmente en la información climatológica de viento de viento en exceso debido a rachas por encima del viento medio para diferentes condiciones a escala sinóptica y mesoescla (p. ej. líneas de chubascos subtropicales, flujo monsónico, situaciones de ciclones tropicales, etc.). Este artículo utiliza una aproximación física al estimado de ráfagas de viento en la predicción numérica de clima de meso a microescla (NWP), esto es, se basa en la energía cinética turbulenta y el movimiento vertical del aire tal como es aplicado en la versión 4.4 del Sistema Regional de Modelamiento Atmosférico (RAMS), y examina su desempeño bajo diferentes condiciones de rachas de viento en el Aeropuerto Internacional de Hong Kong (HKIA). Para los eventos típicos de ráfagas de viento considerados en el artículo, se encuentra que el desempeño del estimado de estas rachas es satisfactorio cuando se compara con las mediciones de viento en el aeropuerto (caso "sí–sí", esto es, las ráfagas de viento real son capturadas por el método de estimación de rachas de viento). Para demostrar que el método no sobrestima las ráfagas (caso "nulo–nulo", esto es, los vientos menos intensos no son exagerados en el estimado), también se estudia un evento de viento moderado ordinario que cruza las montañas en el aeropuerto y el estimado de la ráfaga resulta razonablemente cercano a los datos reales. El estimado de las ráfagas es aparentemente afectado por el tratamiento de la turbulencia en el modelo NWP. Como tal, se llevó a cabo un estudio de sensibilidad sobre el impacto de la selección de los diferentes esquemas de parametrización de la turbulencia disponibles en el modelo RAMS 4.4 sobre la estimación de las ráfagas para el caso de un flujo de aire por terreno perturbado.
ABSTRACT
Wind gust is an important element in weather forecasting. Gusts associated with squalls in intense convective weather may bring about injuries to the public. In aviation meteorology, the aircraft may not attempt to land on the runway in gusty crosswinds, which could disrupt air traffic and adversely affect airport efficiency. The conventional method of gust forecasting is mainly based on climatological information of wind excess due to gust on top of the mean wind for different synoptic and mesoscale conditions (e.g. subtropical squall line, monsoonal flow, tropical cyclone situation, etc.). This paper uses a physical approach to wind gust estimate in meso to microscale numerical weather prediction (NWP), namely, based on turbulent kinetic energy and vertical air motion as applied to Regional Atmospheric Modelling System (RAMS) version 4.4, and examines its performance in different conditions of gusty winds at the Hong Kong International Airport (HKIA). For the typical gusty wind events considered in the paper, the performance of the wind gust estimate is found to be satisfactory in comparison with actual wind measurements at the airport (yes–yes case, viz. the actual gusty winds are captured by the wind gust estimate method). To demonstrate that the method does not over–estimate the gust (null–null case, viz. the less gusty winds are not exaggerated in the estimate), an ordinary, moderate wind event with the winds crossing the mountains at the airport is also studied, and the estimated gust is reasonably close to the actual data. Gust estimate is apparently affected by the treatment of turbulence in the NWP model. As such, a sensitively study is also conducted on the impact of selecting different turbulence parameterization schemes available in RAMS 4.4 on the estimation of wind gusts for a case of terrain–disrupted airflow.
Keywords: Wind gust, squall line, terrain–disrupted airflow, tropical cyclone.
1. Introduction
Wind gust is an important element in the forecasting of local weather. It could have significant impact on the safety of the public and the operation of certain business such as container port and construction work. The destruction associated with the gusts may be much larger than the mean wind itself, particularly in conditions when the mean wind is light. People working in the exposed area may need to take prompt action within a short period of time in order to protect themselves against the impact of gusty winds. For instance, on 9 May 2005, a squall line along coastal area of southern China brought strong gusts to Hong Kong. At the container port of the territory, some empty containers were blown to collapse under the gust, causing one death and two injuries. In aviation meteorology, gust could have great impact on the operation of the airport, particularly in strong crosswind situation when the pilots may need to make difficult maneuver in attempting to land on a runway. Accurate forecast of the gust, such as in tropical cyclone situation, would facilitate the smooth operation of the airport in strong crosswind and minimize air traffic disruption.
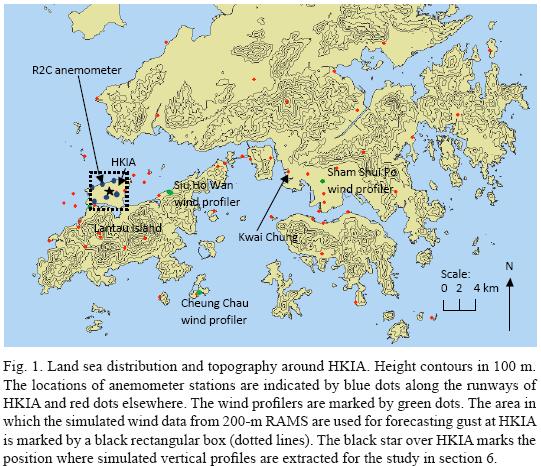
Traditionally, wind gust estimate is mainly based on climatological information of the wind excess due to gust on top of the mean wind in different weather conditions. In a subtropical coastal area like Hong Kong, gust climatology may be formulated in synoptic patterns like northeast monsoon in the winter, strong easterly winds under stable boundary layer in the spring, southwest monsoon in the summer, intense convective weather like squall lines, and tropical cyclone situations. Wind gust forecasting is more challenging at HKIA due to the complex terrain in the vicinity. The airport is built on a reclaimed island with the mountainous Lantau Island to the south (Fig. 1). The hills could reach 1000 m above mean sea level with valleys as low as 300 m in between. Winds from east to southwest may be disrupted by the terrain and give rise to strong gusts in favourable weather condition. As a result, gust climatology not only needs to consider the synoptic weather pattern, but also takes into account the mesoscale and even microscale features as well such as convective rain cells and terrain–induced airflow disturbances.
This paper aims to study the possibility of using a more objective estimation method of wind gust given the complicated condition at HKIA. The basis is a numerical weather prediction (NWP) model with high spatial resolution, and a physical approach to wind gust estimate. The Regional Atmospheric Modelling System (RAMS, Cotton et al., 2003) version 4.4 is employed. It has been found to give satisfactory results in the simulation of microscale airflow disturbances and turbulent winds arising from the complex terrain of Lantau Island (Szeto and Chan, 2006; Chan, 2007). In the simulation of a squall line case, the horizontal resolution down to 1.33 km is employed in the present study in order to resolve the convection explicitly. For terrain–disrupted airflow, the resolution is increased further to 200 m so that the complex terrain of Lantau Island could have a reasonable representation in the numerical model. The wind gust estimate is based on turbulent kinetic energy and vertical air motion from the RAMS simulation results (Brasseur, 2001).
The present paper is organized as follows. The wind gust estimation method is briefly described in Section 2. Some typical cases of gusty winds in Hong Kong are considered in this paper. Section 3 discusses the gust associated with a subtropical squall line. Section 4 covers airflow disruption due to Lantau terrain, namely, easterly flow in the spring, intense southwest monsoon in the summer, and east to southeasterly winds associated with a tropical cyclone. The above cases refer to yes–yes situation, namely, using the numerical model and wind gust estimation method to capture the gusty winds as measured in reality. To demonstrate that the present method does not exaggerate the gust in non–gusty wind situation (i.e. null–null case), an ordinary, moderate wind case with the winds crossing the mountains of Lantau Island is considered in section 5. Gust estimate is apparently affected by the treatment of turbulence in the NWP model. As such, a sensitively study is also conducted in section 6 on the impact of selecting different turbulence parameterization schemes available in RAMS 4.4 on the estimation of wind gusts for a case of terrain–disrupted airflow. The conclusions of this paper are drawn in section 7.
2. Wind gust estimate
The wind gust estimate method in Brasseur (2001) is adopted in this study. It is based on the assumption that the air parcel at a given height could reach the ground if the mean turbulence kinetic energy (TKE) is greater than the buoyancy energy between the ground and the height of the parcel:

where zp is the height of the parcel considered, e the TKE, g the acceleration due to gravity, Θ the virtual potential temperature, and Δθv the variation of virtual potential temperature over a given layer. The gust is the maximum wind speed of all parcels in the boundary layer satisfying Eq. (1).
Brasseur (2001) also gives a lower bound and an upper bound of the gust estimate. The lower bound is obtained based on the consideration of the local TKE instead of the mean TKE, with an equation similar to (Eq. 1) but replacing the left hand side by (2.5/11)e(z). The upper bound is given by the maximum wind speed in the boundary layer. Following Brasseur (2001), the boundary layer depth is defined as the height where the TKE is 0.01 of the surface value.
Brasseur (2001) also discusses gust estimate in deep convection. Following his suggestion, the downdraft is also added to the horizontal wind speed in estimating the wind gust in this study.
Since TKE is not prognosticated in the model, it is calculated from the model variables using the following equation in Goyette et al. (2003):

where B1 is an empirical parameter fixed at 16.6, lm the Blackadar mixing length, Kh the turbulent transfer coefficient for heat, S the vertical shear of horizontal velocity, Pr the Prandtl number and Ri the Richardson number.
3. Subtropical squall line case
Wind gust associated with a typical subtropical squall line on 9 May 2005 is considered in this section. The model setup is described in Section 3.1, brief description of the event is given in Section 3.2 and the results of the numerical simulation are discussed in Section 3.3.
3.1 Model setup
RAMS 4.4 is nested with the four dimensional variation analysis (4D VAR) version of the Regional Spectral Model (RSM) of the Hong Kong Observatory (HKO), which has a horizontal resolution of 20 km (Yeung et al., 2005). The 4D VAR RSM uses radar–based rainfall estimate to adjust the dynamic and thermodynamic fields of the model. The squall line is reasonably well analyzed in this model at the start of the simulation (8 a.m., 9 May 2005, local time = UTC + 8 hours) because at that time it was located in the inland areas of southern China, which is within the radar coverage of Hong Kong. In the 4D VAR RSM forecast, a bow–shaped heavy rain area moves across Hong Kong in the early afternoon of 9 May 2005 (Fig. 2), consistent with the actual observations. However, the wind change in Hong Kong is not well simulated – southwesterly flow is forecast to prevail over the territory in the whole event and northwesterly squall is not predicted. This may be partly attributable to the coarse model grid.

Two nested runs of RAMS are performed with a horizontal resolution of 4 km (grid 1) and 1.33 km (grid 2). The model domains are shown in Figure 3. RAMS is again initialized at 8 a.m., 9 May 2005 and run for 8 hours. Cumulus parameterization is switched off for direct cloud scale simulations. Turbulent mixing at the top of the cloud/updraft is reduced by setting a flag in the turbulence module following the experience in the simulation of tropical cyclones (Mel Nicholls, private communication), in which dry Brunt–Väisälä frequency is used in the turbulence term instead of the moist one. The Smagorinsky turbulence scheme is employed, without the use of the TKE equation.

3.2 Brief description of the event
A trough of low pressure affected the inland area of southern China in the morning of 9 May 2005. A squall line developed in the strong southwesterly flow ahead of the trough and moved southeastward to Hong Kong. It swept across the territory between noon and 1 p.m., bringing gusts of about 20 m/s to HKIA and more than 30 m/s to some other places in Hong Kong (Fig. 4). The largest gust was recorded at the container terminal at Kwai Chung (location in Fig. 1), reaching 37.6 m/s. A more detailed account of the event could be found in Lam and Lam (2006).
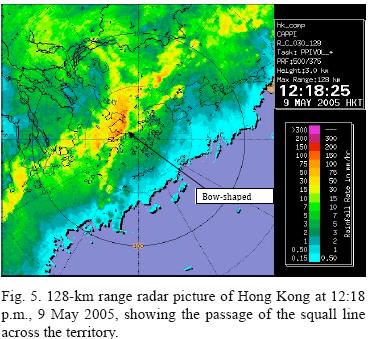
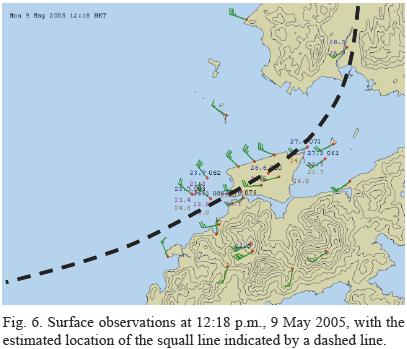
On the radar display, a bow–shaped echo was observed when the squall line moved across Hong Kong (Fig. 5). Strong southwesterly wind prevailed at the surface ahead of this intense radar echo with northwesterly flow at its rear (Fig. 6). The passage of the squall line at a location showed up as a rapid change of the wind direction (from southwest to northwest) and a sharp peak in the wind speed (associated with the squall) in a matter of several minutes. Figure 7 gives a typical example of the wind trace of an anemometer in this event. It shows that the southwesterly flow ahead of the squall line was rather gusty, with a mean wind of about 10 m/s and the gust reaching 16 m/s or so. The squall line moved past that anemometer at about 12:18 p.m. and the gust reached a maximum of 21 m/s in the northwesterly flow. The wind remained northerly for about half an hour afterwards, and became significantly weaker and less gusty. The temperature at HKIA also dropped from a high of 27 °C to about 21 °C. This was the period when the cold pool behind the squall line affected the territory. Starting from around 1:20 p.m., winds turned to southeast and the temperature rose again after the passage of the cold pool.

Measurements from the wind profiler at Sham Shui Po (location in Fig. 1) show that the northwesterly flow at the rear of the squall line extended up to about 1.5 km above ground (Fig. 8). Further aloft, there was a southwesterly jet of about 31 m/s (60 knots).
3.3 Simulation results
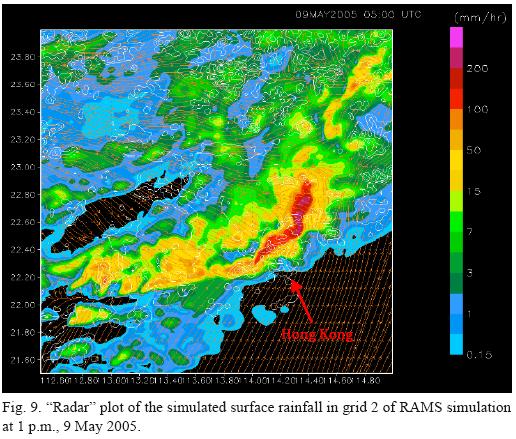
The RAMS simulation reproduces reasonably well the southeastward movement of the squall line. In the "radar" plot of the simulated surface rainfall in grid 2 (Fig. 9), an intense, bow–shaped "echo" is forecast to sweep across Hong Kong between noon and 1 p.m. of 9 May 2005, consistent with the actual observations. The updraft in this "echo" reaches a maximum of about 16 m/s (Fig.10), which is the magnitude to be expected in such a severe squall event.

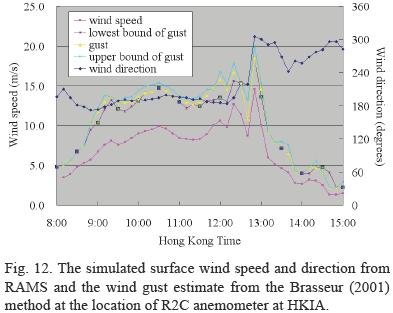
At the surface, the model successfully simulates the strong southwesterly flow ahead of the squall line and the northwesterly flow at the rear of it. For instance, northwesterly wind of 15 m/s (29 knots) is predicted over HKIA after the passage of the squall line (Fig. 11), consistent with the actual measurements. At the location of the R2C anemometer at HKIA in Figure 7, the wind direction change and the peak in wind speed associated with the squall line are reasonably well forecast (Fig. 12). However, some discrepancies are observed between the actual and the forecast wind fields: (a) the arrival time of the squall line is later by about half a hour in the simulation, and (b) the cold pool behind the squall line is more widespread (not shown) and affects Hong Kong for much longer time in the model, e.g. the wind at HKIA (Fig. 12) remains to be southwesterly to northwesterly for a couple of hours after the passage of the squall line.
The modelled winds at the location of Sham Shui Po wind profiler (boundary layer type with an operating frequency of 1299 MHz) are given in Figure 13. The depth of the northwesterly flow behind the squall line is forecast to reach about 1.5 km, consistent with the actual data (Fig. 8). The 60–knot southwesterly jet aloft is also well simulated. On the other hand, as observed in the simulated surface wind field, the west to northwesterly flow in the cold pool is forecast to last too long after the passage of the squall line.
The wind gust estimate at the location of R2C anemometer at HKIA is shown in Figure 12. It is generally consistent with the actual observation (Fig. 7) with the upper bound reaching 20 m/s, close to the actual measurement of 21 m/s. Within the Hong Kong territory, the upper bound of the wind gust has a maximum value of 30 m/s based on the simulation results. Though it is smaller than the actual maximum gust observed (37.6 m/s), the gust estimate nonetheless provides a useful indication about the gust that could be attained in the present severe squall event (see the magnitude of gust in various places in Hong Kong in Fig. 4).
Lam and Lam (2006) found that GUSTEX of Geerts (2001) gave a wind gust estimate of 25.2 m/s for the present event, which is even smaller than the gust estimated from the Brasseur (2001) method based on RAMS simulation. They proposed a modified GUSTEX using the wind at 700 hPa and the estimated gust value is closer to reality.
An experiment has also been carried out by retaining the default setting of cloud–top turbulent mixing in the simulation. The convective development turns out to be weaker. The maximum updraft is 12 m/s only, which is smaller than that in the model run without the cloud–top mixing. The arrival time of the squall line at Hong Kong is also later by an hour, with weaker northwesterly wind behind the squall line (14 m/s). The cloud–top turbulent mixing appears to have significant effect on the development of convection, the speed of propagation as well as the strength of rear inflow of the squall line in the simulation.
The strong gusts associated with the squall line in the present case are believed to arise from evaporation of the precipitation, which leads to the formation of strong downdraft and cold pool. The cooler air descends and spreads outwards on the ground, leading to the formation of strong squalls. Since the cold pool as observed in actual weather data is also reproduced well by RAMS simulation, it is considered that the microphysical processes in RAMS are sophisticated enough to simulate this cooling process through precipitation evaporation. Similar results are also obtained with RAMS simulation, for instance, in Tsui (2008). Strong gusts in this kind of squall line are rather common in Hong Kong in the summer time. For instance, a similar event has been documented in Kung et al. (2011).
4. Terrain–disrupted airflow
Wind gusts associated with terrain–disrupted airflow at HKIA are considered in this section. The model setup is described in Section 4.1. Typical events of airflow disruption due to terrain, namely, spring–time easterly, southwest monsoon in the summer, and tropical cyclone situation are discussed in Sections 4.2 to 4.4, respectively.
4.1 Model setup
The RAMS was run in three nested grids at a horizontal resolution of 4 km, 800 m and 200 m respectively (grids 1 to 3). The model domains for the nested runs are shown in Figure 14. The boundary and initial conditions were provided by the forecasts and analysis of the RSM of HKO with a horizontal resolution of 20 km.
Topography data used in the RSM are extracted from the 30 arc–second Advanced Very High Resolution Radiometer (AVHRR) dataset from U.S. Geological Survey, while grids 1 to 3 uses the 3 arc–second resolution data from Shuttle Radar Topography Mission (SRTM). Vegetation is also resolved at 3 arc–seconds with five classes, namely, crop/mixing farming, irrigated crop, evergreen broadleaf tree, desert (only applied to HKIA which is reclaimed land), and ocean.
The Mellor–Yamada (1982) Level 2.5 turbulence closure scheme was employed in the model runs. In grids 2 and 3, the Deardroff scheme (which is used in large eddy simulations, Chan (2007)) to calculate large scale turbulent eddies explicitly and parameterize small turbulent eddies is also tested, and the results are compared with those using the Mellor–Yamada scheme.
The maximum gust estimated by the algorithm within the area marked in Figure 1 (rectangular box with broken lines) is taken to be the gust forecast by the model, while the maximum gust recorded by the six anemometers along the runways (blue dots in Fig. 1) serves as the actual gust observation for forecast verification.
4.2 Spring–time easterly winds
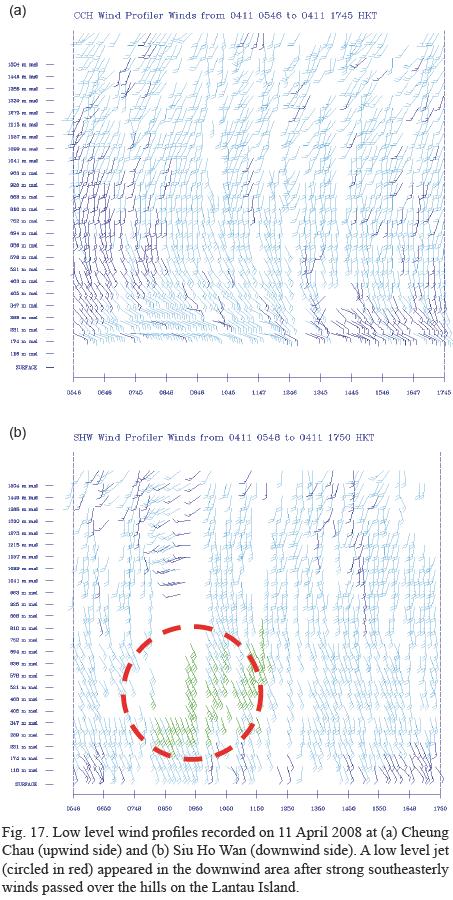
A ridge of high pressure developed over southeastern China later on 10 April 2008 and extended southwards on the following day (Fig. 15). Surface easterlies strengthened at HKIA at about 6 a.m. on 11 April. Low level winds veered to the south at around 600 m as depicted by wind profiler data. The cool easterlies were shallow and a low level inversion developed between 400 and 800 m after the onset of easterlies (Fig. 16). Figure 17 shows the vertical profile of low level winds in the upstream and downstream of the Lantau Island. Strengthening of low level southeasterly winds from around 10 to 15 m/s was found between 200 and 800 m when they passed over the hills over Lantau Island with height close to that of the inversion. The timing and strength of the strong low level southeasterlies matched with those of the observed maximum gusts at HKIA during 9 a.m. to 1 p.m. on 11 April. The strong southeasterlies on the hill tops were rather localized over the Lantau Island (Fig. 18). The Froude number in this case was found to be 0.7–1 (taking the mean wind speed of 10 m/s, the Brunt–Väisälä frequency of 0.02 /s, and the height of hills on the Lantau Island ranging from about 500 to 900 m). The flow on the upwind side was subcritical. Thinning and acceleration of airflow occurred on the upslope side and attained maximum at the crest when the Froude number was close to 1 (CAeM website). In case the Froude number equals to 1 at the crest, the flow will become supercritical and continue to accelerate as it descends the lee side until it adjusts back to the ambient subcritical conditions (Holton, 2004). The effect of topography apparently plays a significant role to the gusty condition in this type of east to southeasterly flow in the presence of a low level inversion close to the hill top.


The model forecast increasing mean wind and gust about four hours earlier than observed at HKIA in the morning of 11 April (Fig. 19). However, the model forecast maximum gust attained at around noon on that day is consistent with the observed data, though the strength is overestimated by about 2 m/s.
4.3 Southwest monsoon
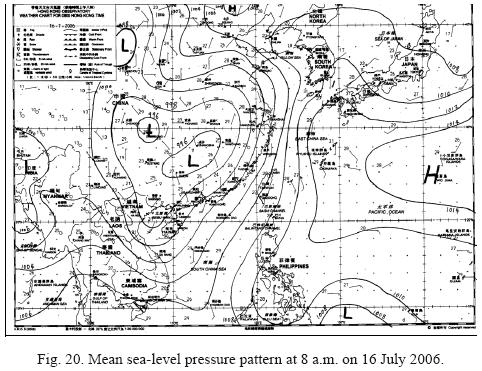
Severe tropical storm Bilis landed over southeastern part of China on 14 July 2006 and became an area of low pressure over the inland area. The remnant of Bilis brought about intense southwest monsoon in the southern part of China (Fig. 20). The strong southwesterly winds in Hong Kong on 16 July 2008 are captured well in the model simulation, as shown in the mean winds over the airport (Fig. 21a). The wind gust estimate from the numerical model prediction is also reasonably close to the actual data (Fig. 21b). It only over estimates by 3–4 m/s in the earlier part of the day, and becomes rather close to the actual wind gust later in the simulation. Therefore, besides the northeast monsoon in the spring, the intense southwest monsoon in summer time is also reasonably well captured in the numerical simulation for both the mean wind and the gust.

4.4 Tropical cyclone situation
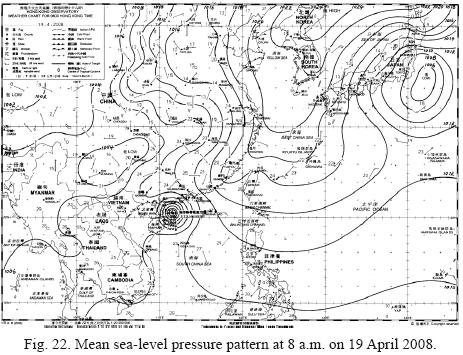
Neoguri formed as a tropical depression over the South China Sea and it tracked generally northwards skirting the northeastern tip of Hainan on the early morning of 19 April 2008 (Fig. 22). It once intensified into a typhoon, but weakened to a tropical storm as it moved north–northeastwards towards the coast of Guangdong. Under the combined influence of Neoguri and the northeast monsoon, winds at HKIA were strong easterlies for most of the day on 19 April. When Neoguri passed to the west of Hong Kong at about 150 km, winds strengthened further from the south, reaching more than 15 m/s and gusting up to about 25 m/s during the evening of 19 April. Wind speed at HKIA momentarily decreased to about 2 m/s at around 6 p.m. just prior to strengthening from the south. It appears that this sudden drop in wind speed could not be well depicted in the model forecast (Fig. 23a).

Apart from the momentarily drop in wind speed, model maximum gust forecast is in general in good agreement with the observed maximum (Fig. 23b). The general increasing trend on the morning of 19 April and the decreasing trend after around 9 p.m. that day could be depicted by model forecast.
5. A moderate southerly wind case
To study the performance of wind gust estimate in non–gusty wind condition, an ordinary southerly wind case (with winds crossing the mountains on Lantau Island) on 23 July 2008 is considered. Synoptically, a southerly airstream prevailed over southern coast of China with a trough of pressure lingering over the central part of China (Fig. 24). Moderate southerly winds affected Hong Kong on that day. The mean wind forecast by RAMS is generally comparable with the actual observations at the airport (Fig. 25a). The simulated wind gusts are also generally consistent with the anemometer readings (Fig. 25b). The two sets of data are mostly within a few m/s. Thus, in moderate wind condition, the wind gust at the airport is not exaggerated in the model simulation results. The performance of the wind gust estimate is considered to be satisfactory in this "null" condition (i.e. non–gusty winds).


6. Sensivity to turbulence parameterization schemes
Gust forecasts from model runs utilizing Deardorff (1980) as the turbulence parameterization scheme does not show significant difference as compared with those from the runs using Mellor–Yamada Level 2.5 turbulence closure scheme except for the case of strong east to southeasterly flow on 11 April 2008 (Fig. 26). The first peak of maximum gust occurred at around midnight of 10 April could be depicted by the upper bound forecast from the model run using Deardorff scheme, but not the one using Mellor–Yamada Level 2.5 turbulence closure scheme.

Since the upper bound of gust forecast is given by the maximum wind speed in the boundary layer whose depth is taken as the height where TKE is 0.01 of the surface value (Section 2), the discrepancy suggests that the two turbulence parameterization schemes may produce rather different vertical profiles of TKE. The vertical profiles of TKE and wind speed at HKIA (location marked by black star in Fig. 1) extracted from model forecasts at midnight of 10 April 2008 is shown in Figure 27. The Mellor–Yamada scheme forecasts the boundary layer top at around 500 m, while that of the Deardorff scheme is around 1400 m. Consequentially, winds of larger speed at higher levels have been taken as the gust upper bound based on the Deardorff scheme.

The vertical profiles of downdraft for the two schemes are also shown in Figure 27. The Deardorff scheme successfully depicts the downdraft associated with the accelerated descent of the supercritical air flow from around 500 m, while the Mellow–Yamada scheme has no such indication. It should be noted that the downdraft is also considered in the gust estimation as described in Section 2.
Further tests would be necessary to obtain more conclusive results for the performance of two turbulence schemes in different types of weather conditions and their impact on the model gust forecasts.
7. Conclusions
This paper discusses the use of a high–resolution NWP model and a physical approach to estimate wind gust, which is an important element in weather forecasting. The method is demonstrated through typical examples of intense convective weather and terrain–disrupted airflow in Hong Kong. In general, the estimated wind gusts are found to be comparable with actual observations and show the potential for day–to–day weather forecasting application.
For intense convective weather, the severe squall event in Hong Kong on 9 May 2005 is studied. The RAMS model at convection resolving spatial scale (about 1.3 km horizontal resolution) is found to simulate successfully many aspects of the event, such as the development of a bow–shaped echo and the movement of the squall line. The wind gust is estimated from the simulation results using the method of Brasseur (2001) with the inclusion of downdraft. The maximum value of gust estimate, though smaller than the maximum gust observed in the event, provides a useful indication about the gust that could be attained due to the squall line and outperforms the other gust estimation methods like GUSTEX. The reduction of cloud–top turbulent mixing is found to have significant effect on the model results, such as the development of convection and movement of the squall line.
Cases of high gusts associated with terrain–disrupted airflow at HKIA in typical weather conditions of strong southwesterly flow, and east to southeasterly flow, as well as during the passage of tropical cyclone have been studied with the use of 200–m RAMS. The model–predicted wind gust shows similar trend to actual observations, though it may over estimate by about 2–4 m/s. The effect of topography apparently plays a significant role to the gusty condition, particularly in the case of strong east to southeasterly flow in the presence of a low level temperature inversion close to the hill top. Model runs with the use of Deardorff turbulence scheme or Mellor–Yamada Level 2.5 scheme show similar results of gust forecasts in general, except for the case of strong east to southeasterly flow in the spring, in which the former scheme produces better forecasts in comparison to actual observations. The production of TKE and downdraft may contribute towards the discrepancies in the forecasts. The effect of turbulence parameterization scheme on gust forecast needs to be further examined with more cases. In general, the use of high–resolution NWP model in forecasting high gust events associated with terrain–disrupted airflow has rather promising results. Further tests will be conducted to explore the model application in daily weather forecasting operations.
References
Brasseur O., 2001. Development and application of a physical approach to estimating wind gusts. Mon. Wea. Rev. 129, 5–25. [ Links ]
CAeM website, WMO ET/ET Aviation Met Hazards Training Courses (http://www.caem.wmo.int/_pdf/turbulence/OrographicTurbulence.pdf). [ Links ]
Chan P. W., 2007. Comparison of turbulence closure schemes in the simulation of terrain–disrupted airflow. 12th Conference on Mesoscale Processes, American Meteorological Society, Waterville Valley, New Hampshire, USA, 6–9 August. [ Links ]
Cotton W. R., R. A. Pielke Sr., R. L. Walko, G. E. Liston, C. Tremback, H. Jiang, R. L. McAnelly, J. Y. Harrington, M. E. Nicholls, G. G. Carrio and J. P. McFadden, 2003. RAMS 2001: Current status and future directions. Meteor. Atmos. Phys. 82, 5–29. [ Links ]
Deardorff J. W., 1980. Stratocumulus–capped mixed layers derived from a three–dimensional model. Bound.–Layer Meteor. 18, 495–527. [ Links ]
Geerts B., 2001. Estimating downburst–related maximum surface wind speeds by means of proximity soundings in New South Wales, Australia. Weather Forecast. 16, 261–269. [ Links ]
Goyette S., O. Brasseur and M. Beniston, 2003. Application of a new wind gust parameterization: Multiscale case studies performed with the Canadian regional climate model. J. Geophys. Res. 108, 4374–4389. [ Links ]
Holton J. R., 2004. An introduction to dynamic meteorology. 4th ed. Elsevier Academic Press, London, 535 pp. [ Links ]
Kung T., W. H. Leung and H. K. Yeung, 2011. Studies of two cases of heavy rain and thunderstorm in Hong Kong in 2010. 25th Guangdong – Hong Kong – Macao Seminar on Meteorological Technology (in Chinese), 24–27 January. [ Links ]
Lam C. C. and H. Lam, 2006. Analysis of high wind gusts associated with thunderstorms, tropical cyclones and monsoons. 20th Guangdong – Hong Kong – Macao Seminar on Meteorological Technology (in Chinese with English abstract), 6–10 November. [ Links ]
Mellor G. L. and T. Yamada, 1982. Development of a turbulence closure model for geophysical fluid problems. Rev. Geophys. Space Phys. 20, 851–875. [ Links ]
Szeto K. C. and P. W. Chan, 2006. High resolution numerical modelling of windshear episodes at the Hong Kong International Airport. 12th Conference on Aviation, Range, & Aerospace Meteorology, American Meteorological Society, Atlanta, GA, USA, 29 January – 2 February. [ Links ]
Tsui C.Y., 2008. Numerical simulation of a squall line over Hong Kong, Master Thesis. City University of Hong Kong, 106 pp. (available at http://barry1.cityu.edu.hk/han3/7/6/9/0/0/0/0/dspace.cityu.edu.hk/handle/2031/5196). [ Links ]
Yeung L. H. Y., P. K. Y. Chan and E. S. T. Lai, 2005. Impact of radar rainfall data assimilation on short–range quantitative precipitation forecasts using four–dimensional variational analysis technique. 32nd Conference on Radar Meteorology, American Meteorological Society, New Mexico, 23–29 October. (on–line proceedings). [ Links ]

