


Services on Demand
Journal
Article
 English (pdf)
 Article in xml format
 Article references
 Send this article by e-mail
Indicators
-
 Cited by SciELO
 -
 Access statistics
Related links
-
 Similars in
SciELO
Similars in
SciELO
Share

 Permalink
Atmósfera
Print version ISSN 0187-6236
Atmósfera vol.24 n.2 Ciudad de México Apr. 2011
Technical note
Evaluative testing of a prototype barometer
L. G. HIDALGO and J. A. HIDALGO
Ipostel Plaza Venezuela, P. O. Box 54611, Caracas 1052A, Venezuela Corresponding author: L. G. Hidalgo; e–mail: hidalgoplaza@yahoo.com
Received February 22, 2010; Accepted August 16, 2010
RESUMEN
Los autores presentan la evaluación de un prototipo portátil de barómetro electrónico digital (UBII001). El prototipo fue desarrollado en Venezuela, pero con partes multinacionales de bajo costo. La evaluación incluyó estabilidad de respuesta ante variaciones de la presión atmosférica durante seis años. Como parte de la evaluación, el UBII00 1 pasó con éxito una prueba de calibración a 550–1100 hPa en el Fondo de Metrología Legal (SENCAMER, Venezuela). Las respuestas del UBII001 han permanecido dentro del rango aceptable de estabilidad (±0.1 hPa). El prototipo alcanzó una exactitud de ±0.078 hPa mejor que aquella de ±0.1 hPa requerida por regulaciones de la Organización Meteorológica Mundial y de la Organización de Aviación Civil Internacional para estaciones de superficie y aeropuertos. La información aquí colectada representa una alternativa probada y replicable de desarrollo barométrico.
ABSTRACT
The authors present the evaluative testing of a portable prototype of digital electronic barometer (UBII001). The prototype was developed in Venezuela although it includes low–cost multinational parts. The six year evaluation included response stability against atmospheric pressure variations. The UBII00 1 successfully passed a 550–1100 hPa test in the pressurization chamber of the Fondo de Metrología Legal (SENCAMER, Venezuela) and its responses remained within an acceptable ±0.1 hPa stability variation range. The prototype reached an absolute ±0.078 hPa exactitude better than that of ±0.1 hPa required by the World Meteorological Organization (WMO) and the International Civil Aviation Organization (ICAO) regulations for surface stations and airports. The information gathered here through the merging of measurement details with prototype characteristics represents a proven and replicable alternative of barometric development.
Keywords: Barometer, pressure, portable, exactitude, prototype.
1. Introduction
Even though atmospheric pressure is an essential variable to define synoptic features such as cyclonic and anti–cyclonic patterns, missing pressure values can be observed in weather maps. It is not uncommon to find obvious differences among sea–level pressure values reported by ships navigating in the same mesoscale area, therefore creating interpretation errors. Missing data might be due to the unavailability of accurate barometers in current markets and differences arise from the use of barometers of undefined quality of response or from erroneous procedures for the adjustment (reduction) of the absolute pressure to the mean local sea level. The term absolute recalls the notion of Torricellian vacuum. Sometimes, for clarification, true pressure replaces absolute pressure as a synonymous term. Barometric pressure means only pressure value obtained from barometer output; this value must be as close as possible to the true pressure amount.
In order to help to minimize missing data and differences, an attempt began in Venezuela to develop barometers of general use but with high quality related to both resolution (number of decimals) and exactitude (standard deviation of output errors of an instrument with respect to another similar device known as a pattern after the instrument has been calibrated against this pattern over a specific pressure range). The prototype instrument arising from that development is described here. Terms such as resolution and exactitude have been colloquially called accuracy and further small differences exist between resolution and exactitude. To obtain basics on observational aspects of atmospheric pressure for instruments applications see Hidalgo (1994). The prototype was developed in Venezuela although it includes multinational parts.
The graph of a function allowing us to adjust the reading of an instrument to another instrument's reading, the last taken as a pattern, is named normally calibration curve and the process to build that curve is the calibration. To obtain more details behind calibration see Hidalgo (2001) that meets WMO and ICAO regulations published since 1967.
The unit used to report atmospheric pressure values is the hPa or 100 Pa; and Pa is the Pascal unit of pressure defined as N/m2 in the International System of Units. The unit Atmosphere (atm) is defined as 1013.25 hPa or 760 mm Hg at normal conditions of 0 °C and gravity of 980.665 m/s2. There is a strong tradition to use inches Hg for pressure in aviation. With an inch equal to 25.4 mm, 1 atmosphere (1 atm) is equivalent to 29.9212 inch Hg at normal conditions. The altimeter setting (QNH, inch) based on accurate barometry has become mandatory by ICAO rule before any aircraft take–off and landing. The use of a unit named millibar (mb) equal to one hPa remains nowadays. The unit pound by square inch absolute (PSIA) falls outside the standard vocabulary used in meteorology (1 atm ≈ 14.6960 PSIA) but appears in cabin navigation data of NASA spacecrafts.
Barometers come with a factory calibration that needs minimum confirmation. To illustrate differences among the outputs of barometers provided by some factories an experiment was delineated. Figure 1 shows the participating instruments and Table I includes barometric pressure data compiled in a sample observational trial. See that barometers A, B and C have two decimal digits and D, E, F and H have only one; one barometer of two decimals is observationally equivalent to ten of one decimal and one of one decimal is equivalent to ten of integer (no decimal) output such as the instrument G. To eliminate output differences as far as possible there are legal gauging patterns for calibrations as the chamber maintained by Metrología Legal (SENCAMER, Venezuela) under artificial 21–23 °C air temperature.
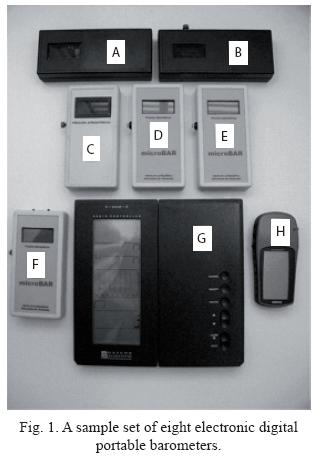
The readings related to Table I were made within about a 2.5 min interval in the natural 10 am local pressure maximum when pressure changes slowly. The reading of each barometer of the set A–C finished after about four outputs in 5 sec when the pressure values became almost steady. Additional features that help to avoid delay of readings are: (1) the large G changes very slowly with its outputs seen permanently on screen, (2) the barometer H is a GPS device that was programmed for automatic output on screen and (3) zero altitude settings were applied to D–F to obtain fast responses. Instruments A and C are replications of the device B that was the first issued of the series microbar; only C has a visually enhanced body.
Barometers such as A, B and C have no options to change inner response and the results of calibrations must be maintained as graphics and tables on paper or electronic media not added to the equipment. Other barometers such as D, G and F have communication ports, cable and software to change inner response with the help of a personal microcomputer, thus any new calibration may be added. The A–F barometers pertain to the series microBar (a Venezuela–Argentina development) and their responses are based on the integrated pressure sensor Intersema MS5534C (Switzerland). This sensor is a SMD–hybrid device including piezoresistive micro parts interleaved into four membranes (Measurements Specialist, Inc, 2006; Intersema Sensoric SA, 2010). The MS5534C is activated by perturbations of the surrounding air against membrane surfaces, producing a microvoltage (μV) proportional to the atmospheric pressure. Later, the sensor transforms μV and inner temperature into four data words. Finally, using factory calibration coefficients, a microcontroller that commands all device activities throughout software proceeds to use the four words to calculate atmospheric pressure and translates the information into a digital string to be display in the LCD each second.
A feature of some significance is the absence of temperature control in some barometric patterns. Thus, the apparently single calibration transference from a calibrated instrument to a non–calibrated one will be discussed in a later issue. The design of the small UBII001 barometer takes into account the door size of the SENCAMER chamber which was measured by the authors early by the year 2004 when this device was in Caracas (San Bernardino). The UBII001 remains generally in Caracas at the natural 19–25 °C range.
2. Objective
The objective here is the long range evaluation of response variability (period 2004–2009) of the UBII001 Prototype (built by 2004) shown as B in Fig. 1. Data from a calibration of that instrument in the pressurized barometric chamber of SENCAMER are included.
3. Methodology
To achieve the objective mentioned above, the steps were: Step 1, to study the internal structure of the UBII001 Prototype. Step 2, to compare prototype readings with that of another instrument called the control barometer (GPS1 or H, see Fig. 1 and Table I). Step 3, to transport the prototype to SENCAMER laboratories for a main calibration test. Step 4, to make calibration of the prototype in the chamber under specific protocols of rises and falls in pressurization levels. Step 5, to execute a task similar to Step 2. Step 6, to analyze response variability. Step 7, to issue conclusions. The above kind of research design where evaluation is included as scientific inquiry has been previously named evaluative research by Suchman (1967). In every step, the UBII001 must be understood as unknown and only basic rules for readings and change of battery are initially valid. Barometers must be left in the same place for several hours after measurements.
4. Results
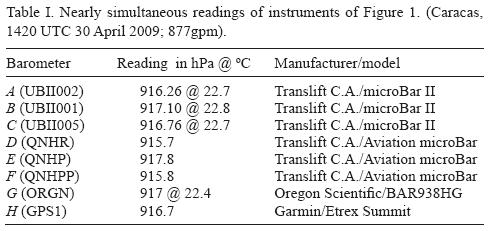
The small and light UBII001 Prototype (14 X 6 X 2.5 cm) under study is as seen in Figure 1 (B). Figure 2 shows most inner electronic components of this instrument and Figure 3 displays its block diagram. The DC electric power is supplied by a current alkaline 9 volt battery shown also in Figure 2. The reading button is visible between the two parts of the body. On pressing the button, the instrument turns on, allowing us to see on the screen the atmospheric pressure and sensor temperature with values as in Table I. By releasing the button, the instrument returns to its off position. Thus the prototype resists thousands of short measurements. The prototype includes automatic compensations by temperature. The measuring time established for meteorology by the WMO (2008) and the ICAO (2003) is 1 min but for other purposes this time could be different. If desirable, the observer may write the sequence of 1 sec values to obtain information on micro oscillations. Oscillations of the second decimal between consecutive outputs were frequently observed during prototype readings. By the use of adhesive bands depressing the on/off button of prototype B it becomes feasible to see on the prototype's screen the pressure and temperature amounts automatically. Such solution resolves the problem of seeing outputs of UBII001 inside SENCAMER chamber through crystals walls. This technique may be employed on instruments A–F when necessary.
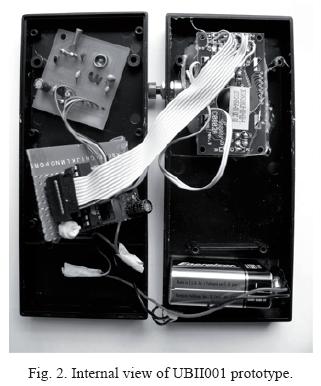
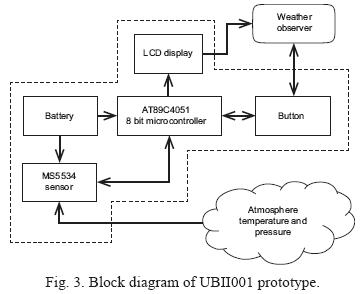
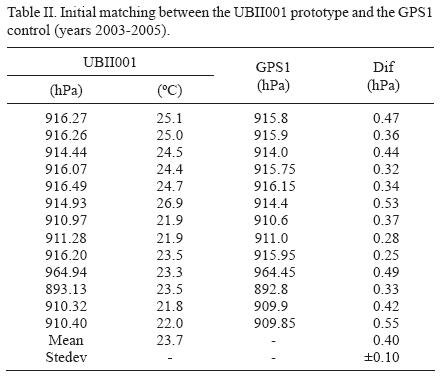
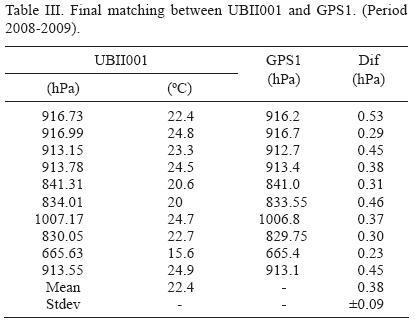
Table II has data coming from nearly simultaneous measurements between prototype and control. Each pair of values at Table II was made within about a 0.5 min time interval but during different days along the period 2003–2005. The value 0.40 hPa at the foot of the table is the average of differences and ±0.10 hPa is the standard or typical deviation of differences. The value 23.7 °C is the mean sensor temperature of the prototype. The GPS1 has no temperature output but it is supposed to be similar to the UBII00 1 temperature. The above average makes up the deterministic part or the first momentum of the UBII00 1 error; the standard deviation represents the random part known as the uncertainty or the second momentum. In this case, after subtracting 0.4 to the UBII001 outputs and supposing the GPS1 a reliable instrument, the UBII001 reaches ±0.10 hPa of relative exactitude restricted by the presence of only one decimal in the GPS1 display. Days with frequent strong oscillations of the second decimal were related with weather perturbation and rains. Those days were of course not suitable for barometers matching. Over the years, the authors have made experimental trials as shown in Table III. Any amount in the GPS 1 column of Table II and III with two decimals ending in the digit 5, like 915.75 in Table II, indicates that GPS 1 output was oscillating between two consecutive values as 915.7 and 915.8.
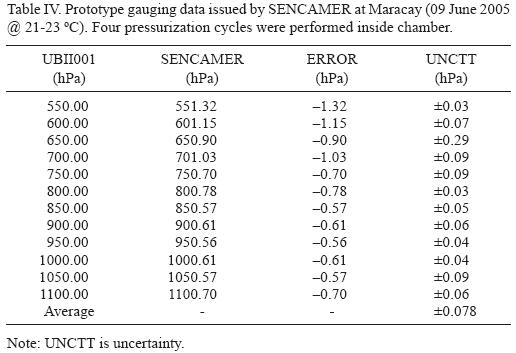
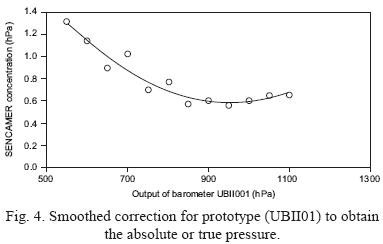
The matching main test at SENCAMER was made by 9 Jun 2005. SENCAMER applied the Sequence B of the guide DKD–R–6–1 (DKD, 2003) and after calibration the legal data tables were given to the owners of the prototype. The prototype resisted the large pressure variation (550–1100 hPa) inside the chamber; thereafter a high quality color paper of gauging certification was issued. The chamber is a Vaisala (Finland) trademark device consisting of about 1/2 m3 crystal box with a silicon capacitive PTB220 absolute pressure electronic sensor inside (Vaisala, 2001) controlled by an outside operator. The range of gauging temperature was 21–23 °C. Table IV presents numerical calibration results. In that table, error is not uniform through the pressurization range and relationship is not linear. Figure 4 presents the graph (calibration curve) that must be provided at the purchasing time of any instrument used in applications of importance. That curve is ideal to visualize the instrumental corrections; the Y axis represents the correction directly (minus error). For example for a UBII001 reading of 1000.00 hPa add about 0.6 hPato obtain the absolute atmospheric pressure. UNCTT is gauging uncertainty. The number ±0.078 hPa, calculated as the mean of UNCTT column, represents the overall uncertainty or finally the searched exactitude of instrument after calibration. Each point of Figure 4 proceeds from eight pairs of measurements corresponding to four consecutive cycles of increasing and decreasing pressure in the chamber through the 550 to 1100 hPa range. Similarly, each row of Table IV comes from the statistics from eight pairs of observations.
5. Discussion of results
Tables II and III indicate that the average response of UBII001 over the years overcome those of the GPS1 by nearly +0.40 hPa with uncertainty from ±0.09 to ±0.10 hPa; electronics of both instruments seem to be unalterable for about 6 years. Add 0.4 hPa to GPS1 reading to obtain an equivalent UBII001 response. The data from SENCAMER indicate good response at least inside equivalent altitude–pressure range from the Dead Sea (–698 m) to the Bolívar Peak (4865 m); minimum nearly imperceptible deviation appeared by 600 hPa. If we accept that prototype responses have been uniform during the period 2004–2009, then Table IV is nowadays valid (May 2009). The calibration rule is: Add 0.6 hPato UBII001 readings in the range 850–1050 hPato obtain absolute pressure with exactitude of ±0.078 hPa. In Table IV, the low amounts of the UNCTT column aim to the supposition of tolerable hysteresis through the mentioned pressure range. Of course, there are minimum differences among pressurization cycles.
Uncertainty does not have an exact explanation but might come from sources such as decimal rounding, natural micro variations of pressure, thermal effects on the electronic circuits and loss of inner sensor membrane flexibility. The materialization of uncertainty in barometric readings appears as fast micro oscillations of the aforementioned second case decimal of the UBII001 and oscillations of minor frequency in the unique decimal of the GPS1. The software that commands the UBII001 does not suppress those oscillations to allow research. Some commercial barometers damp decimal oscillations erroneously.
As WMO (2008) and ICAO (2003) have established an acceptable resolution of 0.1 hPa (the UBII001 has 0.01 hPa) and uncertainty of ±0.1 hPa (the UBII001 has ±0.078 hPa) and if we accept that the prototype has maintained constant response variability, it is possible to assume that UBII001 still meets established performance parameters for surface stations and airport applications already.
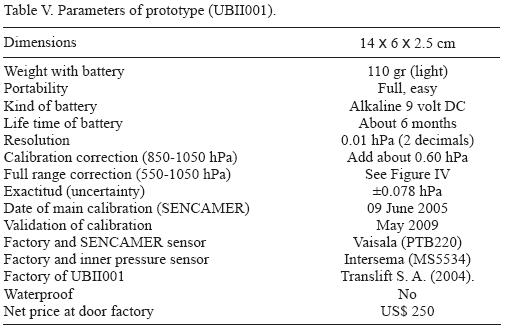
Although some of the figures, paragraphs and tables mentioned constitute detailed results; a sheet with performance parameters of the prototype (UBII001) is expected for cataloging and filing. Table V shows those parameters.
It is necessary to write a sentence about the GPS1 (see instrument H in Fig. 1). Although this device does not have a specific class in literature it is a worldwide GPS/Barometer known by its heavy duty and portability; for those reasons it was selected as a local control instrument; for security this barometer remains in a box avoiding large journeys. Its absolute calibration reaches 1.0 ± 0.1 hPa (add 1.0 hPato GPS1 readings).
6. Conclusions
Evaluative testing of prototype UBII001, based on intercomparison of its readings with those of a control barometer of a known trade mark (GPS1) and a calibration pressurization chamber (SENCAMER) indicates: 1) the absolute error of prototype resulted nearly uniform (–0.6 hPa) with conservation of two decimals resolution and exactitude of ±0.078 hPa in the range 850–1050 hPa, and 2) it is possible to develop portable small digital electronic barometers in Venezuela and other countries and territories if the design matches the door dimensions of most calibration chambers. The UBII001 may be considered a reliable instrument.
The information gathered here by merging details of atmospheric pressure measurements with prototype characteristics as the high ±0.078 hPa exactitude, low price and small size, represents a proven and replicable alternative of barometric development to enhance the measure of atmospheric pressure.
Acknowledgments
The authors owe thanks to the electronic engineer Diego Stanfield for the development of the microBar series in such way that each barometer can be evaluated externally and internally with minimum restrictions. Thanks are indebted to Natalia Hidalgo, Internationalist, and Professor Robert Hutchinson for the English language review.
References
DKD, 2003. Calibration of pressure gauges (Guideline DKD–R–6–1). Deutscher Kalibrierdienst, Braunschweig, Germany, 43 pp. [ Links ]
Hidalgo L. G., 1994. Fundaments of a weather forecasting method for tropical airports. Revista de la Facultad de Ingeniería, Universidad Central de Venezuela, Caracas, Venezuela 9, 9–12. [ Links ]
Hidalgo L. G., 2001. Method for barometers calibration based on radiosonde observations. Rev. Tec. Ing. Univ. Zulia 24, 147–153. [ Links ]
ICAO, 2003. Manual on automatic meteorological observing systems at aerodromes. Doc 9837 with actualization by 2006. International Civil Aviation Organization, Quebec, Canada, 70 pp. [ Links ]
Intersema Sensoric SA, 2010. Using MSS5534 for altimeters and barometers. Application note AN501. Bvaix, Switzerland, 12 pp. [ Links ]
Measurements Specialist, Inc., 2006. MS5534C (RoHS) Barometer module. Hampton. VA. USA, 21pp. [ Links ]
Suchman E. A., 1967. Evaluative research. Russell Sage Foundation. New York, 186 pp. [ Links ] Vaisala, 2001. PTB220 Series digital barometer user's guide (M2 10194EN–1), Finland, 107 pp. [ Links ] WMO, 2008. Guide to meteorological instruments and methods of observations. World Meteorological Organization No. 8. Geneva, Switzerland, 681 pp. [ Links ]

