


Servicios Personalizados
Revista
Articulo
 Inglés (pdf)
 Artículo en XML
 Referencias del artículo
 Enviar artículo por email
Indicadores
-
 Citado por SciELO
 -
 Accesos
Links relacionados
-
 Similares en
SciELO
Similares en
SciELO
Compartir

 Permalink
Atmósfera
versión impresa ISSN 0187-6236
Atmósfera vol.24 no.2 Ciudad de México abr. 2011
Water availability as a limiting factor and optimization of hydropower generation as an adaptation strategy to climate change in the Sinú–Caribe river basin
J. E. OSPINA–NOREÑA, C. GAY–GARCÍA, A. C. CONDE
Centro de Ciencias de la Atmósfera, Universidad Nacional Autónoma de México, Circuito Exterior, Ciudad Universitaria, México, D.F. 04510 México. Corresponding author: C. Gay–García; e–mail: cgay@servidor.unam.mx
G. SÁNCHEZ–TORRES ESQUEDA
Universidad Autónoma de Tamaulipas, Facultad de Ingeniería Arturo Narro Siller, División de Estudios de Posgrado, Centro Universitario Tampico–Madero
Received October 5, 2009; Accepted December 4, 2010
RESUMEN
Se aplicó el Modelo de Evaluación y Planificación del Agua (WEAP, por sus siglas en inglés) 2.1 a la cuenca del río Sinú–Caribe en Colombia para crear varios escenarios de referencia y de estrategias de adaptación. Dichos escenarios incluyen el análisis del suministro de agua, el uso y la demanda así como proyecciones futuras teniendo en cuenta los potenciales impactos de los efectos del cambio climático sobre los recursos hídricos. El análisis de la disponibilidad de agua como factor limitante en el balance entre la oferta y la demanda de los sectores productivos y actividades en la cuenca del río Sinú–Caribe en Colombia, muestra que la oferta requerida se podría aumentar y por lo tanto la demanda insatisfecha aumentaría más rápidamente bajo condiciones de cambio climático. Los índices de escasez definen sus puntos críticos en el balance oferta–demanda al año 2074 en el escenario actual o de referencia y al año 2066 contemplando el cambio climático. Igualmente se elaboraron escenarios de optimización para la generación de energía hidroeléctrica en los meses más críticos del año, mostrando cómo las estrategias de manejo de los recursos hídricos pueden mitigar los efectos adversos del cambio climático.
ABSTRACT
The Water Evaluation and Planning Model (WEAP) 2.1 was applied to the Sinú–Caribe river basin in Colombia to create several baseline and adaptation strategy scenarios for water supply, use and demand, and to make projections for the future including the potential impacts of climate change. The analysis of water availability as a limiting factor in the supply–demand balance of the productive sectors and activities in the Sinú–Caribe river basin in Colombia shows that the supply requirement would increase and thus unmet demand would increase more quickly under climate change conditions. The scarcity indexes define the critical points in this balance by the years 2074 under current or baseline conditions and 2066 with climate change. Optimization scenarios for hydropower generation for the critical months of the year were also generated and show how water resources management strategies can mitigate the adverse effects of climate change.
Keywords: Supply requeriment, management strategies, scarcity index, unmet demand.
1. Introduction
The Fourth Evaluation Report of the Intergovernmental Panel in Climate Change (IPCC, 2007a) concludes that man–made global warming is due mainly to greenhouse gas emissions, especially CO2. During the last century, the concentration of carbon dioxide in the atmosphere increased from 278 ppm in the pre–industrial era to 379 ppm in 2005, and the average global temperature rose 0.74 °C.
This increase in the rate of global warming has taken place during the last 25 years, and according to historical records, 11 of the 12 hottest years have occurred in the last 12 years. The IPCC report presents detailed estimated projections for the 21st century, which indicate that the Earth's temperature could increase 3 °C by the year 2100, based on results from world average models for A2 and A 1B scenarios, and that the average world temperature for that year could increase between 1.8 °C (based on low B1 scenario) to 4 °C (based on high A1FI scenario) (UNFCCC, 2008).
It is estimated that greenhouse gas emissions could rise from 25 to 90 % in the year 2030 compared to the year 2000 and even an increase of 1 to 2.5 °C would have drastic effects, including the reduction of crops in tropical zones, the risk of famines, the propagation of diseases such as malaria, and an increase in the risk of extinction of 20 to 30% of all plant and animal species (IPCC, 2007a).
It is forecasted that in the subsequent decades, even with relatively small average temperature increases, billions of people, especially those in developing countries, will face water and food shortages. It is also expected that floods, droughts and heavy precipitation will increase. Changes in some types of extreme phenomena have already been observed especially on human systems and low coastal systems; for example, there has been an increase in the frequency and intensity of heat waves and heavy precipitation on most regions of the world (IPCC, 2007b).
In the course of this century, millions of people who live in the watersheds of the Himalayas and the Andes could face an increased risk of flooding due to the melting and loss of glaciers followed by drought and the scarcity of water once these glaciers disappear (IPCC, 2007b).
Africa's climate is expected to be more variable, with more frequent and severe extreme meteorological phenomena which pose a higher risk to health and life. These phenomena include drought and floods in new areas (Few et al., 2004; IPCC, 2007b) and flooding due the rise in the sea level in coastal zones of that continent (Nicholls 2004; McMichael et al., 2006). According to the IPCC report, by the year 2020, up to 250 million people in Africa could be exposed to increased hydrological stress. Africa will face more water shortages, with the possible consequence of an increase in conflicts over water, due to the fact that there is a complex transboundary system in almost all 50 river basins in Africa (Ashton, 2002; De Wit and Jacek, 2006).
In Latin America, it is expected that by mid 21st century, the increase of temperature, and therefore, the reduction of soil moisture will generate a gradual substitution of tropical rainforest by savannas in the eastern Amazonia. Vegetation of semi arid regions will be substituted by vegetation of arid regions, and major biodiversity losses will take place with the extinction of species in many tropical regions of Latin America. The yield of some crops will decrease, and with that, livestock production will also decrease, and this will have a negative impact on food production, and therefore, more people could experience hunger. Also, changes in precipitation patterns and the disappearance of glaciers will considerably affect the availability of fresh water for human consumption, for agriculture, and for hydropower generation (IPCC, 2007b).
According to several regional reports, the Andean glaciers could disappear in this century, with grave consequences for human life, production and subsistence means and ecosystems. In the course of this century, millions of people in Bolivia, Chile, Ecuador and Perú who live in the watershed of the Andes and depend on the seasonal melting of the glaciers for water supply and hydropower generation could face an increased risk of flooding due to the melting and loss of glaciers followed by drought and the scarcity of water once these glaciers disappear. The resulting water shortages would reduce the amount of hydropower generated (Mayr, 2006; IPCC, 2007b; UNEP, 2007).
The impact of these climate changes on water resources involve not only changes in the quantity, quality and recharge of the flow, but also by the characteristics of the system and the pressures on it, the way the system is managed and the adaptations to climate change that are applied. It is possible that other non–climate changes, such as the loss of biotic–physical regulators of the hydrologic cycle (like losses of physical, chemical, and mechanical properties of soils, changes in the structure of flora and fauna, and losses or changes in land cover), deforestation, the expansion and mismanagement of agriculture in unsuitable land, and the location of inadequate infrastructure would have a larger impact than those caused by climate change itself. More stressors on the system would increase its vulnerability to climate change, but management adaptations would reduce that vulnerability. Systems not subject to management would surely be the most vulnerable to climate change (IPCC, 2001b; UNFCCC, 2008).
For water resources, the variability in the hydrologic cycle induced by climate change poses new challenges in planning and management. The development of adaptation strategies to address the diverse additional uncertainties requires a comprehensive, integral and multidimensional focus; given the role that water plays in maintaining human life, society and the ecosystems they depend on. Methods of administration of water resources, particularly those that utilize integrated management, can be applied to adapt the hydrologic effects of climate change and new uncertainties, in order to diminish their vulnerabilities (IPCC, 2001b).
The intrinsic characteristics of integrated water resources management (IWRM) make it the ideal framework for the evaluation, design, execution and supervision of the strategies of adaptation of water resources to the effects of climate change. The IWRM method is a systematic planning and management approach that considers a series of processes and supply–demand actions, incorporating the participation of key actors or stakeholders in the decision–making process. It also facilitates adaptive management by means of monitoring and continuous revision of the water resources situation (UNFCCC, 2006).
The Water Evaluation and Planning Model, WEAP 2.1. (Sieber and Purkey, 2007), developed by the Stockholm Environment Institute (SEI), is a tool used to achieve effective IWRM. It integrates a range of hydrological physical processes with the administration of demand and infrastructure in a continuous and coherent manner, providing the analysis of multiple scenarios, including alternative climates, the anthropogenic changes causing stress such as variation in land use, changes in municipal and industrial demands, alternate operating regulations and the points of diversification of the changes (UNFCCC, 2005).
Since Colombia is as vulnerable as any country to the possible effects of climate variability described previously, this study presents an analysis of water availability as a limiting factor to different economic activities and productive sectors. Strategies of adaptation and/or optimization for the generation of hydropower are presented along with their effects on the supply–demand balance in the Sinú–Caribe river basin, integrating different tools and applying the WEAP model.
2. Methodology
For the purpose of this article, data have been used from previous reports by Ospina (2009) and Ospina et al. (2009) of the supply–demand balance of water resources, and the generation of hydropower in the Sinú–Caribe river basin. These data include: annual renewable water resources, water demand for different uses and by different sectors, water demand coverage, water demand required, unmet water demand, water storage volumes, and hydropower generation at the Urrá 1 dam, taking into account current conditions and projections of possible climate change effects on water resources, especially changes on precipitation, temperature, and evaporation, expressed by changes in streamflows and water volumes.
The current net natural supply of water resources is determined along with the supply under current climate change conditions, using as limiting factors (Ks) the maximum amount of water that can be provided under Colombian legislation (10% of the natural net supply) in both cases. Using data from the aforementioned articles, models of supply requirement (SR) and supply yield (SY) are adjusted in terms of time, assuming SR as real demand and SY as coverage of that demand.
Thus, the current and projected unmet demand can be determined and the effect of a possible adaptation scenario is analyzed. In addition, according to reports of the Instituto de Hidrología, Meteorología y Estudios Ambientales de Colombia (IDEAM, 2000–2001) the scarcity index (SI) can be calculated by obtaining the ratio between the demand and the supply, which is assumed to be the current net natural supply Ka and the projected supply under climate change conditions Kcc.
Since the river basin is involved in the generation of hydropower and in order to mitigate and/ or improve the negative projected effects on this generation of energy, several scenarios are created with various strategies, which are then used to determine the influence of these strategies on the unmet demand (UD) in the region, considering specifically the most critical months of the year from February to April. The proposed strategy is simulated by generating a new demand site in the study region called "pumping", whose purpose is to extract water from a source downstream from the dam and supply that water upstream or at the dam site (see Fig. 1).
3. Analysis and results
The study area is located approximately between 7 and 10° N latitude and 75° and 77° W longitude in NE Colombia. In Figure 1, the location and principal demand sites are presented, including the Urrá l reservoir and the future pumping station.
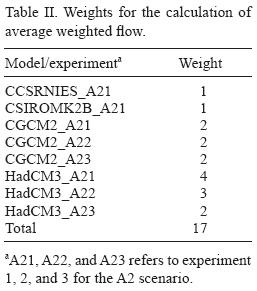
In Tables II, III, IV and V, and Figure 2, the variables and data obtained in studies by Ospina (2009) and Ospina–Noreña et al. (2009a, 2009b) are summarized. Detailed information can be found about the models of climate change, methodology, tools used, construction of scenarios as well as the different analyses and interpretation of the data used for the Sinú–Caribe river basin.
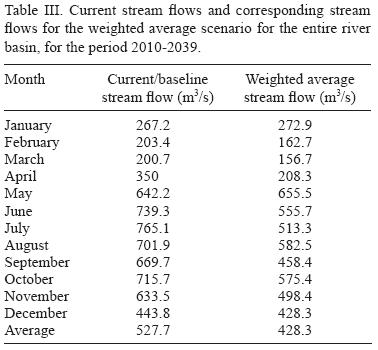
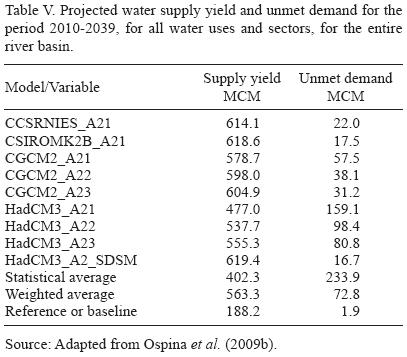
It is clear from the information shown in those tables and figures that all the models and scenarios project negative effects on flow in the basin, on the volume of water stored in the reservoir and on the generation of hydropower by the end of the 2010–2039 period. The projected supply yield for the different scenarios for the year 2039 is presented to cover the supply requirement or demand for the same year (636.1 millions of cubic meters –MCM– for all scenarios, see Table V) and the ratio for unmet demand is specified for each case. The new scenarios developed in this report are based specifically on the current or baseline scenario and the future weighted average scenario (see Table III), for the purposes of the proposed analyses.
Table I presents some of the characteristics of the various scenarios of greenhouse gas emissions presented in Table II, which, according to IPCC (2001), are the basis for the evaluation of climatic and environmental consequences of future emissions, which are in turn used to implement mitigation strategies and adaptations actions to climate change. These scenarios represent emissions as a result of suppositions about the development of the planet in terms of economy, population and technological growth.
The average weighted flow scenario, which appears in Tables III, IV and V, was created by the application of weight to the flow volume for each of the models in Table II and by the standardization of the sum of these models, taking into account the change in the variables Tmax (maximum temperature) and PCP (precipitation) projected for the different scenarios. The flows of the models which showed the largest increase in Tmax and the greatest decrease in PCP were given more or less weight, then added and divided by the sum of the weighted factors (See Table II).
It was taken into account the expected changes in maximum temperature and precipitation, due to the fact that the model that was used to calculate the stream flows, only considered these two variables (Ospina, 2009; Ospina, et al., 2009a).
The weighted average scenario was established applying the criterion of avoiding the most adverse effects that can be found. In other words, for those models that project greater increase in Tmax and greater decrease in PCP, higher weights are given, and vice versa.
Here it is important to point out, that conscious the uncertainty associated to the different scenarios socioeconomic conditions, climate, and databases; among others. The weighted average scenario was proposed precisely as a scenario that encompasses all the expected projections, according to the different models, and tries to manage, or considers such uncertainty.
Trying to obtain the best management of the uncertainty mentioned above, with the objective of reaching the most realistic and approximate results possible, it was sought that all the models, or the relationships found among the different variables necessary for doing this study, were statistically significant to a confidence level of 95%. In addition, after finding the estimated values, caution was taken that there were no differences statistically significant to a confidence level of 95% of the mean, median, standard deviation, and distribution among the observed and estimated data, which gave a high degree of safety and certainty to the results shown in this paper. Further information about these concepts can be found in Ospina (2009) and Ospina et al. (2009a).
As shown in the above tables and figures, water availability can become a limiting factor (K) in the region, in terms of meeting the needs of the population, economic sectors and productive activities and this limitation will become more severe as the estimated climate changes take place. For this reason, the influence that over time water supply can have as a limiting factor in the baseline and climate change scenarios in some variables of the supply–demand ratio in the region is analyzed in the following section.
3.1 Water resources as a limiting factor
As mentioned in the methodology section, the extractable flow from a river basin in Colombia has been established at 10% of the net supply, which currently would be 1664.2 MCM and 1350.7 under projected climate change scenarios for 2010 to 2039 (see Table III, baseline scenario and weighted average scenario), that is, the values of Ka and Kcc respectively and the maximum possible SY.
With the values obtained of SR and SY from WEAP, the models were adjusted for the purpose of having a longer projection in time, after 2039, because the outcomes from WEAP in this case only evaluated the period 2010–2039. The models chosen were:


Both models provide a good adjustment and an R2 of 99.9%. The percentage of the unmet demand was calculated taking in to account that the SR is the supply requirement or demand and SY is the supply yield or coverage of that demand.
Even though climate projections up to 2069 and 2099 were available, it was decided to generate climate projections based on equations 1 and 2, which take into account the output from WEAP where its results consider the population projections, rate of change of domestic, industrial and commercial consumption in the Sinú–Caribe river basin, and the percentage of losses in the supply system, among others. In addition, it was intended to do a coherent analysis of the 50–year economic life spam of the dam, where the adaptation strategy was proposed.
Figure 3 represents the ratio of the required supply and the UD, taking into account the limiting factors of the water resources and the baseline scenario. A baseline adaptation scenario is also presented, in which the initial condition of the required supply is reduced by 20%, which leads to the same reduction in the supply yield.
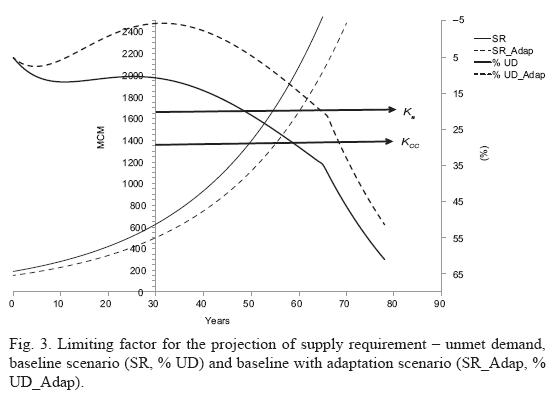
The 20% reduction is a hypothetical value, which is possible and feasible if small changes are made with regard to a more efficient water use (a reduction in consumption from the current 35 to 30%, for instance), a decrease in water losses in the systems from 15 to 10%, and the installment of more efficient water devices for another 5%.
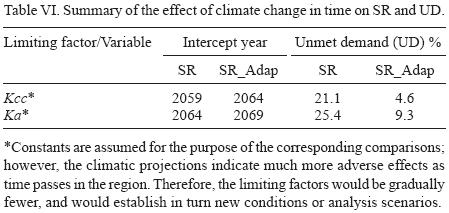
By following the curve of Figure 3 referring to the supply requirement or demand in the baseline scenario (SR), it is found that the unmet demand rises as it nears the limiting factors and the Kcc would be reached around the year 2059 and the Ka in 2064. That is, the required supply would equal the maximum amount of water available approximately 5 years earlier due to the effects of climate change. In addition, the point of intersection of SR with the KS, marks the beginning of a marked increase in the UD. The 0 on the horizontal axis of the graph represents current conditions (2009).
As the initial condition of the supply requirement is reduced by 20%, there is a displacement of this demand to the right (SR_Adap) of approximately 5 years at the points of intersection, and an important reduction in the UD, which counteracts and improves the effects of climate change to a certain extent (Table VI).
A similar behavior of the UD is observed when the SY nears the determined limiting factors, the points where the UD starts to rise at a much faster rate. As seen in Figure 4, the SY is very similar in both scenarios and tends to converge in time, but the difference in the UD is significant.
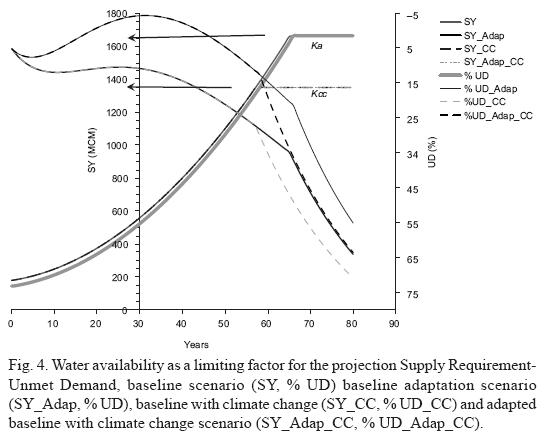
By following the curves of SY in Figure 4, it is clear that under current conditions, the Ka would be reached around the year 2074, at the point where the UD in the baseline and adapted baseline scenarios is 34.8 and 20.2%, respectively, and where the increase in the UD is accelerated, while the Kcc would be reached in the year 2066 (8 years earlier), with an UD in the baseline scenario of 27.1% and in the adapted baseline scenario of 11.4%. If from this point on the SY becomes constant (Kcc) and thereby the increase in the UD is accelerated, by 2074 there would be a UD of 46.8% and 33.6% in the baseline and baseline adaptation scenarios, respectively, that is, above the values found in current conditions in terms of the net natural supply.
As mentioned in the methodology section, according to studies by the IDEAM, the SI can be calculated by obtaining the ratio between the demand and the supply. For the purposes of this study, the SR is assumed to be current or baseline (Ka) and projected demand under climate change (Kcc). The results of this ratio in percentages are found in Figures 5 and 6.
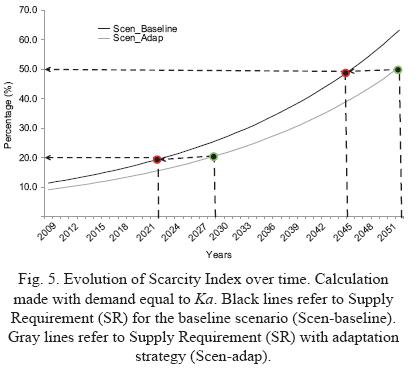
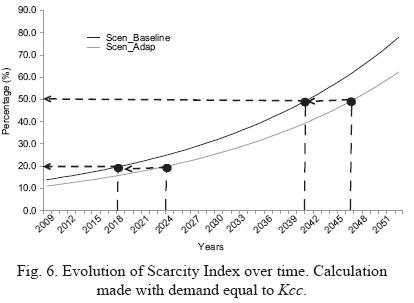
According to the IDEAM (2000a), five categories can be determined for this ratio: not significant (<1%, demand not significant with respect to supply), minimal (1–10%, very low demand), medium (11–20%, low demand), medium high (21–50%, considerable demand) and high (> 50%, high demand).
Up to the year 2001, the SI in the river basin was classified in the minimal category, that is, between 1 and 10%. According to the values shown in the above figures, the scarcity index would not move up to the medium category until the year 2023 in the baseline scenario under current conditions Ka, and until the year 2018 in the baseline scenario with climate change Kcc conditions, and not until 2029 and 2024 respectively, in the adaptation scenario. In the latter case, the SI would be categorized as medium high, until it reaches the high category in the 2040s (see Figures 5 and 6).
3.2. Effects of optimization of hydropower generation on the supply–demand balance in the Sinú–Caribe river basin
In order to obtain a better approximation of water use in the region of the Sinú–Caribe river basin, and to integrate the main productive sectors and activities, several scenarios are generated to mitigate and/or improve the negative effects projected on hydropower generation; with these scenarios it is also possible to observe the influence of the strategies on the unmet demand previously stated, with specific intervention in the most critical months of the year (February–April), when Ospina (2009) found a significant reduction in hydroelectric energy generation.
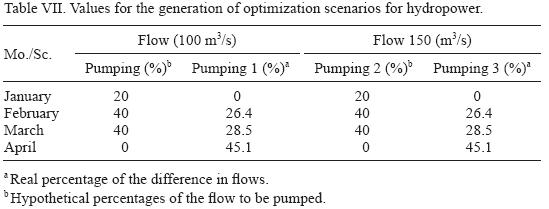
To create these scenarios, a new demand site called "pumping" is generated, whose purpose is to extract water downstream from the dam and provide water upstream or at the dam site (Fig. 1). These scenarios are generated with the weighted average, taking into account differing quantities of waterto be recycled in three months and differing start dates for pumping. The criteria used to estimate the amount of water to be pumped was the difference between the current flows and those proj ected in the weighted average scenario for the three most critical months (100 m3/s), compared to the effect of a larger volume (150 m3/s) on the previous difference and a water loss of 10% in the process (Table VII).
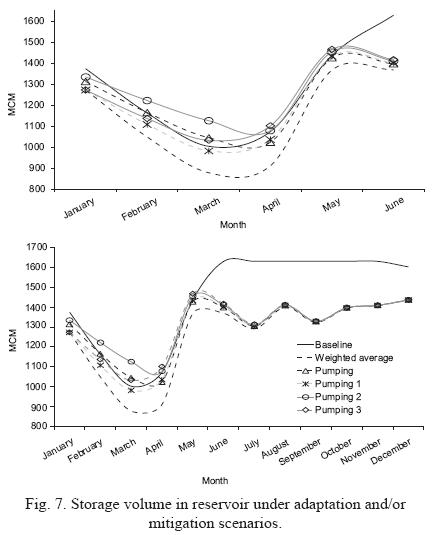
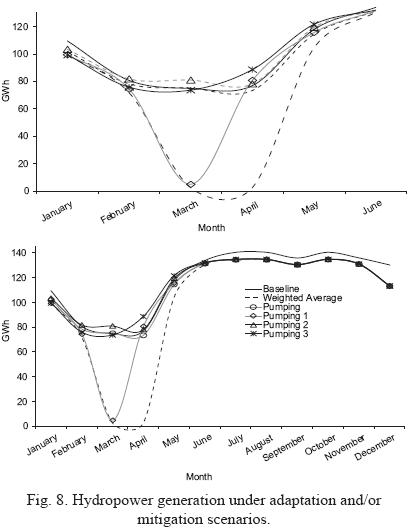
In Figures 7 and 8, a substantial improvement in the storage volume in the dam can be clearly seen, and the resulting generation of energy. By carefully examining the scenarios Pumping and Pumping 1 or Pumping 1 and Pumping 2 and Pumping 3, it is evident that the beginning of the pumping activity and the percentage or quantity of water pumped are fundamentally important, which suggests at the same time the high sensitivity of hydropower to the change in the storage volume of the reservoir. Therefore, the storage volume cannot be allowed to reach critical levels for hydropower generation and pumping must begin before these critical levels are reached.
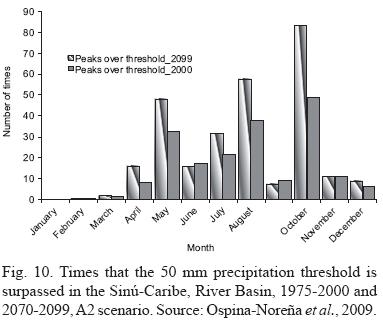
The effects of these scenarios on the unmet demand in the river basin are shown in Figure 9. All the scenarios show a decrease in this variable, especially those where the pumping is started in January. It is important to note that in this case, the new demand site (Pumping) acts as a flow regulator and could also function to extract water to another site in case of extreme precipitation events in some months. According to projections (Fig. 10), a major increase in the number of extreme events of precipitationis expected by the end of the century, thereby the flow regulation may avoid many disasters downstream, which have occurred previously.
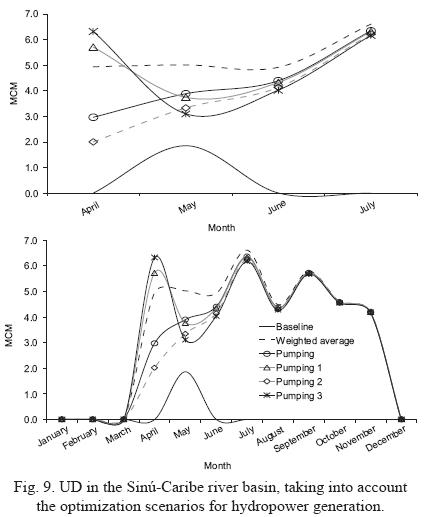
It is also important to highlight that in scenarios not presented here, where pumping is more than 150 m3/s, the UD starts to appear where it does not previously exist (January–April) and increases significantly with respect to the weighted average scenario, although hydropower generation is greater and reflects values superior to current ones. This should be analyzed in more detail since this situation could incite or foster conflicts between the productive sectors.
The concepts expressed above point out that the quantity of water to be pumped, and the schedule for starting such pumping, are two major factors when considering optimization of hydropower generation, as a strategy of adaptation.
Figure 11 shows the annual average changes in the generation of electricity, the storage volume in the reservoir and the unmet demand in the river basin, under hydropower optimization scenarios for the period 2010–2039.
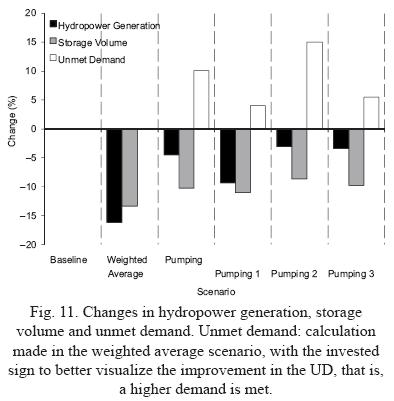
Taking into accountthese figures, the best scenario would be that of Pumping 2, which results in a decrease in the baseline scenario of only 3.1 and 8.7% in hydropower generation and stored volume, respectively, and a significant decrease of 15.1 % in the unmet demand in the weighted average scenario.
4. Conclusions
Water as a limiting factor in the Sinu–Caribe river basin highlights the fact that modifications in climatic–hydrological variables caused by climate change will have significant adverse effects on the physical and the biotic, like losses of physical, chemical, and mechanical properties of soils, changes in the flora and fauna structures, losses or changes in land cover and the economic and socio–cultural sectors of the region. According to the projections of the diverse variables that make up the analysis of supply–demand of water resources in the study area, it is estimated that for the period of the 2060s, the flow capacity of the river basin will be at a critical point, which could foster and incite serious regional conflicts. However, the negative effect on other elements of the analysis such as the scarcity index (SI) could occur much earlier.
It was found that the projections of the supply requirement (SR) and the supply yield (SY) could be modified in two ways: 1) by changing the initial or current conditions of water demand, and therefore supply, which could be made through regulations, higher efficiency in the supply and return infrastructure, management of water use strategies, and change in priorities, among others, and 2) by modifying the rates of change, which could be made by intervening the projections of the different variables involved in the demand, like the population growth, and increase in domestic, agriculture and commercial water use.
The proposed adaptation scenarios show that intervention in the initial conditions or in the rates of change of the demand at any time are beneficial and counteract in some way the adverse effects of climate change. However, this only saves some time, making it necessary to move forward with other studies on the adaptation and mitigation of the impact of climate change, including characterization and response to the different physical and biotic factors in terms of possible changes in the region, territorial legislation, and sectorization of agriculture and cattle ranching in areas appropriate for these activities.
Based on the projections forthe different scenarios, the current conditions of the degree of aridity and degradation in terms of biotic–physical factors of the river basin and the scarcity and stress on water resources will exacerbate with time. In this sense, the conservation of forests, vegetation and other elements of hydrological regulation, as well as the recuperation and reforestation of degraded and viable forestry areas, must be undertaken along with studies to redistribute productive agricultural areas and the prevention of their expansion.
The strategies chosen forthe optimization of hydroelectric energy generation in the most critical months provide a positive alternative to mitigate the projected adverse effects of potential climate changes in the region, given that they result in less decrease in the electrical energy generated and a greater storage volume of the reservoir, in comparison to the baseline scenario, in addition to a lesser unmet demand in the weighted average scenario. The optimization of electrical energy strategies show that it is fundamental to determine with a high degree of precision the exact quantities and timing of the flow to be pumped, so that the supply–demand ratio of the different sectors and/or downstream activities improves or is maintained, otherwise, it becomes a negative factor in this ratio, starting or causing diverse conflicts over water resources.
Acknowledgements
The authors thank to the Centro Virtual de Cambio Climático de la Ciudad de México and to the Instituto de Ciencia y Tecnología del Distrito Federal (ICyTDF) for its financial support. Also thanks to Claudio Amescua for his valuable comments about writing and document structure.
References
Ashton P. J., 2002. Avoiding conflicts over Africa's water resources. Ambio 31, 236–242. [ Links ]
De Wit M. and S. Jacek, 2006. Changes in surface water supply across Africa with predicted climate change. Africa Earth Observatory Network, Science Express Report. University of Cape Town. Rondebosch 7701, South Africa, 9 pp. [ Links ]
Few R., M. Ahern, F. Matthies and S. Kovats, 2004. Foods, health and climate change: a strategic review. Tyndall Centre for Climate Change Research. Working Paper No. 63, Norwich, 138 pp. [ Links ]
IDEAM, 2000a. Estudio Nacional del Agua. Instituto de Hidrología, Meteorología y Estudios Ambientales, Colombia, 39 pp. [ Links ]
IDEAM, 2000b. La atmósfera, el tiempo y el clima. Instituto de Hidrología, Meteorología y Estudios Ambientales. Colombia, 80 pp. [ Links ]
IDEAM, 2000c. Flujo de materiales y energía en la economía colombiana. Instituto de Hidrología, Meteorología y Estudios Ambientales. Colombia, 52 pp. [ Links ]
IDEAM, 2001. Colombia: Primera Comunicación Nacional ante la Convención Marco de las Naciones Unidas sobre el Cambio Climático. Instituto de Hidrología, Meteorología y Estudios Ambientales. Colombia, 271 pp. [ Links ]
IPCC, 2001a. Special report on emission scenarios. A Special Report of Working Group III. WMO, UNEP, USA, 27 pp. [ Links ]
IPCC, 2001b. Third Assessment Report: Impacts, Adaptation and Vulnerability. Climate Change. Contribution of Working Group II to the Third Assessment Report, Intergovernmental Panel on Climate Change. WMO, UNEP, USA, 110 pp. [ Links ]
IPCC, 2007a. Summary for Policymakers. In: Climate Change 2007: The Physical Science Basis. Contribution of Working Group I to the Fourth Assessment Report of the Intergovernmental Panel on Climate Change. (S. Solomon, D. Qin, M. Manning, Z. Chen, M. Marquis, K. B. Averyt, M.Tignor and H. L. Miller, Eds.). Cambridge University Press, Cambridge, United Kingdom and New York, NY, USA, 18 pp. [ Links ]
IPCC, 2007b. Summary for Policymakers. In: Climate Change 2007: Impacts, Adaptation and Vulnerability. Contribution of Working Group II to the Fourth Assessment Report of the Intergovernmental Panel on Climate Change. (M. L. Parry, O. F. Canziani, J. P. Palutikof, P. J. van der Linden and C. E. Hanson, Eds.). Cambridge University Press, Cambridge, UK, 7–22. [ Links ]
Mayr J., 2006. Up in smoke? Latin America and the Caribbean. The threat from climate change to the environment and human development. The Third Report from the Working Group on Climate Change and Development. Published by the New Economics Foundation. UK, 48 pp. [ Links ]
McMichael A. J., D. Campbell–Lendrum, R. S. Kovats, S. Edwards, P. Wilkinson, N. Edmonds, N. Nicholls, S. Hales, F. C. Tanser, D. Le Sueur, M. Schlesinger and N. Andronova, 2004. Climate change in comparative quantification of health risks: global and regional burden of disease due to selected major risk factors (M. Ezzati, A. D. Lopez, A. Rodgers and C. J. L. Murray, Eds.). World Health Organization. Geneva, Ch. 20, 1543–1649. [ Links ]
Nicholls R. J., 2004. Coastal flooding and wetland loss in the 21st Century: changes under the SRES climate and socio–economic scenarios. Global Environ. Chan. 14, 69–86. [ Links ]
Ospina J. E., 2009. Efectos del cambio climático en la generación hidroeléctrica con énfasis en proyecciones de generación–transmisión eléctrica en Colombia. Ph. D. Thesis on Atmospheric Physics. Programa de Posgrado en Ciencias de la Tierra, Universidad Nacional Autónoma de México, México, D.F., 206 pp. [ Links ]
Ospina–Noreña J.E., C. Gay., C. Conde., V. Magaña. and G. Sánchez, 2009a. Vulnerability of water resources in the face of potential climate change: generation of hydroelectric power in Colombia. Atmósfera 22, 229–252. [ Links ]
Ospina–Noreña J.E., C. Gay., C. Conde. and G. Sánchez, 2009b. Analysis of the water supply–demand relationship in the Sinú–Caribe Basin, Colombia, under different climate change scenarios. Atmósfera 22, 331–348. [ Links ]
Sieber J. and D. Purkey, 2007. Water Evaluation and Planning System USER GUIDE for WEAP21. Stockholm Environment Institute, U. S. Center, 219 pp. [ Links ]
Turnpenny J., 2002. Power, politics and science: Development of the UKCIPO2 climate change scenarios for the UK. Presentation at the AIACC Course on Development and Applications of Scenarios in Impacts, Adaptation and Vulnerability Assessments. Norwich, UK, April 15–26. [ Links ]
UNFCCC, 2006. Application of environmentally sound technologies for adaptation to climate change. United Nations Framework Convention on Climate Change. Technical paper FCCC/ TP/2006/2 10 May 2006. 107 pp. [ Links ]
UNFCCC, 2005. Compendium on methods and tools to evaluate impacts of, and vulnerability and adaptation to, climate change. United Nations Framework Convention on Climate Change, 155 pp. [ Links ]
UNEP, 2007. Global outlook for ice and snow. United Nations Environment Programme. 235 pp. Available at: http://www.unep.org/geo/geo_ice/PDF/full_report_LowRes.pdf. [ Links ]
UNFCCC, 2008. Climate change: Impacts, vulnerabilities and adaptation in developing countries. United Nations Framework Convention on Climate Change. Countries' available from http://unfccc.int/resource/docs/publications/impacts.pdf. Consultado en Julio de 2009. [ Links ]

