


Servicios Personalizados
Revista
Articulo
 Inglés (pdf)
 Artículo en XML
 Referencias del artículo
 Enviar artículo por email
Indicadores
-
 Citado por SciELO
 -
 Accesos
Links relacionados
-
 Similares en
SciELO
Similares en
SciELO
Compartir

 Permalink
Atmósfera
versión impresa ISSN 0187-6236
Atmósfera vol.23 no.4 Ciudad de México oct. 2010
Evaluation of urban–rural bioclimatic comfort differences over a ten–year period in the sample of Erzincan city reconstructed after a heavy earthquake
S. TOY
Meteorological Institute of Erzurum, Turkey
S. YILMAZ
Ataturk University, Faculty of Agriculture, Department of Landscape Architecture,
25240, Erzurum, Turkey. Corresponding author: S. Yilmaz; email: sevgiy@atauni.edu.tr.
Received November 2, 2009; Accepted September 7, 2010
RESUMEN
En este trabajo se trató de determinar el grado de los efectos de una ciudad de tamaño mediano bien planeada, Erzican, en Turquía, sobre las condiciones de confort térmico humano. Para lo anterior se compararon los resultados de los cálculos de confort térmico por medio de datos meteorológicos (1999 a 2008) de zonas urbanas y rurales con el índice termohigrométrico (THI, por sus siglas en inglés) y el voto medio promedio (PMV, por sus siglas en inglés), siendo estos dos los índices más utilizados para determinar condiciones bioclimáticas. De acuerdo con los resultados, el efecto de la ciudad sobre el confort térmico humano no es estadísticamente significativo (p = 0.0001) y el valor del porcentaje de diferencia entre las áreas fue de 2.2 y 0.7 % (la ciudad es más confortable) para THI y PMV, respectivamente. Se evaluaron las características de la ciudad para el confort térmico humano y se ofrecen algunas sugerencias para mejorar la calidad ambiental de las áreas urbanas considerando los principios de la arquitectura del paisaje y la planeación del uso del suelo.
ABSTRACT
In this study, the extents of the effects of a medium–sized, unindustrialized and well planned city, Erzincan, in Turkey on human thermal comfort conditions tried to be determined comparing the results of thermal comfort calculations, by means of meteorological data (from 1999 to 2008) taken from rural and urban areas and thermohygrometric index (THI) and predicted mean vote (PMV), two of the most widely used bioclimatic condition calculation indices. According to the findings, the effect of the city on human thermal comfort was found to be statistically not significant (p = 0.0001) and percentage difference of index values between the areas were 2.2 and 0.7% (urban is more comfortable) for THI and PMV, respectively. Urban characteristics of the city were evaluated for human thermal comfort and some suggestions were offered to improve the environmental quality of urban areas considering the principles of landscape architecture and land use planning.
Keywords: Human thermal comfort, urban area, rural area, thermo–hygrometric index (THI), predicted mean vote (PMV).
1. Introduction
If natural factors such as topography and elevation are considered to remain the same, differences in climatic features in urban areas can be said to result mainly from two interrelated factors: urban surface structures and anthropogenic activities. Transformation of natural surfaces into urbanized ones and anthropogenic activities in these areas mainly alter the radiation balance causing albedo differences and lowering air quality because of particles and gases released into atmosphere. As the result of these combined effects and additional heat emission of anthropogenic activities requiring combustion (e.g. industry and traffic), urban environments are generally found to be warmer than its natural/rural counterparts with a varying degree (Figuerola and Mazzeo, 1998; Sakakibara and Owa, 2005; Stone, 2007; Yilmaz et al., 2007a; Bulut et al., 2008; Toy and Yilmaz, 2010). Altered surfaces of urban areas can also cause windless environments where tall and densely constructed buildings may serve as obstacles to wind. Imbalances in the characteristics of urban atmosphere caused by the factors such as dense construction and land use variations, which turn natural surfaces into impervious ones, can generally cause drier urban atmosphere depending on time of the day and year (i.e. drier urban centres in the afternoon and early evening, but moister at night; Jáuregui and Tejeda, 1997; Unkasevic et al., 2001; Saffell and Ellis, 2002; Robaa, 2003; Sakakibara et al., 2006; Liu et al., 2009). Due to the modified climatic features of urban areas, where mostly increased temperature, reduced wind speed and water vapour conditions are prevalent, urban people have to live and perform their labour or leisure (recreational) activities in thermally stressful outdoor environments. Quality of urban outdoor spaces can determine also the quality of life led by urban people directly affecting public health and psychology and indirectly the economy of a country.
Total or partial effects of urban areas with their different aspects (e.g. street canyons or urban trees) on human thermal comfort are now under the consideration of many scientists from different parts of the world. For instance, effects of street geometry on human thermal comfort were investigated by Ali–Toudert and Mayer (2007), effects of urban trees were researched in details by McPherson et al. (1994), effects of different surfaces were studied by Yilmaz et al. (2007b), total effect of urban area on bioclimatic comfort was investigated by Toy et al. (2007).
Scientists' interests on the determination of thermal comfort conditions began at the beginning of last century. According to Epstein and Moran (2006), since 1905, when Haldane made the first comments on wet–bulb temperatures as a measure of thermal stress, nearly forty different human thermal comfort indices have been developed and used. Among them, Thom's (1959) Discomfort Index (DI), Givoni's (1963) Standard Equivalent Temperature (SET), Fanger's (1970) Predicted Mean Vote (PMV) and Höppe's (1999) Physiological Equivalent Temperature (PET) are major and most used ones. Some of these indices, such as DI, use only the relative effects of a few meteorological parameters on human thermal comfort, whereas others (e.g. PET and PMV) consider not only the effects of almost all meteorological parameters but also combined effects of personal features and other factors such as performed activity and the effects of clothing.
In Turkey, urbanization, together with the changes in general global circulations, is taken responsible for the changes in long–term temperature trends (Türkes et al., 2002; Türkes and Sümer, 2004). Urbanization in Turkey gained momentum in the 1950s (Kongar, 1976) and by early 1980s urban population exceeded the rural population of Turkey.
Even though the eastern part of Turkey is less overpopulated than other parts, the cities in this part are developing distortedly without considering the principles of landscape architecture and urban planning. Therefore, people in this region have to live in bioclimatically uncomfortable urban environments even in small and unindustrialized cities. For instance, in a study by Toy et al. (2007) in Erzurum, a small and unindustrialized Turkish city in Eastern Anatolian region, it was determined that bio–climatologically comfortable conditions are prevalent in only 10% of ten–month study period. In the mentioned part of Turkey, outdoor recreation is very important because of hard climatic conditions causing short recreation period mainly in summer.
The objective of this study is to determine the effect of a medium–sized, less populated, unindustrialized and well–planned Turkish city, Erzincan, on human thermal comfort conditions by comparing the results of thermal comfort calculations, which were performed using meteorological data taken from rural and urban areas of the city simultaneously over a ten–year period from 1999 to 2008. In general, urban thermal comfort studies are mainly on the effects of urban structures e.g. urban canyons or green areas, on thermal comfort conditions (e.g. Streiling and Matzarakis, 2003; Ali–Toudert and Mayer, 2007; Thorsson et al., 2007; Toy et al., 2007; Mayer et al., 2008; Ohashi et al., 2008) or total effects of the properties of large or moderate cities on thermal comfort (e.g. Unger, 1999; Spagnolo and de Dear, 2003) in the world. When it comes to Turkey, the number of the studies on outdoor thermal comfort conditions is very limited, except for Cinar (2004), Toy et al. (2007) and Toy and Yilmaz (2010a) in spite of the importance of the topics for Turkish people. This study can also give some opinions about the effects of urban areas on human thermal comfort in a city which was designed very closely to the ideal. Therefore, the study looks into the topics from reverse angle by investigating the possible reduced effects of a well designed city on human thermal comfort and offers some suggestions to improve the environmental quality of urban areas considering the principles of landscape architecture. However, other studies have investigated the negative characteristics of urban areas and their unfavourable impacts on human thermal comfort. In this way, it can be determined which idealized urban design approaches are comfortable in both infrastructure and bioclimatic respects.
2. Material
The city of Erzincan, which is at an average elevation of 1185 m in the Eastern Anatolia geographical region of Turkey, between 39° 02' and 40° 05' N, and 38° 16' and 40° 45' E (Fig.1), was chosen as the study area because of being a well–planned, medium–sized, unindustrialized and less populated city, where green area rate per capita is relatively high, in convenience with the aim of the study.
The city has gained these positive urban characteristics not with deliberate designs but due to an obligation after two big earthquakes that happened in the near past. The city is located nearly on the North Anatolian Fault, which is known to have caused more than 30 quakes since 1268 A.D., and among them, one on 27 December 1939 caused the city to be moved in its present place. In the last earthquake, which happened on 13 March 1992, 653 people were killed and 3850 people were injured while 4427 residences and 972 workplaces were completely destroyed. Following this disaster, the city was re–established at the second time and modern urban architecture techniques were applied in the city. Today, streets in the city are wide and convenient with the planning attempts in the future. The city shelters light industries, e.g. one sugar beet processing factory, one steel and iron products factory, a few flour and floury product factories, a few animal feed factories, a brick production facility, a dairy product factory and a plastic product factory. Surface area of the city center is 1622 km² and green area amount per capita is 11.1 m², which is among the largest in Turkey (Anonymous, 2005).
The city has relatively mild continental climate compared to its surrounding cities which are founded at the height above 1500 m, because height of the plain where the city is located is lower than these cities. This plain is surrounded by very high (up to 3345 m) and steep mountains (Anonymous, 2005), because of which the city remains far from the marine effects, although it is close to the Blacksea Region, which is the wettest part of Turkey. According to the census conducted by Turkish State Statistics Institution based on addresses in 2007, population of the city center was found to be 86 779 (Anonymous, 2008). The city was categorized in the medium urban class in studies related to climate change (Türkes et al., 2002; Türkes and Sümer, 2004) according to its population.
Consistent meteorological observations have been carried out since 1937 in the city. The first meteorological station began to be operated in the city center at an elevation of 1218 m and a location of 39° 45' 30'' N and 39° 29' 12''E. According to the mean meteorological values measured at this station between 1975 and 2007, mean yearly temperature is 10.8 °C; the coldest month of the year is January with a mean temperature of –2.9 °C, while the warmest is July with a mean temperature of 24.0 °C; mean yearly maximum temperature is 17.3 °C; mean yearly minimum temperature is 4.9 °C; maximum temperature ever recorded in the city is 40.6 °C, while minimum is –25.0 °C. Annual rainfall is 381.3 mm; mean number of snow covered days is 43.6 days and mean annual relative humidity is 62.6%. Mean yearly wind speed is 1.5 m/s, first and second prevalent wind directions are ENE and WSW, respectively.
3. Meteorological data
In addition to the first established meteorological station, which is considered to represent urban area, the second station, which is thought to be rural station, was established in the airport property at an elevation of 1154.4 m and a location of 39° 42' N and 39 ° 31' E in 1997 and hourly meteorological data began to be obtained on 1 May 1998. Meteorological data used for the calculation of thermal comfort conditions in the study was obtained from both of these stations.
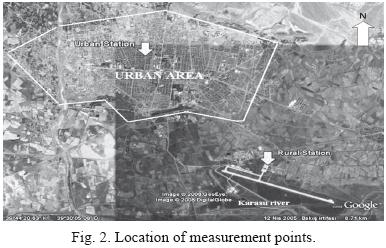
Urban station is in the ground of Meteorological Office and nearly in the middle of the city. It is surrounded by substreets, roads, and 3–4–storey buildings. Relatively tall buildings, densely populated areas around the station and traffic load, though not heavy, are thought to affect the measurement area. Pavements are covered with asphalt and concrete surface and there is no moisture supply around the area. Rural station at the city's airport is 5 km from the city in eye bird view. The airport is surrounded by the vast open area in all directions, but there is a small village about 1 km away from measurement point and a river, Karasu, flows in about 2 km distance. There are no anthropogenic effects around the station except for cultivation not needing irrigation (Fig. 2).
Such stations as mentioned above were considered to represent rural and urban areas in many studies, e.g. Unger (1999), Robaa (2003), Yilmaz et al. (2007a) and Bulut et al. (2008), and these stations are regularly controlled and measurement devices are calibrated by the Turkish State Meteorological Service.
From both stations, daily means of air temperature (Ta, °C), relative humidity (RH, %) wind speed (Ws, ms–1) and cloud amount (CA, octas) were taken to be used in thermal comfort indices, which are measured in a shelter with louvered screen (so–called Stevenson Screen) at the height of 2 m, which is a standard means of measurement on the ground accepted all over the world (Anonymous, 2001). Because full–year data is unavailable for rural station in 1998, meteorological values required for the calculations were taken from 1999 to 2008, totaling 10 years. Simultaneous daily means of data were derived from data measured in both stations over 24 hours.
4. Method
Even though today there are many complex and simple thermal comfort equations in use, "most of them share many common features and can be classified in two groups: empirical or rational" (Ali–Toudert, 2005). While empirical indices take the combined effects of a few meteorological parameters (e.g. Ta and RH) and "ignore the decisive role of human physiology, activity, clothing and other personal data (height, weight, age, sex), rational indices are more recent, promoted by the lately development of computing techniques, and rely on the human energy balance" (Ali–Toudert, 2005).
In the present study, thermohygrometric index (THI) or DI of Thom (1959), which are among the empirical and most used (e.g. Unger, 1999; Emmanuel, 2005; Toy et al., 2007; Yilmaz et al., 2007a; Antoniou et al., 2008) thermal comfort indices, and PMV (Fanger, 1970), which can be defined as complex and is based on human energy balance, were used to calculate human thermal comfort conditions.
THI can calculate human thermal comfort conditions based solely on the relative effects of Ta and RH, especially under windless conditions and give the results in Celsius degree (Unger, 1999). It employs a simple linear equation:
THI (°C) = t – (0.55 – 0.0055f) (t – 14.5),
where t represents Ta (°C) and f, RH (%) (Unger, 1999).
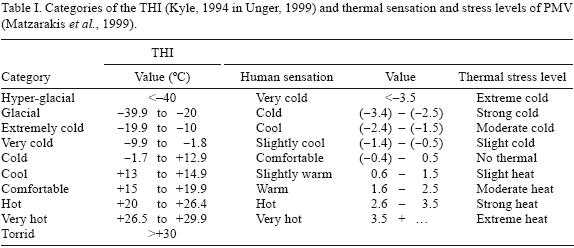
Results are evaluated considering the predetermined categories in a table (Table I), which classifies the comfort conditions according to human sensation of temperature. Comfort categories of THI index were used as was in the several previous studies (Unger, 1999; Toy et al., 2007; Yilmaz et al., 2007a; Antoniou et al., 2008) since the adaptation of these categories to a specific location is a difficult and time consuming work (as in the example of Lin and Matzarakis, 2008) and also this method can ease the comparison of the results from previous studies with the new ones in order to have an insight into thermal comfort conditions.
This index was used in the study to compare thermal comfort conditions in urban and rural areas of the city since it can give simple and precise results by which some opinions about the conditions can be gained as in other studies (such as Unger 1999; Toy et al., 2007; Yilmaz et al., 2007a; Antoniou et al., 2008).
Another index used in the study, PMV of Fanger (1970), is an energy–balance–based human thermal comfort index, which has been applied widely (Fanger, 1970; Fanger et al., 1974; McGregor et al., 2002). PMV represents the predicted mean vote on a thermal sensation scale of a large population exposed to a given set of ambient conditions. This index is derived by relating empirically the human heat balance to a vote of thermal sensation. The PMV equation is a steady–state model. It establishes a thermal strain based on steady–state heat transfer between the body and the environment. Once the strain has been calculated, a thermal comfort vote, which represents the thermal sensation, is assigned to the calculated level of strain (McGregor et al., 2002). In really extreme weather situations PMV can be higher than 3.5, or lower than –3.5 (Höppe, 1993, 1999; Mayer and Matzarakis, 1997; Gulyas et al., 2003). PMV predicts the mean assessment of the thermal environment for a large sample of human beings by value according to the seven–step ASHRAE comfort scale (Höppe, 1993, 1999; Mayer and Matzarakis, 1997). PMV is used in this study as it is one of the bioclimatic comfort assessment indices with THI. Thermal sensation and stress levels of both PMV and THI are given in Table I.
Human thermal comfort conditions were calculated according to PMV using one of the recently used radiation and bioclimate models, RayMan (Matzarakis et al., 2000, 2007; Matzarakis and Rutz, 2005). RayMan is well–suited to calculate radiation fluxes (Mayer and Höppe, 1987), and thus, all calculations for PMV in the study were performed using this model. The RayMan model, developed according to the Guideline 3787 of the German Engineering Society (VDI, 1998), calculates the radiation flux in simple and complex environments on the basis of various parameters, such as air temperature, air humidity, degree of cloud cover, time of day and year, the albedo of the surrounding surfaces and their solid–angle proportions. Besides the meteorological parameters, the model requires input data on the surface morphological conditions of the study area and on personal parameters (Gulyas and Matzarakis, 2007).
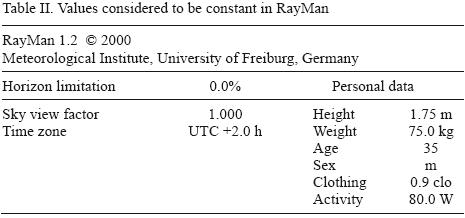
About thermo–physiological features taking place in thermal comfort analysis, age, sex, height, weight, clothing insulation (in clo units), physical activity and position (sitting or standing) of a ''typical European male'' (35 years old, 1.75 m tall, weight 75 kg) were considered (as it was in Gulyas et al., 2006) in RayMan. Values considered to be constant in the calculation of PMV for urban and rural areas are given in Table II.
Thermal comfort conditions were calculated on daily basis using daily mean air temperatures and relative humidity values obtained over 24 hours on 3653 days (10 years). Percentage distribution of comfort categories was determined for months. This method was adopted in the study since the calculation of daily mean thermal comfort conditions can give more detailed results than those with monthly mean values.
For the comparison of THI and PMV values between urban and rural areas 2–tailed t test was used with the confidence interval of 0.05.
5. Results
From the evaluation of the results, it was found that both THI and PMV values are higher in urban area than those in rural area nearly all year round, except for December for THI (Table III and Fig. 3).
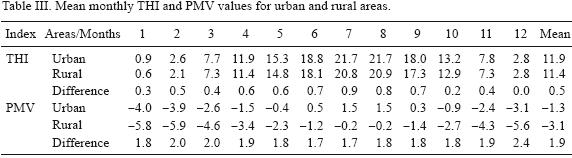
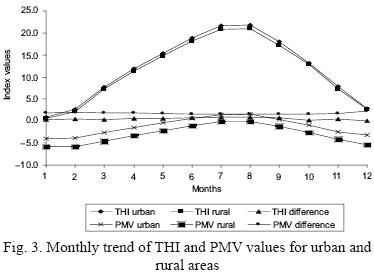
Mean annual THI and PMV differences between the areas are 0.5 °C and 1.9, respectively, while maximum differences were found to be 0.9 °C and 0.8 °C in July and August for THI and 2.4 in December for PMV, and minimum were 0.0 °C in December for THI and 1.7 in June and July for PMV. Trends in THI and PMV values and differences of THI values between the areas are parallel to the seasonal temperature changes; however, differences of PMV values between the areas do not suit seasonal trends (Fig. 3).
Mean yearly distributions of thermal comfort ranges according to the months over ten years are presented in Figures 4 a, b, c, d for urban and rural areas, respectively. It can be seen from the figures that the number of THI categories prevalent in urban and rural areas is the same (six; extremely cold, very cold, cold cool, comfortable and hot), while those of PMV are different between the areas; in urban area seven categories (very cold, cold, cool, slightly cold, comfortable, slightly warm and warm) are seen and in rural area warm category is not seen.
From the mentioned figures, it can clearly be said that the same comfort categories are seen in the same months in both areas and indices except for warm category of PMV in July, even if the prevalence of the categories is different for months. In urban and rural areas, the most prevalent comfort range is cold for THI and very cold for PMV, while hot range in THI and slightly warmrange in PMV are seen more prevalently in urban area than in rural area. An additional range warm in PMV is seen in urban area. "Comfortable" range is seen in urban area less than in rural for both indices.
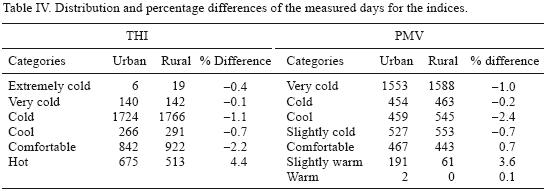
Table IV presents the distribution and percentage differences by categories in the study period of ten years (3653 days) for urban and rural areas. According to the table, it can be seen that the number of comfortable days is larger in rural area than in urban for THI but not for PMV, while in rural area, the number of the days when cold stress prevails (i.e. extremely cold, very cold, cold and cool ranges) is larger than in urban area for both indices. However, the number of days heat stress is prevalent (i.e. slightly warm, warm and hot ranges) is larger in urban than in rural. When the percentage values and number of days in only comfortable range is considered, it can be seen that the city has affected human thermal comfort in the rate of 2.2%, which is the difference between the percentages of comfortable ranges in urban and rural areas for THI, but for PMV, urban is 0.7% more comfortable than the rural even though the differences between the number of days are not large and statistically significant (2–tailed p = 0.0001).
6. Discussion and conclusion
Both thermal and human thermal comfort conditions in urban areas can widely be affected by the different features of urban areas, where very different climatic conditions are prevalent from their rural counterparts. Therefore, as the number of the features which have negative impacts on climate and thermal comfort conditions increases, liveability of urban areas decreases when the bioclimatic comfort conditions are considered.
In the present study, it may be thought that differences in thermal comfort conditions obtained from urban and rural stations might have resulted from the differences in elevation and measurement accuracy. In this respect, it can be said that even though elevation has some effects on climatic elements, in the present study difference in elevation is lower than 100 m (64 m) between the areas, which was accepted not to affect climatic elements as stated in previous studies such as Baker et al. (2002), Yilmaz et al. (2007a) and Bulut et al. (2008). When it comes to the measurement standards and accuracy, it can be stated that both the stations taken into consideration and its devices are regularly serviced and controlled by the Turkish State Meteorological Service considering the standards of World Meteorological Organisation. Therefore it can be said that differences are caused by the characteristics of urban and rural areas.
There is a true and close relationship between urban thermal environments and city size (Oke, 1973; Landsberg, 1981; Karl et al., 1988; Arnfield, 2003; Zhou et al., 2004; Jáuregui, 2005; Hughes, 2006); presence of industrial areas and motor– vehicle traffic (Ackerman, 1977; Oke, 1987; Kottmeier et al., 2007); population (Landsberg, 1981; Karl et al., 1988); urban density and presence of street canyons (Landsberg, 1981; Roth et al., 1989; Oke et al., 1991; Eliasson, 1996; Bonacquisti et al., 2006; Ali–Toudert, 2005; Ali–Toudert and Mayer, 2007) and negative relationship with the amount of vegetation cover (Park, 1986; Cotton and Pielke, 1995; Taha, 1999; Wong and Yu, 2005; Eliasson and Svensson, 2003; Charalampopoulos and Chronopoulou, 2005; Kottmeier et al., 2007; Jusuf et al., 2007; Yilmaz et al., 2007).
In the study, the city of Erzincan was evaluated in respect of thermal comfort conditions. The city is, in summary, a medium–sized, unindustrialized, less populated and well–planned and planted city. It can therefore be expected that the city has relatively less negative impacts on human comfort.
Because of socio–economical reasons, in Turkey there is a consistent human population movement from the city of Erzincan to larger cities (Anonymous, 2005). For that reason, the city has less population than other cities in Turkey and as a result of this condition surface area of the city center is smaller.
Since the city was re–established two times after violent earthquakes, architecture of the city was well–established according to modern urban architecture techniques. Therefore, streets are wide and there is no building with more than four storeys and no street canyon effect can be mentioned in the city center.
In urban environments, open green spaces not only contribute to urban image and aesthetics, but also improve urban climate. These spaces may be considered as a favourable factor on decreasing the urban–rural climatic differences. Vegetation cover causes heat reduction via two mechanisms: by shading surface and adding moisture to atmosphere through evapotranspiration. In respect of land use or rate of green and impervious areas, the city of Erzincan has a considerably large green area amount per capita. The reason for this is that in addition to enough spaces left for green areas in the new establishment process, the city has relatively mild climate for diverse plants to grow.
Green areas in cities have been considered as potential measure in mitigating the urban heat island (UHI) effect (Wong and Yu, 2005) and in order to reduce the effects of urban heat island and mitigate them and consequently to live in a better environment, future research should be focused on design and planning parameters (Jusuf et al., 2007; Rizwan et al., 2008). Land use planning and design are the work fields of landscape architects, where a well–balanced urban structure must be aimed with appropriate plantation by leaving enough open green spaces. Consequently, in the study, it was found that urban–rural temperature differences are lighter in Erzincan with larger green area amount, well–planned streets, not tall buildings and less vehicle number than in Erzurum with lower open–green space rate, distorted settlement and more vehicles.
As a result of the favourable characteristics of the city for human thermal comfort, differences between urban and rural thermal comfort conditions (in THI and PMV values) is lower and statistically not significant. Mean THI difference between the urban and rural areas of the city is only 0.5 °C and all year differences for the months are regular and parallel to the seasonal temperature changes, which shows the urban effect is small. However, in another study (Toy, 2004), carried out in Erzurum, which is located in the same region and very closely to Erzincan, maximum THI difference was found to be in December due to air pollution. The mentioned city is more populated than Erzincan and exposed to air pollution more frequently in especially cold winter months because of heavy fuel combustion (i.e. low quality coal).
According to the percentage distribution of the THI categories, comfortable range is prevalent in the city center in the rate of 25.2% while in rural areas it is 23%, which is an insignificant difference. In a similar study (Unger, 1999), carried out in the middle size city of Szeged, Hungary, this rate was found to be 30% for urban and 20% for rural areas. Percentage difference in comfortable category in the mentioned study (10%) is larger than that found in the present study (2.2%) due to the larger size of Szeged and of its population.
In our study, PMV values are not consistent with THI values because the number of comfortable days in urban area is larger than rural. The reason for this may be PMV categories, since in the season when comfortable range is expected to be prevalent, slightly warm category is prevalent. This may be a problematic situation for PMV categories and these categories should be adapted to this part of the world. If the favorable characteristics of the bioclimatic comfort indices are considered, then it can be said that THI index has shown more favorable characteristics for the evaluation with suitable ranges to the study area, even though PMV is the more complex and comprehensive index.
This study has shown that if a city has favorable characteristics in both planning and size, its effects on human thermal comfort may be smaller. Therefore, in urban and land use plans and designs, great care should be taken to avoid the construction of the dense, overpopulated, deforested and thermally uncomfortable environments. Related professionals whose work fields are planning and designing, e.g. landscape architects and urban planners, should seek new ways of providing healthy environments for people considering the basic principles of their occupations, e.g. leaving enough vegetated spaces. Another approach for the construction of thermally comfortable environments may be the clustering of newly developing cities by placing large green areas between them and by reducing the size of population and surface areas of the settlements. Since the number of such studies in developing countries like Turkey is insufficient, their quality and quantity should be increased in order to provide local people with more liveable urban environments.
References
Ackerman T. P., 1977. A model of the effect of aerosols on urban climate with particular attention to the Los Angeles Basin. J. Atmos. Sci., 34, 531–547. [ Links ]
Ali–Toudert F. 2005. Dependence of outdoor thermal comfort on street design in hot and dry climate ber. Meteor. Inst. Univ. Freiburg Nr. 15. 224 p. Dissertation, angenommen von der Fakultät für Forst– und Umweltwissenschaften der Albert–Ludwigs–Universität Freiburg. [ Links ]
Ali–Toudert F. and H. Mayer, 2007. Thermal comfort in an east–west oriented street canyon in Freiburg (Germany) under hot summer conditions. Theor. Appl. Climatol. 87, 223–237. [ Links ]
Anonymous, 2001. Joint Aviation Authorities Airline Transport Pilot's Licence. Theoretical Knowledge Manual. 050 Meteorology. Oxford Aviation Service Limited. Published by Jeppesen GmbH, Frankfurt, Germany. [ Links ]
Anonymous, 2005. Environmental Condition Report of Erzincan City. Erzincan Governorship Environment and Forest Administration, Erzincan, 235 pp. (http://www.cedgm.gov.tr/icd_raporlari/erzincanicd2006.pdf). [ Links ]
Anonymous, 2008. Database of census based on address system of Turkish State Prime–ministry Turkish Statistic Institution cited from the official web site of Erzincan governorship. (http://www.erzincan.gov.tr/nufus.htm). [ Links ]
Antoniou A., I. Larissi, A. Maitos, and A. G. Paliatsos, 2008. Case studies on discomfort levels in different regions in Athens, Greece. International Scientific Conference SynEnergy Forum (S.E.F.) The conference for International Synergy in Energy, Environment, Tourism and Information Technology. II. Energy/ Environment II Session 4. Spetses, Greece 28–31 May 2008. 8 pp. http://synenergy.teipir.gr/papers/II_4.pdf. [ Links ]
Arnfield A. J., 2003. Two decades of urban climate research: a review of turbulence, exchanges of energy and water, and the urban heat island. Int. J. Climatol. 23, 1–26. [ Links ]
Baker L. A., A. J. Brazel, N. Selover, C. Martin, N. McIntyre, F. R. Steiner, A. Nelson and L. Musacchio, 2002. Urbanization and warming of Phoenix (Arizona, USA): Impacts, feedbacks and mitigation. Urban Ecosystems 6,183–203. [ Links ]
Bonacquisti V., G. R. Casale, S. Palmieri and A. M. Siani, 2006. A canopy layer model and its application to Rome. Sci. Tot. Environ. 364, 1–13. [ Links ]
Bulut Y., S. Toy, M. A. Irmak, H. Yilmaz and S. Yilmaz, 2008. Urban–rural climatic differences over a 2–year period in the City of Erzurum, Turkey. Atmósfera 21, 121–133. [ Links ]
Charalampopoulos I. and A. S. Chronopoulou, 2005. Mapping the urban green area influence on local climate under windless and light wind conditions. The case of western part of Athens, Greece. Acta Climatologica et Chorologica 38–39, 25–31. [ Links ]
Cinar İ., 2004. Impact assesment of bioclimatic comfort criteria in landscape planning process: The case of Karabaglar plain in Mugla–Turkey. PhD Thesis, Graduate School of Natural and Applied Sciences Landscape Architecture Dept. Aegean Univ.Izmir Turkey. 226 pp. [ Links ]
Cotton W. R. and R. A. Pielke, 1995. Human Impacts on Weather and Climate. Cambridge University Press, Cambridge. [ Links ]
Eliasson I. 1996. Intra–urban nocturnal temperature differences: a multivariate approach. Clim. Res. 7, 21–30. [ Links ]
Eliasson I. and M. K. Svensson, 2003. Spatial air temperature variations and urban land use – a statistical approach. Meteorol. Appl. 10, 135–149 Cambridge University Press. [ Links ]
Emmanuel R., 2005. Thermal comfort implications of urbanization in a warm–humid city: the Colombo Metropolitan Region (CMR), Sri Lanka. Build. Environ. 40, 1591–1601. [ Links ]
Epstein Y. and D. S. Moran, 2006. Thermal comfort and the heat stress indices. Industrial Health 44, 388–398. [ Links ]
Fanger P. O., 1970. Thermal comfort. Copenhagen, Danish Technical Press, 244 pp. [ Links ]
Fanger P. O, J. Hojbjerre and J. O. B. Thomsen, 1974. Thermal comfort conditions in the morning and in the evening. Int. J. Biometeor. 18, 16–22. [ Links ]
Figuerola P. I. and N. A. Mazzeo, 1998. Urban–rural temperature differences in Buenos Aires. Int. J. Climatol. 18, 1709–1723. [ Links ]
Givoni B. 1963. Man climate and architecture. Amsterdam: Elsevier Press, 247 pp. [ Links ]
Gulyas Á., J. Unger, B. Balazs and A. Matzarakis, 2003. Analysis of the bioclimatic conditions within different surface structures in a medium–sized city (Szeged, Hungary) Acta Climatologica ET Chorologica Universitatis Szegediensis, Tom. 36–37, 37–44. [ Links ]
Gulyas A., J. Unger and A. Matzarakis, 2006. Assessment of the microclimatic and human comfort conditions in a complex urban environment: Modelling and measurements. Build. Environ. 41, 1713–1722. [ Links ]
Gulyas A. and A. Matzarakis, 2007. Selected examples of bioclimatic analysis applying The Physiologically Equivalent Temperature In Hungary. Acta Climatologica Et Chorologica 40–41, 37–46. [ Links ]
Höppe P.R., 1993. Heat balance modelling. Experientia 49, 741–745. [ Links ]
Höppe P., 1999. The physiological equivalent temperature – a universal index for the biometeorological assessment of the thermal environment. Int. J. Biometeorol. 43, 71–75. [ Links ]
Hughes K. 2006. The impact of urban areas on climate in the UK: a spatial and temporal analysis, with an emphasis on temperature and precipitation effects Earth Environment 2, 54–83. [ Links ]
Jáuregui E. and A. Tejeda, 1997. Urban – rural humidity contrasts in Mexico City. Int. J. Climatol. 17, 187–196. [ Links ]
Jáuregui E. 2005. Possible impact of urbanization on the thermal climate of some large cities in México. Atmósfera 18, 249–252. [ Links ]
Jusuf S. K., N. H. Wong, E. Hagen, R. Anggoro and Y. Hong, 2007. The influence of land use on the urban heat island in Singapore. Habitat International 31, 232–242. [ Links ]
Karl T. R., H.F. Diaz and G. Kukla, 1988. Urbanization: its detection and effect in the United States climate record, J. Climate 1, 1099–1123. [ Links ]
Kongar E. 1976. A survey of familial change in two Turkish gecekondu areas, in J. G. Peristiany, ed., Mediterranean Family Structures, Cambridge University Press, 205–218. [ Links ]
Kottmeier C., C. Biegert and U. Corsmeier, 2007. Effects of urban land use on surface temperature in Berlin: Case Study. J. Urban Plng. and Devel. 133, 128–137. [ Links ]
Kyle WJ. 1994. The human bioclimate of Hong Kong. Proceedings of the contemporary climatology conference; 345–350. Brno, Szech Republic, 15–20 August. [ Links ]
Landsberg H. E. 1981. The Urban Climate. Academic Press, New York, 275 pp. [ Links ]
Lin T. P. and A. Matzarakis, 2008. Tourism climate and thermal comfort in Sun Moon Lake, Taiwan. Int. J. Biometeorol. 52, 281–290. [ Links ]
Liu W., H. You and J. Dou, 2009. Urban–rural humidity and temperature differences in the Beijing area. Theor. Appl. Climatol. 96, 201–207. [ Links ]
Matzarakis A., H. Mayer and M. G Iziomon, 1999. Applications of a universal thermal index: physiological equivalent temperature. Int. J. Biometeorol. 43, 76–84. [ Links ]
Matzarakis A., F. Rutz and H. Mayer, 2000. Estimation and calculation of the mean radiant temperature within urban structures. In: Biometeorology and urban climatology at the turn of the millenium (R. J. de Dear, J. D. Kalma, T. R. Oke and A. Auliciems Eds.). Selected Papers from the Conference ICB–ICUC'99, Sydney, WCASP–50, WMO/TD No. 1026, 273–278. [ Links ]
Matzarakis A. and F. Rutz, 2005. Application of RayMan for tourism and climate investigations. Annalen der Meteorologie 41, 631–636. [ Links ]
Matzarakis A., F. Rutz and H. Mayer, 2007. Modelling Radiation fluxes in simple and complex environments – Application of the RayMan model. Int. J. Biometeorol. 51, 323–334. [ Links ]
Mayer H. and P. Höppe, 1987. Thermal comfort of man in different urban environments. Theor. Appl. Climatol. 38, 43–49. [ Links ]
Mayer H. and A. Matzarakis, 1997: Human–biometeorological assessment of urban microclimates' thermal component. Proceedings of the Int. Symposium on Monitoring and Management of Urban Heat Island, Fujisawa–Japan, 155–168. [ Links ]
Mayer H., J. Holst, P. Dostal, F. Imbery and D. Schindler, 2008. Human thermal comfort in summer within an urban street canyon in Central Europe. Meteorologische Zeitschrift 17, 241–250. [ Links ]
McGregor G. R., M. T. Markou, A. Bartzokas and B. D. Katsoulis, 2002. An evaluation of the nature and timing of summer human thermal discomfort in Athens. Greece Clim. Res. 20, 83–94. [ Links ]
McPherson E. G., D. J. Nowak and A. R. Rowntree, 1994. Chicago's urban forest ecosystem: results of the Chicago Urban Forest Climate Project. Gen. Tech. Rep. NE–186. Radnor, PA: U.S. Department of Agriculture, Forest Service, Northeastern Forest Experiment Station: 201 p.Mills, G., 2007. Cities as agents of global change. Int. J. Climatol. 27, 1849–1857. [ Links ]
Ohashi Y., T. Kawabe, Y. Shigeta, Y. Hirano, H. Kusaka, H. Fudeyasu and K. Fukao, 2008. Evaluation of urban thermal environments in commercial and residential spaces in Okayama City, Japan, using the wet–bulb globe temperature index. Theoretical and Applied Climatology. DOI – 10.1007/s00704–008–0006–8. [ Links ]
Oke T. R., 1973. City size and the urban heat island. Atmos. Environ. 7, 769–779. [ Links ]
Oke T. R., 1987. Boundary Layer Climates. 2nd Edition, Routledge, London. [ Links ]
Oke T. R., G. Johnson, D. Steyn and I. Watson, 1991. Simulation of surface urban heat islands under "ideal" conditions at night, Part 2: Diagnosis of causation Bound.–Layer Meteor. 56, 339–358. [ Links ]
Park H. S. 1986. Features of the heat island in Seoul and its surrounding cities. Atmos. Environ. 20, 1859–1866. [ Links ]
Rizwan A. M., L. Y. C. Dennis and C. Liu, 2008. A review on the generation, determination, and mitigation of urban heat island. J. Environ. Sci. 20, 120–128. [ Links ]
Robaa S. M., 2003. Urban–suburban/rural differences over Greater Cairo, Egypt. Atmósfera 16, 157–171. [ Links ]
Roth M., T. R. Oke and W. J. Emery, 1989. Satellite–derived urban heat islands from Three Coastal Cities and the Utilization of such Data in Urban Climatology. Int. J. Remote Sensing 10, 1699–1720. [ Links ]
Saffell E. M. and A. W. Ellis, 2002. Urban – rural humidity variations in Phoenix, Arizona. Journal of the Arizona–Nevada Academy of Science 34, 53–62. [ Links ]
Sakakibara Y. and K. Owa, 2005. Urban–rural temperature differences in coastal cities: influence of rural sites. Int. J. Climatol. 25, 811. [ Links ]
Sakakibara Y., Y. Kitahara and Kiyotaka Nakagawa, 2006. The relationship between urban–rural water vapor pressure differences and the population sizes of settlements in Saku, Nagano, Japan. J. Agricultural Meteorology 62, 1–8. [ Links ]
Spagnolo J. and R. J. de Dear, 2003. A field study of thermal comfort in outdoor and semi–outdoor environments in subtropical, Sydney Australia. Build. Environ. 38, 721–738. [ Links ]
Stone, B., 2007. Urban and rural temperature trends in proximity to large US cities: 1951–2000. Int. J. Climatol. 27, 1801–1807. [ Links ]
Streiling S. and A. Matzarakis, 2003. Influence of single and small clusters of trees on the bioclimate of a city: a case study. J. Arboriculture 29, 309–316. [ Links ]
Taha H. 1999. Modifying a mesoscale meteorological model to better incorporate urban heat storage: bulk parameterization approach J. Appl. Meteor. 38, 466–473. [ Links ]
Thom E. C., 1959. The discomfort index. Weatherwise 12, 57–60. [ Links ]
Thorsson S., T. Honjo, F. Lindberg, I. Eliasson and E. M. Lim, 2007. Thermal Comfort and Outdoor Activity in Japanese Urban Public Places. Environ. Behav. 39, 660–684. [ Links ]
Toy S., 2004. Determination of bioclimatic effect in the open green spaces of Erzurum. Ms Thesis, Graduate School of Natural and Applied Sciences Landscape Architecture Dept. Atatürk Univ.Erzurum Turkey. p 101. [ Links ]
Toy S., S. Yilmaz and H. Yilmaz, 2007. Determination of bioclimatic comfort in three different land uses in the city of Erzurum, Turkey. Build. Environ. 42, 1315–1318. [ Links ]
Toy S. and S. Yilmaz, 2010. Evaluation of 10–year temperature differences between urban and rural areas of a well–planned, unindustrialised and medium – size Turkish town, Erzincan. J. Urban Plng. and Devel (in Press). [ Links ]
Toy S. and S. Yilmaz, 2010a. Thermal sensation of people performing recreational activities in shadowy environment: a case study from Turkey. Theor. Appl. Climatol. 101, 329–343. [ Links ]
Türkes M., U. M. Sümer and I. Demir, 2002. Re–evaluation of trends and changes in mean, maximum and minimum temperatures of Turkey for the period 1929–1999. Int. J. Climatol. 22, 947–977. [ Links ]
Türkes M. and U. M. Sümer, 2004. Spatial and temporal patterns of trends and variability in diurnal temperature ranges of Turkey. Theor. Appl. Climatol. 77, 195–227. [ Links ]
Unger J., 1999. Urban – rural air humidity differences in Szeged, Hungary. Int. J. Climatol. 19, 1509–1515. [ Links ]
Unkasevic M., O. Jovanovic and T. Popovic, 2001. Urban–suburban/rural vapour pressure and relative humidity differences at fixed hours over the area of Belgrade city. Theor. Appl. Climatol. 68, 67–73. [ Links ]
VDI, 1998. VDI 3787, Part I: Environmental meteorology, methods for the human biometeorological evaluation of climate and air quality for the urban and regional planning at regional level. Part I: Climate. Beuth, Berlin, 29 pp. [ Links ]
Wong N. H. and C. Yu, 2005. Study of green areas and urban heat island in a tropical city. Habitat Int. 29, 547–558. [ Links ]
Yilmaz S., S. Toy, M. A. Irmak and H. Yilmaz, 2007a. Determination of climatic differences in three different land uses of the city of Erzurum, Turkey. Build. Environ. 42, 1604–1612. [ Links ]
Yilmaz S., S. Toy and H. Yilmaz, 2007b. Human thermal comfort over three different land surfaces during summer in the city of Erzurum, Turkey. Atmósfera 20, 289–297. [ Links ]
Zhou L., R. E. Dickinson, Y. Tian, J. Fang, Q. Li, R. K. Kaufmann, C. J. Tucker, and R. B. Myneni, 2004. Evidence for a Significant Urbanization Effect on Climate in China P. Nat. Acad, Sci. USA. 101, 9540–9544. [ Links ]

