


Services on Demand
Journal
Article
 English (pdf)
 Article in xml format
 Article references
 Send this article by e-mail
Indicators
-
 Cited by SciELO
 -
 Access statistics
Related links
-
 Similars in
SciELO
Similars in
SciELO
Share

 Permalink
Atmósfera
Print version ISSN 0187-6236
Atmósfera vol.23 n.4 Ciudad de México Oct. 2010
Synoptic patterns that contribute to extremely hot days in Europe
M. CONY, L. MARTÍN
IrSOLaV Investigaciones y Recursos Solares Avanzados S.L.,
Tres Cantos, Madrid, España. Corresponding author: M. Cony; e–mail: macony@fis.ucm.es
E. HERNÁNDEZ and T. DEL TESO
Departamento de Física de la Tierra II; Facultad de Ciencias Físicas; Universidad Complutense de Madrid, España.
Received October 30, 2009; Accepted January 14, 2010
RESUMEN
El presente trabajo describe un análisis de tendencia que se ha realizado en la frecuencia anual de días de calor extremo (DCE) en Europa así como la identificación de aquellas situaciones sinópticas que contribuyen a la generación de días de temperatura máxima extrema. Para ello, se han utilizado un conjunto de series de temperaturas máximas diarias y la clasificación de Hess–Brezowsky (HB). El periodo seleccionado para el estudio ha sido desde el 1 de enero de 1955 hasta el 31 de diciembre de 1998, durante el cual se ha obtenido el mayor numero de series completas de temperatura. Un DCE ha sido definido como aquel en el que la temperatura máxima supera el umbral del 95% de la distribución de las temperaturas máximas diarias. La conexión entre un DCE con la circulación general de la atmósfera se basa en un coeficiente estadístico que dependiendo de su valor, asignase un tipo u otro de patrón sinóptico que produzcan temperaturas máximas extremas. Para obtener la clasificación de los patrones sinópticos más relevantes, se ha aplicado un análisis de componentes principales rotadas (RPC). Los resultados obtenidos muestran un incremento en la frecuencia anual de un DCE y al mismo tiempo, tendencias positivas significativas en la frecuencia de las situaciones sinópticas asociadas con los DCE para toda la zona de Europa occidental.
ABSTRACT
This paper describes a trend analysis which has been performed in the annual frequency of extremely hot days (EHD) in Europe and the identification of synoptic patterns that contribute to the generation of extreme high temperature events. In order to do this, we have used a set of daily temperature series from European Climate Assessment (ECA) and Dataset Project and subjective Hess–Brezowsky (HB) catalogue of weather types (Grosswetterlagen). The period selected for the study was from January 1, 1955 until December 31, 1998, during which it has been obtained the highest number of complete series of temperature. An EHD has been defined as one in which the maximum temperature exceeds the threshold of 95% of the distribution of daily maximum temperatures. The connection between an EHD and general circulation of the atmosphere is based on a statistical index that depending on its value, allocate one type of synoptic pattern producing maximum extreme temperature. To obtain the classification of the most important synoptic patterns, a rotated principal component analysis (RPC) has been applied. The results show an increase in the annual frequency of EHD and at the same time, significant positive trends in the frequency of synoptic situations associated with EHD for the whole Western European region.
Keywords: Extremely hot days, GWL patterns, EHD over Europe, trends EHD, HB classifications.
1. Introduction
Between all climatic variability, extreme temperatures awake particular attention due to its straight relation with climate change (Anderson et al., 2005). Maximum temperatures affect and generate serious consequences in transport, agriculture, energy and water supply although its effects are more important on human health.
During the 20th century, there has been an increase in the temperature of the planet in approximately 0.6°C (Nicholls et al., 1996). This increase is associated with minimum and maximum temperature raise (Karl et al., 1991; Karl et al., 1993), although there are significant differences depending on the region of the planet that is considered, bearing in mind that these increases do not occur uniformly but they are concentrated around a region (Easterling et al., 1997). Studies by Jones et al. (1999) and Karl et al. (2000) have shown significant periods of warming since the end of the 19th century to the present.
In Europe, it has been confirmed that most of the increases in temperature are consistent with periods of global increases (Klein–Tank et al., 2002). Domonkos et al. (2003) analyzed the events of extreme temperatures in 11 European cities and they have obtained similar results for increases in temperature. Raise of annual temperatures are causing a change on the range of variability in areas where these increases have been registered (Prieto, 2003). Therefore, what previously was viewed as extreme temperatures now is becoming part of common values of temperature, leading to changes in the environment and significant increases in the frequency of values that were considered before as extreme temperatures. There have been several works on extreme temperatures; some of them focus on the specifics of the maximum and minimum temperatures as for example analyzing the potential impacts of increases in greenhouse gases in the atmosphere caused by human activity. The works focusing on the analysis of extreme temperatures, are associated generally with the impact on society or ecosystems (Heino et al., 1999; Díaz et al., 2002; García–Herrera et al., 2005).
The projects carried out by Klein–Tank et al. (European Climate Assessment, 2002) or Goodess et al. (STARDEX, 2005) have shown significant increases in average temperature in Europe. European regions more affected in relation to increases in maximum temperatures are the Iberian Peninsula, Central Europe, the eastern coast of Adriatic and southern Greece (Beniston et al., 2007; Cony et al., 2007; Kjellström et al., 2007; Cony et al., 2008).
The aim of this paper is to present a classification of atmospheric circulation patterns that contribute to generate extremely hot days and present the trends that have been detected in the annual frequency of these extreme days. This way, we have based our study on the synoptic classification of Hess–Brezowsky and used a set of daily maximum temperature series for different stations distributed all over Europe. The period chosen for this study has been from January 1, 1955 until December 31, 1998. In this period it has been obtained the largest number of stations with complete data.
In the next section we devise the main aspects of the data selected, later in Section 3 we present the methodology applied. The results of this analysis are shown in section 4. Finally, some conclusions are presented in Section 5.
2. Data
The series of maximum temperatures (TMAX) used are taken from European Climate Assessment (ECA) and Dataset Project (Klein–Tank et al., 2002) through its website. This set of temperature series, provides a wide spatial coverage with a high reliability. To select the time series, the same criteria developed by Eischeid et al. (1995, 2000) and used by Prieto (2003) has been applied. The method of Eisched considers some essential criteria when selecting a temperature series. The main are: 1) that the series of temperature present at least a temporary coverage long enough so that it is possible to analyze the trends, 2) present a sufficiently small number (5%) of lost data so that the error made when filling those time series do not have any influence on the characteristics of the station and 3) ensure that the variability in the time series is only due to climatic factors.
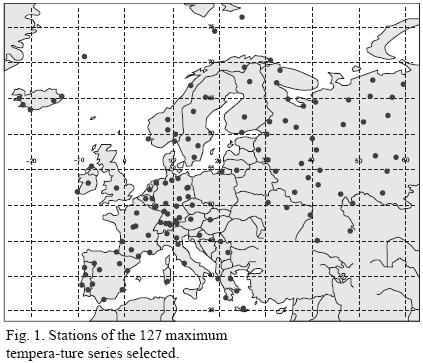
In order to verify the possible discontinuities that can be found in the temperature time series (Della–Marta et al., 2005), several techniques of homogenization have been applied to each time series. The techniques used are based on the same procedures used by Prieto (2003) and Easterling et al. (1995). Finally, based on those criteria, it has been selected 127 series of daily maximum temperatures distributed by 24 European countries (Fig. 1).
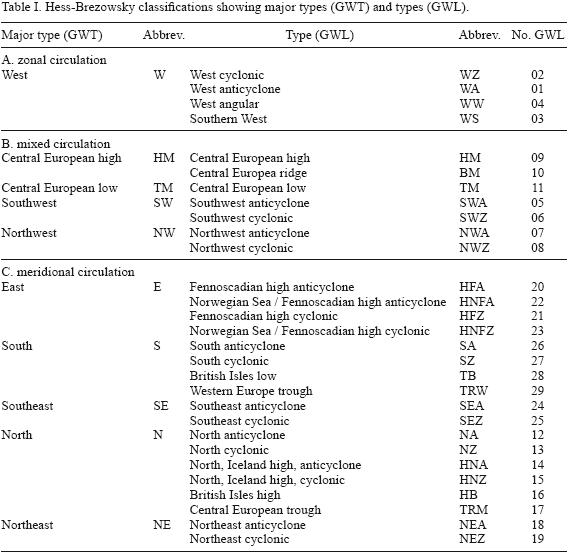
On the other hand, the weather classifications are based on the Hess–Brezowsky (HB) catalogue (Hess and Brezowsky, 1977; Gerstengarbe et al., 1993, 1999). The HB catalogue presents 30 different weather types, also known as Grosswetterlangen or GWL, defined from 3 groups' macro–circulation types: 1) zonal, 2) mixed and 3) meridional (Table I). The zonal circulation is characterized by flows of winds that move from west to east in zones of low pressure, that is, the wind moves from the east of Atlantic Ocean to north of continental Europe. The meridional circulation is characterized by winds less active which produces areas of blockage and barometric swamp situations. Finally, the mixed circulation is characterized by both types of winds before described. The classification of HB has been applied with the atmospheric pressure at surface level (SLP) and 500 hPa.
3. Methodology
3.1 Extremely hot days definitions
The most habitual way of defining an episode of extremely hot days is when the temperature overcomes a certain fixed threshold. Often, definitions of extreme temperatures impose, in addition to the excess over this threshold, additional conditions, such as the duration of days (Kyselý et al., 2005). There are authors who also define extreme temperatures depending on temperature levels which can have any influence on human health. In diverse cities of the Iberian Peninsula the existence of a 'temperature of shot' has been identified, whose overcoming, even in one day alone, has an increase in the associated mortality (Díaz et al., 2002, 2005). On the other hand, other authors define extreme temperature from a percentile which can be 99, 95 or 90 (DeGaetano, 1996).
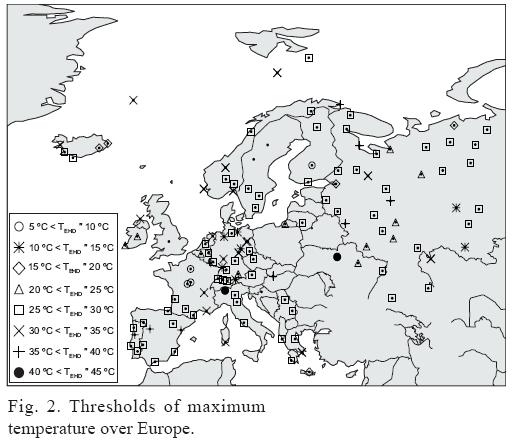
This work has chosen percentile 95 (P95) to define an extremely hot day (EHD). This percentage has been applied to the 127 series of maximum daily temperatures from June to September (JJAS) where a threshold temperature for each station has been obtained. Therefore, an EHD has been defined as the temperature which exceeds the maximum threshold of 95% of the distribution of daily maximum temperatures. Figure 2 shows the distribution of temperature thresholds for selected stations.
3.2 EHD trends methods
The technique which has been used commonly to calculate a trend in meteorological variables is linear regression, however, this technique cannot be applied when we are working with frequencies of extremes because the deviations in the measures are normally distributed around the regression line and the values at the extremes of the series are more important.
In order to calculate the trends, in this paper, the techniques applied are based in the same method as Karl et al. (1987b; 2000) and recently applied in other similar studies (Cony et al., 2007; Cony et al., 2008). Karl technique is summarized in two processes: 1) creating a series of first–order differences and 2) calculating the significance (p) of the trend, making an estimate by the statistical t Student and a Monte Carlo test with 5000 simulation. Because the temperatures are distributed as a Gaussian, the variations of the extremes must mainly change in the average or standard deviation (Mearns et al., 1984). This relationship is highly nonlinear; small changes in temperature produce large increases in the probability of occurrence of extremes. Furthermore, the standard deviation also has a high influence; small changes produce large changes in extremes of the tails of the distribution (Colombo et al., 1999). Taking this into account, analysis of the trends has been divided in these two factors to evaluate the nature of increase of EHD in this period.
3.3 Connection between GWL patterns and EHD
The connection between the classifications HB (or GWL) for each day in extreme maximum temperatures has been given by the determination of a statistic index. Defined as a coefficient of efficiency (e) and which is based on the frequencies of each GWL pattern and the occurrence of extreme temperature days for a given station, its value is assigned to a synoptic pattern type. For each station, GWL patterns with EHD have been verified. Besides, the frequency of the synoptic pattern throughout all the period of the study has been counted.
The absolute frequencies of the GWL patterns obtained, in a period of EHD (FAEHD) and for all (FA), were obtained with relative frequencies (FREHD and FR ) respectively, taking into account the number of EHD events (NEHD) and the total number of days for the months June to September for 44 years of analysis. Hence, efficiency index (e) is calculated from (Eq.1):
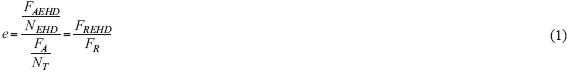
The effectiveness of a synoptic pattern has been based on the value–relation obtained in an EHD, i.e. the value–relation of each synoptic pattern indicates the degree of influence in a given station, in turn, related to an EHD event: a higher value indicates a greater relationship with the EHD.
To regroup the synoptic patterns with higher ratios, a rotated principal component analysis (RPC) has been applied (White et al., 1991). This kind of multivariate statistical analysis is part of a time series of a given variable distributed spatially and localizes the most significant patterns in this region. To obtain the most representative synoptic models, it is necessary to reconstruct the time series of auto–value of every empirical orthogonal function (EOF) (Ribera, 1999). The analysis of RPC works in two stages: 1) obtaining the coefficients of auto–value of the variance–covariance matrix and 2) verifing the spatial distribution of these factors. For them, a rotation matrix of principal component is applied to have a more precise location of each component. In the literature there are a large number of methods of rotation, in this study, we use the Varimax method. In addition, the number of rotating components has been chosen using the criterion of Kaiser (1958) where only components with an auto–value greater than unity are taken.
4. Results
As mentioned in the previous section, we applied the Karl method in the yearly frequencies of the time series of EHD where positive and statistically significant trends were detected in 39.4% of the stations. Western Europe has been the area that presented the greater number of stations with significant trends (p<0.10), especially in central and southern parts (Fig. 3).
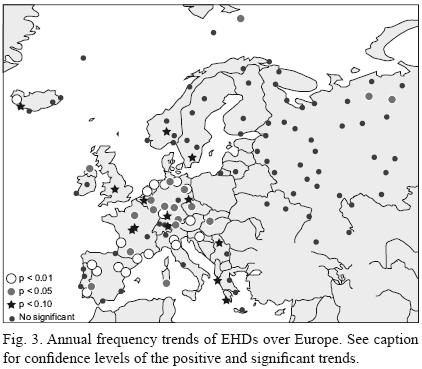
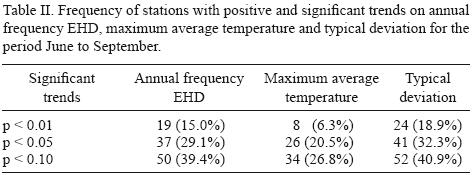
Figure 4 shows the stations where significant trends in the average maximum temperature and the typical deviation have been detected for the months from June to September. In both, the mean maximum temperature and the standard deviation, positive trends have been detected in 26.8 and 40.9% of the stations, respectively. These values are related with the results obtained in European seasonal and annual temperature variability and extremes by Luterbacher et al. (2004). Table II shows a summary of the results of the analysis of trends in stations where we detected significant trends.
Possible causes of increases of EHD may be due to many factors, both local and global (Prieto et al., 2002, 2003). These factors may be heat islands that can occur within the urban centers (Karl et al., 1987b), the change of stations or instruments or measures, as well changes of the general circulation of atmosphere. The factor heat island has no influence on stations, found in rural or urban centers with a population less than 10 000 inhabitants (Karl et al., 1987b). In the case of change of stations or of instruments, homogenization techniques should be applied as mentioned above. The changes in the general circulation of the atmosphere are one of the factors most likely to increase EHD.
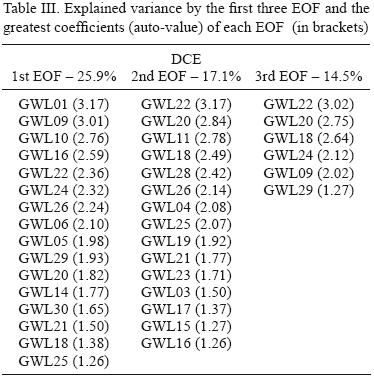
As mentioned above, applying the analysis of principal components (PCA) made possible to obtain a classification of those GWL patterns most influential in generating EHD. From the first three empirical orthogonal function (EOF) (57.5% of the total cumulative variance) and by reconstructing the coefficients of eigenvalues, 22 different GWL types are selected. Table III presents the results obtained in the RPC analysis showing the highest rates of auto–value (in brackets). Figure 5 shows the European areas where each EOF has been more representative: North West Europe (1st EOF), Mediterranean (2nd EOF) and Central Eastern Europe (3rd EOF). During the selection of synoptic patterns, the highest rates of eigenvalue based on the same principles of Johnson et al. (1992) and Mardia et al. (1982) has been considered. These authors argue that the elements associated with each eigenvalue have more weight in an EOF than those which are higher than the average of these coefficients.
Moreover, a trend analysis of annual frequency of synoptic patterns has been made and of the 22 synoptic situations mentioned above, 17 were found to have significant positive trends, reasons that justify the increase in the annual frequency of extremely hot days
5. Discussions and conclusions
Throughout all Western Europe there has been an increase in the annual frequency of extremely hot days in the period 1955–98. As a result, there have been substantial increases in the events of EHD. It has been detected that 39.4% of the stations, has statistically significant (p <0.10) positive trends in the annual frequency of EHD.
Based on Hess–Brezowsky catalogue, we have identified the synoptic patterns that have a direct influence on the generation of EHD. The key to this identification has been the determination of an efficiency index of each synoptic pattern. According to its value a different synoptic pattern is assigned to the related EHD. To regroup GWL patterns, we have applied a rotated principal component analysis, identifying 22 types of major influence in the generation of EHD: GWL03, GWL04, GWL05, GWL06, GWL09, GWL10, GWL11, GWL14, GWL15, GWL16, GWL17, GWL18, GWL19, GWL20, GWL21, GWL22, GWL23, GWL24, GWL25, GWL26, GWL28 and GWL29. Of these patterns, 77.3% showed significant positive trends at p<0.10.Therefore, as a conclusion of this work, the following points confirm the increase of extremely hot days: 1) significant positive trends in the annual frequency of EHD has been found, 2) positive trends were detected in the average maximum temperature and the standard deviation and 3) synoptic patterns associated to the days of extreme temperatures have significant trends in its annual frequency.
References
Anderson J. and C. Bausch, 2005. Climate Change and Natural Disasters: Scientific evidence of a possible relation between recent natural disasters and climate change. European Parliaments' Environmental, Public Health and Food Safety Committee. Brief 02a/2006. [ Links ]
Beniston M., D. B. Stephenson, O. B. Christensen, C. A. T. Ferro, C. Frei, S. Goyette, K. Halsnaes, T. Holt, K. Jylhä, B. Koffi, J. Palutikof, R. Schöll, T. Semmler and K. Woth, 2007. Current and future extreme climatic events in Europe: observations and modeling studies conducted within the EU Prudence project. Climatology Change 81, 71–95. [ Links ]
Colombo A. F., D. Etkin and B. W. Karney, 1999. Climate Variability and the Frequency of Extremes Temperature Events for Nine Sites across Canada: Implications for Power usage. J. Climate 12, 2490–2502. [ Links ]
Cony M., E. Hernández and T. del Teso, 2007. EMS Annual Meeting: Influence of synoptic scale in the generation of extremely hot days and extremely cold days in Europe. San Lorenzo de El Escorial EMS7/ECAM8 Abstracts vol. 4, EMS2007–A–00071– España. [ Links ]
Cony M., E. Hernández and T. del Teso, 2007. XXXI Reunión Bienal de la Sociedad Española de Física: Extremos de temperatura máxima y mínima y la relación con la escala sinóptica en Europa. Real Sociedad de Física Granada, España. [ Links ]
Cony M., E. Hernández, T. del Teso and L. Prieto, 2007. EGU General Assembly: Influence of synoptic scale in the generation of extremely hot days and extremely cold days in Europe. Geophysical Research Abstract vol. 9, 00202. [ Links ]
Cony M., E. Hernández and T. del Teso, 2008. Influence of synoptic scale in the generation of extremely cold days in Europe. Atmósfera 21, 389–401. [ Links ]
DeGaetano A. T., 1996. Recent trends in minimum and maximum temperature threshold exceedences in the North–Eastern United States. J. Climate, 9, 1646–1660. [ Links ]
Della–Marta, P. M. and H. Wanner, 2005. A method of homogenizing the extremes and mean of daily temperature measurements. J. Climate 19, 4179–4197. [ Links ]
Díaz J., R. García–Herrera, F. Velásquez, C. López, E. Hernández and A. Otero, 2002. Effects of extremely hot days on people older than 65 in Seville [Spain]: from 1986 to 1997. Int.J. Biometeorol. 46, 145–149. [ Links ]
Díaz J., R. García–Herrera and C. López, 2005. Mortality impact of extreme winter temperatures. Int. J. Biometeorol. 49, 179–183. [ Links ]
Domonkos P., J. Kysely, K. Piotrowicz, P. Petrovic T. and Likso, 2003. Variability of extreme temperature events in South–Central Europe during the 20th century and its relationship with large–scale circulation. Int. J Climatol. 23, 987–1010. [ Links ]
Easterling D. R. and T. C. Peterson, 1995. A new method for detecting undocumented discontinuities in Climatological time series. Int. J. Climatol. 15, 369–377. [ Links ]
Easterling D. R., B. Horton, P. D. Jones, T. C. Peterson, T. R. Karl, D. E. Parker, M. J. Salinger, V. Razuvayev, N. Plummer, P. Jamason and C. K. Folland, 1997. Maximum and minimum temperature trends for globe. Sciences 277, 364–366. [ Links ]
Eisched J. K., C. B. Baker, T. R. Karl and H. F. Diaz, 1995. The quality control of long–term climatological data using objective data analysis. J. Appl. Meteorol. 34, 2787–2795. [ Links ]
Eisched J. K., P.A. Pasteris, H. F. Diaz, M. S. Plantico and N. J. Lott, 2000. Creating a Serially Complete, National Daily Time Series of Temperature and Precipitation for the Western United States. J. Appl. Meteorol. 39, 1580–1591. [ Links ]
García–Herrera R., J. Díaz, R. M. Trigo and E. Hernández, 2005. Extreme summer temperatures in Iberia: health impacts and associated synoptic conditional. Ann. Geoph. 23, 239–251. [ Links ]
Gerstengarbe F. W. and P. C. Werner, 1993. Katalog der Grosswetterlagen Europas nach Paul Hess und Helmuth Brezowsky 1881–1992. Deustcher Wetterdienst Offenbach am Main, 249 pp. [ Links ]
Gerstengarbe F. W., P. C. Werner and U. Rüge, 1999. Katalog der Grosswetterlagen Europas nach Paul Hess und Helmuth Brezowsky 1881–1992. Deustcher Wetterdienst Offenbach am Main, 249 pp (Rewiew). [ Links ]
Goodess C. M., J. H. Christensen, M. R. Haylock, R. Wilby, J. Ribalaygua, E. Schuepbach, G. Plaut, C. Cacciamani, T. Schmith, H. Caspary, A. Bárdossy and P. Maheras, 2005. An intercomparison of statistical downscaling methods for Europe and European regions – assessing their performance with respect to extreme temperature and precipitation events. Climate Change submitted. [ Links ]
Goodess C., R. Wilby, J. Ribalaygua, J., E. Schuepbach, G. Plaut, C. Cacciamani, T. Schmith, H. Caspary, A. Bárdossy and P. Maheras, 2005. STARDEX Project, Downscaling climate extremes. Climatic Research Unit, Scholl of Environmental Sciences. University of East Anglia. United Kingdom. Contract no: EVK2–CT–2001–00115. [ Links ]
Heino R., R. Brazdil, E. Forland, H. Toumenvirta, H. Alexanderson, M. Benisto, C. Pfister, M. Rebetez, G. Rosenhagen, S. Rosner and J. Wibig, 1999. Progress in the study of climate extremes in northern and central Europe. Climate Change 42, 151–181. [ Links ]
Hess P. and H. Brezowsky, 1977. Katalog der Grosswetterlagen Europas 1881–1976. Berichtes des Deustcher Wetterdienst, 113. Deutscher Wetterdienst Offenbach am Main. [ Links ]
Jones P. D., E. B. Horton, C. K. Folland, M. Hulme, D. E. Parker and T. A. Basnett, 1999. The use of indices to identify changes in climatic extremes. Climatic Change 42, 131–149. [ Links ]
Johnson R. and D. Wicherd, 1992. Applied multivariante statistical analysis. Nueva Jersey. Ed. Prentice Hall 640. [ Links ]
Karl T. R., G. Kukla and J. Gavin, 1987b. Recent temperature change during overcast and clear skies in the United States. J. Clim. Appl. Meteorol. 26, 698–712. [ Links ]
Karl T. R., G. Kukla, V. N. Razuvayev, M. J. Changery, R. G. Quayle, R. R. Heim and D. R. Easterling, 1991. Global warming: Evidence for asymmetric diurnal temperature change. Geophysical Research Letters 18, 2253–2256. [ Links ]
Karl T. R., P. D. Jones, R. W. Knigth, G. Kikla, N. Plummer, V. N. Razuvaev, K. P. Gallo, J. Lindseay, R. J. Charlson and T. C. Peterson, 1993. Asymmetric trends of daily maximum and minimum temperature. Bull. Am. Meteorol. Soc. 74, 1007–1023. [ Links ]
Karl T. R., R. W. Knight and B. Baker, 2000. The record breaking global temperature of 1997 and 1998: Evidence for an increase in the rate of global warming? Geophysical Research Letter 27, 719–722. [ Links ]
Kaiser H. F., 1958. The varimax criterion for rotation in factor analysis. Psychometrika 23, 187–200. [ Links ]
Kjellström E., L. Bärring, D. Jacob, R. Jones, G. Lenderink and C. Schär, 2007. Modeling daily temperature extremes: recent climate and future changes over Europe. Climatol. Change 81, 249–265. [ Links ]
Klein Tank A. M. and A. Stuart 2002. Daily dataset of 20th Century surface air temperature and precipitation series for the European Climate Assessment. Int. j. Climatol. 22, 1441–1453. [ Links ]
Kyselý J. and M. Dubrovsky, 2005. Simulation of extreme temperature events by a stochastic weather generator: effects of interdiurnal and interannual variability reproduction. Int. J. Climatol. 25, 251–269. [ Links ]
Luterbacher J., D. Dietrich, E. Xoplaki, M. Grosjean and H. Wanner, 2004. European seasonal and annual temperature variability, trends, and extremes since 1500, Science 303, 5663, pp. 1499–1503. [ Links ]
Mardia K. V., J. T. Kent and J. M. Bybby, 1982. Multivariante analysis. Londres, Ed. Academic Press 521 pp. [ Links ]
Mearns L. O., R. W. Katz and S. H. Schneider, 1984. Extreme Higt–Temperature Events: Changes in the Probabilities with Changes in Mean Temperature. J. Clim. Appl. Meteorol. 23, 1601–1613. [ Links ]
Nicholls N., B. Lavery, C. Frederiksen, W. Drosdowsky and S. Torok, 1996. Recent apparent changes in relationships between the El Niño–southern oscillation and Australian rainfall and temperature. Geophysical Research Letters 23, 3357–3360. [ Links ]
Prieto L., R. García, J. Díaz, E. Hernández and T. del Teso, 2002. NAO influence on extreme winter temperatures in Madrid. Annales Geophysicae 20, 2077–2085. [ Links ]
Prieto L., R. García–Herrera, J. Díaz, E. Hernández and T. del Teso, 2003. Minimum extreme temperatures over Peninsular Spain. Global and Planetary Change 44, 59–71. [ Links ]
Ribera P., 1999. Patrones de variabilidad climática en el Mediterráneo. Universidad Complutense Madrid 173p. [ Links ]
White D., M. Richman and B. Tarnal, 1991. Climate Rationalization and Rotation of Principal Component Analysis. Int. J. Climatol. 11, 1–25. [ Links ]

