


Servicios Personalizados
Revista
Articulo
 Inglés (pdf)
 Artículo en XML
 Referencias del artículo
 Enviar artículo por email
Indicadores
-
 Citado por SciELO
 -
 Accesos
Links relacionados
-
 Similares en
SciELO
Similares en
SciELO
Compartir

 Permalink
Atmósfera
versión impresa ISSN 0187-6236
Atmósfera vol.23 no.2 Ciudad de México abr. 2010
Cirrus clouds physical and spatiotemporal features in the Wider Caribbean
B. BARJA and J. C. ANTUÑA
Centro Meteorológico de Camagüey, Instituto de Meteorología, Carretera a Nuevitas km 7 ½, Apartado Postal 134, Camagüey 70100, Cuba. Corresponding author: B. Barja; e–mail: bbarja@cmw.insmet.cu
Received March 8, 2008; Accepted March 8, 2010
RESUMEN
El estudio de las propiedades físicas de las nubes cirros y su distribución espacio temporal es de notable interés y actualidad en la comunidad científica. Este interés parte de que se reconocen sus efectos sobre el balance de la radiación en el sistema superficie–atmósfera y por ende sobre el clima global. Se considera también que están relacionadas con la cantidad de vapor de agua existente en la troposfera alta y estratosfera baja. La insuficiente información y mediciones sobre nubes cirros en nuestra región del gran Caribe, y la necesidad de contar con resultados sobre estas nubes en la misma motivan la existencia de este trabajo. En este artículo se analiza la ocurrencia de nubes cirros ópticamente delgadas, así como sus espesores geométrico y óptico, a partir de los perfiles de coeficiente de extinción obtenido con el instrumento SAGE II (Stratospheric Aerosol Gas Experiment II) a bordo del satelite ERBS (Earth Radiation Budget Satellite). La discriminación entre presencia de nubes cirros y aerosoles se realiza mediante la relación entre las extinciones en dos longitudes de onda, 0.525 y 1.02 μm (Kent y McCormick, 1991), que manifiesta diferente respuesta en la interacción de la radiación solar a ambas longitudes de onda en presencia de partículas de cristales de hielo y de aerosoles. Los datos utilizados comprenden el período desde octubre de 1984 hasta agosto de 2005, con una extensión de 21 años, de la versión 6.2 de la base de datos del SAGE II. Se obtiene un comportamiento estacional de la frecuencia de ocurrencia de las nubes cirros por altura. Los máximos de ocurrencia corresponden a un 35.5 y un 17.2%, a las alturas de 14.5 y 12.0 km, para los periodos lluviosos (abril a octubre) y poco lluviosos (mayo a noviembre), respectivamente. El 9% de las nubes cirros se encuentran por encima de la tropopausa, el 16 en la tropopausa y el 75%, por debajo de ésta. Las nubes aisladas presentan menor frecuencia, menores espesores geométrico y óptico que las pegadas a nubes opacas. Sin embargo estos valores son mayores que los de nubes semejantes en otras regiones. Las nubes aisladas muestran un espesor geométrico más frecuente entre los 0.5 y 2.5 km para alturas entre los 10 y 20 km, con un valor medio de 1.96 km. Por su parte el valor medio del espesor óptico es de 4.0 x 10⁻³ para la longitud de onda de 0.525 μm, con un 99 % de la muestra clasificada como subvisible por debajo del valor límite de 3.0 x 10⁻². Al realizar la comparación de los resultados, con otros publicados para la región tropical en general, fueron encontradas varias características específicas de la región del Gran Caribe.
ABSTRACT
Studies on cirrus clouds, their occurrence frequency and the physical characteristics are an actual research topic for the scientific community. Cirrus clouds influence on the radiation budget of the surface–atmosphere system and thus the climate. Moreover, cirrus clouds play a determinant role in the regulation of the water vapor quantity in the upper troposphere and lower stratosphere. The lack of information and studies about cirrus clouds distribution in the Wider Caribbean region is the motivation of the present work. In the present article the atmospheric extinction profiles from the SAGE II sensor onboard the Earth Radiation Budget Satellite (ERBS) have been used to analize the occurrence frequency and the optical and geometrical depth of the optically thin cirrus clouds over the Wider Caribbean region. The extinction ratio between the two wavelengths at 0.525 and 1.02 µm was used to separate the profiles containing only aerosols from thus containing a cloud/aerosols mixture (Kent and McCormick, 1991). This ratio shows a different behavior in the interaction between solar radiation crystal ice and aerosols at both wavelengths. The SAGE II dataset version 6.2 was used, extending 21 years, from October 1984 to August 2005. The results show a seasonal behavior in the cirrus clouds occurrence frequency; with a maximum of 35.5 and 17.2% in the rainy and little rainy periods, respectively. These peaks of cirrus clouds frequencies are located at 14.5 and 12.0 km of altitude. An occurrence of 9% was obtained above the tropopause level. About 75% of the clouds never reached the tropopause height, and 16% are in the tropopause. The isolated cirrus clouds have lesser frequency and optical and geometrical depth than the optically thin clouds attached to a lower opaque clouds. The more frequent geometrical depths of isolated clouds were in the 0.5 and 2.5 km range for the altitudes between 10 to 20 km, with a mean value of 1.96 km, with a mean optical depth of 4.0 x 10⁻³ at 0.525 µm. The 99% of the clouds were classified as subvisual cirrus, below the threshold value of 3.0 x 10⁻². A comparison of the present results with other studies for the whole tropical region was conducted, finding some particular features for the Wider Caribbean region.
Keywords: Optically thin clouds, clouds occurrence frequency, SAGE II.
1. Introduction
Cirrus clouds are one of the subjects with particular interest in the current research on climate change for several reasons. The first one is the effect of cirrus clouds on the radiation and energy budget in the surface–atmosphere system. Depending on their macro and microphysical characteristics, they could produce two opposite effects on the radiation. They reflect out the shortwave radiation coming from the sun, increasing the albedo (cooling effect), while on the other hand they trap the longwave radiation emitted by the earth's surface (greenhouse effect). Another important reason is the presence of cirrus and subvisual cirrus clouds in the proximity of tropopause, most frequently in the tropical and subtropical region of the planet. They have been indicated as responsible of the dehydration of the air entering into the upper troposphere and lower stratosphere region (UTLS). In addition the cirrus clouds may perturb chlorine chemistry and play an important role in ozone chemistry at midlatitudes, similar to the role played by polar stratospheric clouds at higher latitudes. Some observations show the decrease of the ozone concentration in presence of cirrus clouds at tropical and midlatitudes.
Statistical and climatological studies have investigated the characteristics of cirrus clouds in several regions of the planet and reports on global distribution of clouds, including tropical cirrus clouds, have been published. These studies use measurements from sensors at the ground, on aircrafts and onboard satellites. One particular case is the instrument Stratospheric Aerosol and Gas Experiment II (SAGE II), a radiometer on board the Earth Radiation Budget Satellite (ERBS). This instrument has been used for some cirrus clouds studies (Wang et al., 1998, 2001).
Several studies conducted the characterization of the cirrus clouds in the tropical region as a whole, but none pay attention to particular tropical sub–regions. The goal of this study is to conduct a cirrus clouds characterization based on SAGE II measurements for the Wider Caribbean. To reach this objective we analyze the occurrence frequency, the geometrical depth and optical depth of cirrus clouds over the zone of study.
2. Data and methodology
The SAGE II was operational from October 1984 to August 2005 onboard the ERBS. The instrument had seven channels nominally centered at 0.385, 0.448, 0.453, 0.525, 0.600, 0.940, and 1.02 mm. It employed the solar occultation technique to measure line–of–sight atmospheric transmission in each sunrise and sunset encountered by the satellite. The measurements in these channels were used to determine the vertical distribution of different atmospheric constituents. The orbital geometry of the satellite conducted the full scan of the earth in 4 or 6 weeks, for a latitudinal coverage between approximately 80° S and 80° N. The field of view was 0.5 km in the vertical and 2.5 km in horizontal at the limb tangent point. The assumption of the spherical symmetry of the earth in the inversion algorithm produces a length of measurements of about 200 km. Mauldin et al. (1985) and Russell and McCormick (1987) described the SAGE measurements characteristics. Chu and McCormick (1979) and Chu et al. (1989) explained the SAGE II data inversion algorithm.
The characteristics of the SAGE II cloud detection was discussed in detail by Wang et al. (1994). Clouds with extinction coefficients between 2 x 10⁻⁴ and 2 x 10⁻² km–1 could be measured by SAGE II instrument. The opaque cloud is the term to designate the clouds having extinction coefficient greater than the upper limit for measurements of the SAGE II. The presence of this type of clouds is responsible for the termination of the extinction profile, and reduces the possibility of making measurements in the lower troposphere (Wang et al., 1994). According to the cirrus cloud classification by Sassen and Cho (1992), the SAGE II measurable clouds cover almost entirely the range of subvisual cirrus clouds (Wang et al., 1996). Below the 6.5 km height the attenuation by clouds at 0.525 µm is very large and the signal reaching the SAGE II sensor is below its threshold.
We used the version 6.2 of the SAGE II dataset, covering the period October 1984 to August 2005. The SAGE II extinction profiles extent from surface to 40 km, divided in layers of 0.5 km. The measurements in the period having high volcanic aerosol loading from June 1991 to the end of 1993 (the Mount Pinatubo volcanic eruption in the Philippines took place on June 5, 1991) were excluded for this investigation. This volcanic eruption, the largest in the 20th century, loaded a great quantity of aerosols to the stratosphere and did not allow SAGE II to measure below 20 km altitude in the first months after the eruption. It was assumed that the aerosols clouds from the Mount Pinatubo stayed in the atmosphere for two and half years (Wang et al., 2001).
The Wider Caribbean was selected as the spatial coverage for the present study. This spatial selection guarantees a good enough number of measurements for a confident characterization of the area. The geographic limits for the Wider Caribbean region (Lat. 0–30° N; Lon. 50–105° W) were established following the definition provided by the article 2 of the Cartagena Convention (UNEP, 1983). Under the adopted spatial and temporal limits the dataset consisted of 2576 SAGE II profiles. They were distributed in 1285 for the little rainy period (November to March) and 1291 for the rainy period (April to October).
Because of the different aerosol size distributions and clouds hydrometeors their scattering of the solar radiation shows a different behavior. In particular, at the main wavelengths measured by SAGE II instrument (0.525 and 1.02 mm), the scattered radiation by clouds is almost the same at both wavelengths. In the case of aerosols, there is more scattered radiation at 0.525 than at 1.02 mm. This feature is the basis of the method for detecting the clouds in the vertical profiles of the extinction coefficients at the mentioned wavelengths (Kent and McCormick, 1991; Kent et al., 1993). The method consists in determining the ratio (ER) of the extinction coefficient at 0.525 µm to that at 1.02 µm.
For aerosols, in the stratosphere where exist a significant amount of submicrometric particles, the values of ER lies between 2 and 5. On the other hand, for clouds in the visible range, the values of ER are close to 1. The threshold extinction ratio of about 2 and extinction coefficient at the wavelength 1.02 µm in the range (5–8) x 10–4 km–1 must be used to safely distinguish between aerosols and aerosols/cloud mixtures. Wang et al. (1994) used the threshold value of 2.1 for ER. Kärcher and Solomon (1999) suggest that values of ER below 2 indicate a phase transition between aerosols and ice crystal particles. We used in the present work the value of 1.9 for ER in conjunction with the threshold value for the extinction coefficient at 1.02 µm of 5 x 10⁻⁴ km–1. These threshold values ensured that subvisible cirrus clouds were detected in SAGE II measurements (Kärcher and Solomon, 1999).
After the application of the method a total of 2474 profiles containing cirrus clouds were detected. The characteristic profiles of the occurrence frequency of subvisible cirrus clouds measured with SAGE II were obtained for the two seasons in the Wider Caribbean region. The profiles extend from 6.5 to 20 km, the first limit being set for the attenuation below 6.5 km by the clouds in the 0.525 µm channel.
The occurrence frequency of cirrus clouds measurable with SAGE II at a given height z, is defined after Wang et al. (1996) as


where  is the number of the measured subvisible cirrus clouds and N(z) the number of total samples in the layer with 0.5 km of thickness centered at the height z. Also after Wang et al. (1998) the subvisible cirrus clouds are separated in three categories: (A) isolated optically thin clouds, (B) optically thin clouds attached to a lower opaque cloud, and (C) optically thin clouds connected to the 6.5 km layer.
3. Discussion
In Figure 1 the profiles of the mean occurrence frequency and cloud extinction at 0.525 μm for the rainy and little rainy period are shown. Figure 1a shows the cirrus clouds occurrence frequency in the two seasons. We can see that the frequency is higher in the rainy season than in the little rainy season in Figure 1a at almost all altitudes. The occurrence frequency of the thin cirrus clouds measured with SAGE II has a seasonal behavior. The seasonal profiles present maximum frequency values of 17.2% in little rainy season and 35.5% in the rainy season. The heights of these frequency maxima are at 12.0 and 14.5 km, respectively. These results are in agreement with the altitudes associated with the principal generating mechanism of cirrus clouds in our region, the strong and deep convection in the months of the rainy season. Above the altitude of the maximum occurrence a minimum at altitude of 17.5 km is located. The magnitude of that minimum in the occurrence frequency is 12% in both seasons, above the mean tropopause altitude. The mean tropopause altitude calculated from the values contained in the SAGE II dataset is close to 16.6 km for both seasons. The tropopause height values are from the daily values containing the version 6.2 of SAGE II dataset, provided by the reanalysis (Kistler et al., 2001). This behavior reported in our case agrees with the climatology reported by Wang et al. (1996).
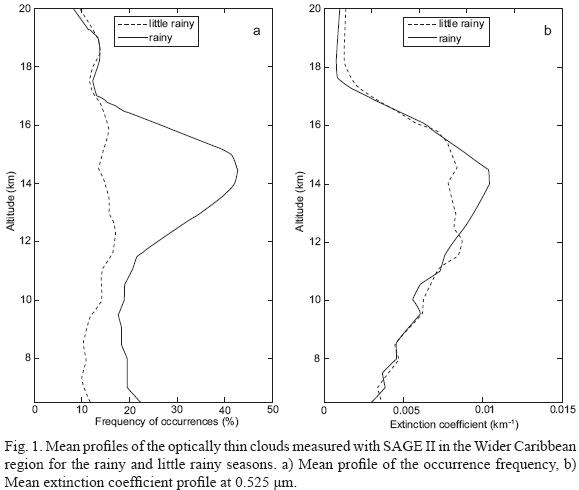
There are slight increases in the occurrence frequency above the mean tropopause height in both seasons with respect to the minimum value of occurrence at the tropopause. Kärcher and Solomon (1999) emphasized the continuum character of the cirrus/aerosols mixture systems in the neighborhood of the tropopause. There are various types of particles in the tropopause region, especially at high relative humidity conditions. Note in the little rainy season the occurrence frequency is 17.2%, when the convective activity is reduced significantly. These results suggest that there are other mechanisms of production of cirrus clouds at these altitudes. Possibly those mechanisms are the advection of humidity, or the ice crystal particles from the convective zone associated to the inter–tropical convergence zone, or the in situ heterogeneous nucleation of ice crystal.
Barja (2006) found a specific seasonal behavior of the cirrus clouds occurrence using cirrus clouds visual observations for the Camagüey region (20.5–22 °N latitude, 77–78.5 °W longitude). It was found the maximum occurrence frequency of 64% in September and the minimum of 17% in February. Although the datasets used in the cited paper and in the present are different in their origin, they serve to characterize the cirrus cloud frequency of occurrence. There is an agreement between the results on the cirrus clouds seasonal behavior from both datasets.
Moreover, Figure 1b illustrates the mean profiles of the extinction coefficient at 0.525 µm for both, rainy and little rainy seasons. The extinction coefficient has higher values in rainy season at the altitudes near of the height of the maximum occurrence frequency. Also, in the little rainy season the higher values of extinction coefficient are in the regions of maximum occurrence, but with lesser values than in the rainy seasons. Above the tropopause height, the extinction values are higher in the little rainy season, but there is a little difference. This aspect indicates that cirrus clouds microphysical characteristics are different in both seasons. The behavior of the mean extinction coefficient profiles at 1.02 µm (not shown) is similar to the one from the extinction coefficient at 0.525 µm.
It is interesting to investigate the position of the individual thin cirrus clouds in relation with the tropopause altitude. Table I shows the occurrence frequency of the thin cirrus clouds in relation with the tropopause altitude, in both seasons, rainy and little rainy. Cirrus clouds in the tropopause are the cirrus with the tropopause height between the cirrus top and bottom heights. The rest of the cirrus clouds are present completely above or below the tropopause height. Cirrus clouds above the tropopause are 9% frequent, in the total period and seasons, 16% in the tropopause category, and 75% never reach the tropopause height. Similar behavior is shown for both seasons, the frequency decrease with the altitude. In the rainy season the frequency values are 73 and 18% for cirrus below the tropopause and the cirrus in the tropopause, respectively. On the other hand, in the little rainy season there are frequency values of 78 and 13% for cirrus below the tropopause and the cirrus in the tropopause, respectively. The differences between the frequencies in both seasons are statistically significant at 95%. The frequency value of the cirrus clouds in the tropopause is higher in the rainy season. This aspect is in agreement with the activation of the principal formation mechanism of cirrus clouds in the rainy season. In this season more quantity of cirrus clouds are produced in the tropopause region. The cirrus clouds above the tropopause have 9% of frequency in the total period and both seasons. Note that the total individual clouds decrease in the little rainy season. But the frequency of the highest cirrus is the same for both seasons. It suggest that the cirrus clouds above the tropopause in our region is also generated by other mechanism different of the deeply convection, such as in situ formation and air mass advection from the remote site formation.

The highest frequency below the tropopause is the only aspect in our results that agrees with the values reported by Wang et al. (1998). They report values of 3 and 38% for above and in the tropopause, respectively, when the whole tropics are considered. They also report similar frequency for the Pacific regions, i.e. a small frequency value above the tropopause close to 3%. Our results show higher amount of cirrus clouds above the tropopause. Note that Wang et al. (1998) used for their calculations an earlier version of the SAGE II dataset that had a resolution in altitude of 1 km (0.5 km in SAGE II version 6.2) and the tropopause height values were obtained from the old NCEP sounding grid data (from Reanalysis in SAGE II version 6.2).
In order to analyze the differences between the characteristics of the cirrus clouds in the Wider Caribbean region and in the tropics region (20 °N – 20 °S), we made the calculation for whole tropics with the SAGE II dataset version 6.2. The results show for the tropical region occurrence frequency values of 11, 18 and 71% at the above tropopause, in tropopause, and below tropopause, respectively. Both seasons have similar behavior in the occurrence values at the tropics. For the little rainy/rainy seasons the 10%/12% of cirrus clouds are above tropopause, the 19%/16% are in the tropopause and the 71%/72% never reach the tropopause. There are differences between the results in the frequency of occurrence for the Wider Caribbean region and the tropic region. The values of the occurrence of cirrus clouds above the tropopause are lesser for the Wider Caribbean region than for the tropics. Also these occurrences values for the tropics have seasonal behavior. In addition, the seasonal behavior of the frequency of cirrus clouds in the tropopause at the tropics is different from the behavior in the Great Caribbean region. It shows that there is a particular behavior of the cirrus clouds in our region. These results have differences statistically significant at 95% level of confidence. This is a clear example of the importance of the regionalization of such type of studies.
Table II resume the characteristics of the three categories we classified the thin cirrus clouds determined with SAGE II for the seasons. Cirrus clouds in category A and B have the frequency of 40.5 and 48.3%, respectively, for overall time. The high frequency values of both categories support the hypothesis that the principal mechanism of formation of cirrus clouds in our region is associated with deep convection, and other mechanisms are present in the little rainy season. There are similar behaviors in both seasons; the frequency of the type (B) is greater than the type (A). This frequency increase in the rainy period about 9%, contrasted with the little rainy season.
The frequency values obtained for different categories in the present study agree with the results of Wang et al. (1998), who report frequencies of 29 and 70% for the categories (A) and (B), respectively. Our results have higher frequency values for category (A) and lower values for category (B). We obtain also differences, when compare with the results from the calculations for whole tropics with the SAGE II dataset version 6.2. The frequency shows similar values near 45% for both categories. These aspects denote the particular characteristics of the Wider Caribbean region.
The geometrical depths of the cirrus clouds detected were calculated. Figure 2 shows the distribution of the geometrical depth at different cirrus top heights above 10 km, the total cirrus with these characteristics is 1196, the 31% of the total individual clouds. The height interval in the graphics includes the value of the lower limit. The total number of cirrus cloud occurrences in this layer (No) is also shown. The highest occurrence frequency in all layers corresponds to the geometrical depth interval of 0.5 km, although there are relevant values at the intervals of 1.5 km and 2.5 km. This frequency decreases with the increase of the geometrical depth. The 82% of this cirrus cloud population (top height above 10 km) have the top above 13 km. Cirrus clouds with top altitude above 19 km have a different histogram shape. It shows more frequent the cirrus clouds with 2.5 km, and have cirrus clouds in all geometrical depths intervals. This category of cirrus clouds represent 30% of the cirrus clouds with top height over 10 km, and the 9% of the total individual cirrus clouds.
The mean values of the geometrical depth reported in the Table II must be taken cautiously; the category A is the isolated cirrus clouds, the other two categories represent cases of cirrus clouds attached to opaque clouds. The mean geometrical depth for isolated cirrus clouds is 1.96 km with a standard deviation of 1.82 km. Cirrus clouds attached to opaque clouds, represented in the Table II by B + C, have a mean geometrical depth of 2.16 km with a standard deviation of 1.65 km. We find differences in the mean geometrical depths between both seasons. The mean geometrical depth is greater in the rainy season (2.29 km) than in the little rainy season (2.08 km). In the calculations for the whole tropics with the SAGE II version 6.2 dataset the mean geometrical depth to the isolated cirrus clouds are 1.94 km with a standard deviation of 1.77 km. In the category B + C the mean geometrical depth for the whole tropics is 2.35 km with 1.82 km. These results have differences statistically significant at 95% level of confidence. But the values of the geometrical depth in both regions have the same order of magnitude, and the standard deviation is high. Again we can see the importance of the regionalization of such type of studies.
Wang et al. (1998) reports values for the global tropics of 2.2 km with 1.8 km of standard deviation, this is in agreement with our results for the whole tropics and Wider Caribbean. It is also similar to other values reported in the literature for the tropics (Liao et al., 1995a, b). Antuña and Barja (2006) reported values of mean geometrical depth of 2.44 and 0.87 km of standard deviation for thin cirrus clouds measured with a lidar located at Camagüey (21.4 °N, 77.9 °W). This last report has similarity to the values obtained for the Wider Caribbean region with SAGE II.
The mean values of the optical depths at 0.525 and 1.020 μm wavelengths are reported in the Table II, for all the time and both seasons. The values are higher for category (B), showing similar behavior than that of the geometrical depths. Wang et al. (1998) reported higher values of mean optical depth of 3.5 x 10⁻², with 8.3 x 10⁻³ standard deviation, at 1.02 μm wavelength for all samples.
The minimum and maximum values of the optical depth for the isolated cirrus clouds at 0.525 μm are 2.8 x 10⁻⁴ and 4.2 x 10⁻², respectively, with a mean value of 4.0 x 10⁻³. The range of optical depths at 0.525 μm corresponds almost completely with the subvisible cirrus (99%). The threshold value of optical depth for subvisible and thin cloud discrimination is 0.03 (Sassen and Cho, 1992). For the cirrus attached to the opaque clouds (B + C) have a minimum optical depth of 2.8 x 10⁻⁴, maximum of 5.2 x 10⁻², and mean value of 1.4 x 10⁻². Values of mean optical depth of 1.6 x 10⁻² for subvisible cirrus clouds and 7.4 x 10⁻² for thin cirrus clouds determined with lidar at Camagüey, are reported by Antuña and Barja (2006), thus showing an agreement between the two independent results. In the other hand, the mean optical depth values from the calculations for the whole tropics at 0.525 and 1.020 μm are 4.0 x 10⁻³ and 3.3 x 10⁻³, respectively, in the case of isolated cirrus clouds (A). In the case of (B + C) category the mean value of optical depth is 1.4 x 10⁻² for both wavelengths. But there are not differences statistically significant with a level of 99% of confidence.
The mean optical depth for all cirrus clouds measured with SAGE II at 0.525 μm have values of 7.8 x 10⁻³ and 1.2 x 10⁻², for little rainy and rainy periods, respectively. Optical depth differences are statistically significant with 95% of confidence, between the rainy and little rainy seasons.
In order to evaluate the representativity of the characteristics of the cirrus clouds in the Wider Caribbean region, the comparison between different regions is carried out. Fourth subregions was selected, South (0 to 15° latitude), North (15 to 30° latitude), East (50 to 77.5° longitude), West (77.5 to 105° longitude). The contrast was made in the first case between the North and South subregions and the second one between East and West subregions. The result of the mean values for each subregion and the statistical significance in the differences with 99% of signification is shown in the Table III. There are differences statistically significant between North and South subregions in all variables. In the other hand there are not differences statistically significant between East and West subregions in all variables. When the cirrus clouds characteristics in the North and South subregions are compared, the highest, thickest, and optically densest clouds were the ones in the South subregion. The cirrus clouds in the West and East subregions have similar characteristics. These behaviors of the cirrus clouds characteristics follow the circulation pattern in the upper troposphere in the Wider Caribbean region. At this altitude the circulation become a zonal circulation and the surface influence over the circulation vanish. The air mass transport is dominated fundamentally by the zonal winds, and the winds from the Hadley cell. These winds spread from the south to north the moist air and the ice crystals present in the cumulonimbus anvil formed in the deeply convection areas.

There are differences in the mean wind behavior in both subregions, North and South. A change is produced in the mean wind pattern at the upper tropopause and lower stratosphere from the rainy season to little rainy season. Inter–Tropical Convergence Zone (ITCZ) and the Hadley cell play a key role to set up the mean wind patterns in both subregions. The ITCZ in the little rainy season move to the south of equator and the ascendants branches of Hadley cell are displaced to the south subregion. So the zonal winds become weak in the south subregion. On the other hand in the rainy season the ITCZ move to the south subregion. The ascendants branches of the Hadley cell are displaced to the North subregion. Therefore the mean zonal winds become weak in the south subregion. ITCZ have a great convection activity, a water vapor and ice crystals is introduced to the upper troposphere. This is the reason why the subvisible cirrus clouds are highest, optically and geometrically thickest in the South subregion. By the analysis we conclude that in a first approximation the results obtained for the Wider Caribbean are representative to the area. But in future studies using the cirrus clouds measurements must to be cautiously, due the different statistically results obtained in the subregions.
4. Conclusions
There is a seasonal behavior in the occurrence frequency of cirrus clouds measured with SAGE II in the Wider Caribbean region. The frequency is higher in the rainy period than in the little rainy months. The maximum values are 35.5% (rainy) and 17.2% (little rainy). The heights of these maxima are at 14.5 and 12.0 km, respectively. Above the altitude of the maximum of the occurrence frequency a minimum at an altitude close to 17.5 km is located. The values of these minima in the frequency of occurrence are 12% in both season. There are slight increases in the occurrence above the mean tropopause height in both rainy and little rainy seasons with respect to the minima value of occurrence at the tropopause. Kärcher and Solomon (1999) emphasized the continuum character of the cirrus/aerosols mixture systems in the neighborhood of the tropopause. The occurrence frequency above the tropopause in the Wider Caribbean region is lesser than in the whole tropical region, with a level of 95% of significance.
The most frequent, thickest, and optically densest clouds were the ones attached to the opaque clouds layer. The isolated clouds have lower frequency and lesser geometrical and optical depth than clouds attached to opaque clouds layer. At all altitudes the largest geometrical depth frequency is between 0.5 and 2.5 km. The mean optical depth at the wavelength of 0.525 µm was of 7.8 x 10⁻³ and1.2 x 10–2, for the little rainy and rainy seasons, respectively. The 99% of cirrus clouds in the sample are subvisibles, with optical depth values below 0.03.
The results show the particular behavior of the optically thin clouds measured with SAGE II in the Wider Caribbean region in comparison with the tropical region as a whole. Also different statistically results of the cirrus clouds characteristics are obtained for the North and South subregions of the Wider Caribbean. These differences could be explained by the mean wind circulation pattern in the upper troposphere in our region.
Acknowledgements
This work was supported partially by the Cuban Program of Climate Change and Environment under grant No. 01303177. We thank the NASA Langley Research Center for providing the SAGE II data.
References
Antuña J. C. and B. Barja, 2006. Cirrus clouds optical properties measured with lidar at Camagüey, Cuba. Óptica Pura y Aplicada 39,11–16. [ Links ]
Barja B., 2006. Análisis de la frecuencia de ocurrencia de nubes cirros en las observaciones en estaciones de superficie en la región de Camagüey. Revista Cubana de Meteorología 13, 81–91 [ Links ]
Chu W. P. and M. P. McCormick, 1979. Inversion of stratospheric aerosol and gaseous constituents from spacecraft solar extinction data in the 0.38–1.0 micrometer wavelength region. Appl. Opics. 18, 1404–1413. [ Links ]
Chu W. P., M. P. McCormick, J. Lenoble, C. Brogniez and P. Pruvost, 1989. SAGE II inversion algorithm. J. Geophys. Res. Atmos. 94, 8339–8351. [ Links ]
Kärcher B. and S. Solomon, 1999. On the composition and optical extinction of particles in the tropopause region. J. Geophys. Res. 104, 27441–27459. [ Links ]
Kent G. S. and M. P. McCormick, 1991. Separation of cloud and aerosol in two wavelength satellite occultation data. Geophys. Res. Lett. 18, 428–431. [ Links ]
Kent G. S., D. M. Winker, M. Osborn and K. M. Skeens, 1993. A model for separation of cloud and aerosol in SAGE II occultation data. J. Geophys. Res. 98, 20725–20735. [ Links ]
Kistler, R., E. Kalnay, W. Collins, S. Saha, G. White, J. Woollen, M. Chelliah, W. Ebisuzaki, M. Kanamitsu, V. Kousky, H. van den Dool, R. Jenne and M. Fiorino, 2001. The NCEP–NCAR 50–year reanalysis: Monthly means CD–ROM and documentation. B. Amer. Meteor. Soc. 82, 247–267. [ Links ]
Liao X., W. B. Rossow and D. Rind, 1995a. Comparison between SAGE II and ISCCP high–level clouds, 1 global and zonal mean cloud amounts. J. Geophys. Res. 100, 1121–1135. [ Links ]
Liao X., W. B. Rossow and D. Rind, 1995b. Comparison between SAGE II and ISCCP high–level clouds, 2 Locating cloud tops. J. Geophys. Res. 100, 1137–1147. [ Links ]
Mauldin L. E. III, N. H. Zaun, M. P. Jr. McCormick, J. H. Guy and W. R. Vaughn, 1985. Stratospheric aerosol and gas experiment II instrument: A functional description. Opt. Eng. 24, 307–312. [ Links ]
Russell P. B. and M. P. McCormick, 1989. SAGE II data validation and initial data use: An introduction and overview. J. Geophys. Res. 94, 8335–8338. [ Links ]
Sassen K. and B. S. Cho, 1992. Subvisual–thin cirrus lidar dataset for satellite verification and climatological research. J. Appl. Meteorol. 31, 1275–1285. [ Links ]
UNEP, 1983. The Caribbean Environment Programme. Cartagena Convention. United Nation Environmental Programme. http://www.cep.unep.org/pubs/legislation/cartxt.html. Consultation: January, 2008. [ Links ]
Wang P.–H., M. P. McCormick, L. R. Poole, W. P. Chu, G. K. Yue, G. S. Kent and K. M. Skeens, 1994. Tropical high cloud characteristics derived from SAGE II extinction measurements. Atmos. Res. 34, 53–83. [ Links ]
Wang P.–H., P. Minnis, M. P. McCormik, G. S. Kent and K. M. Skeens, 1996. A 6–year climatology of cloud occurrence frequency from stratospheric aerosol and gas experiment: II. Observations (1985–1990). J. Geophys. Res. 101, 29407–29429. [ Links ]
Wang P.–H., P. Minnis, M. P. McCormik, G. S. Kent, G. K. Yue, D. F. Young and K. M. Skeens, 1998. A study of the vertical structure of tropical (20 °S–20 °N) optically thin clouds from SAGE II observations. Atmos. Res. 47–48, 599–614. [ Links ]
Wang P.–H., R. E. Veiga, L. B. Vann, P. Minnis and G. S. Kent, 2001. A further study of the method for estimation of SAGE II opaque cloud occurrence. J. Geophys. Res. 106 D12, 12603–12613. [ Links ]

