


Servicios Personalizados
Revista
Articulo
 Inglés (pdf)
 Artículo en XML
 Referencias del artículo
 Enviar artículo por email
Indicadores
-
 Citado por SciELO
 -
 Accesos
Links relacionados
-
 Similares en
SciELO
Similares en
SciELO
Compartir

 Permalink
Atmósfera
versión impresa ISSN 0187-6236
Atmósfera vol.23 no.2 Ciudad de México abr. 2010
Measurements of polycyclic aromatic hydrocarbons in an urban atmosphere of Agra, India
N. RAJPUT and A. LAKHANI
Department of Chemistry, Dayalbagh Educational Institute, Dayalbagh, Agra, India. Corresponding author: A. Lakhani; e–mail: dbei@sancharnet.in
Received May 22, 2008; Accepted February 19, 2010
RESUMEN
Se determinaron 16 hidrocarburos aromáticos policíclicos (HAP) en muestras de partículas suspendidas totales de un sitio urbano industrial y residencial en Agra (India), de diciembre de 2005 a diciembre de 2006. El promedio de la concentración total de HAP fue de 115 ± 17 ng m–3. Se encontró que las concentraciones determinadas son menores que las reportadas para otras ciudades de la India como Chennai, Delhi, Kanpur, Mumbai y Kolkata. La distribución de masa en el aire estuvo dominada por los compuestos de peso molecular alto. Las concentraciones de HAP mostraron un ciclo estacional anual significativo con concentraciones elevadas durante los meses fríos debido a cambios en las fuentes de emisión y a factores meteorológicos. La presencia de trazadores específicos y el cálculo de tasas moleculares características reveló que los gases vehiculares y las emisiones por la combustión de carbón y biocombustibles son las principales fuentes de esos compuestos.
ABSTRACT
Sixteen polycyclic aromatic hydrocarbons (PAH) were measured in total suspended particulate matter (TSPM) samples collected at an urban and industrial cum residential site in Agra (India) from December 2005 to December 2006. The average total PAH concentration was found to be 115 ± 17 ng m–3. The measured concentrations were found to be lower than those reported from other cities in India like Chennai, Delhi, Kanpur, Mumbai and Kolkata. The mass distribution in air was dominated by high molecular weight compounds. PAH concentration showed a significant seasonal cycle during the year with greater concentration during the cold months due to changes in emission sources and meteorological factors. The presence of specific tracers and calculation of characteristic molecular diagnostic ratios revealed vehicular exhausts and emissions from coal and biofuel combustion as the major sources of these compounds.
Keywords: Total suspended particulate matter, polycyclic aromatic hydrocarbons, gas chromatography, emission sources.
1. Introduction
Polycyclic aromatic hydrocarbons are a class of organic compounds that are considered as ubiquitous contaminants in the environment. They are formed during the incomplete combustion and pyrolysis of organic matter such as coal, oil, wood and fuels like diesel and petrol (Golomb et al., 2001; Halsall et al., 2001; Garban et al., 2002). Benzo(a)pyrene, benzo(b)fluoranthene, benzo(k)fluoranthene, and a number of other aromatic hydrocarbons are formed by the pyrolysis of simple hydrocarbons such as acetylene, butadiene, ethylbenzene, styrene, n–butylbenzene and tetralin at 700 °C (Knize et al., 1999). At the temperature of pyrolysis (about 700 °C) aromatic ring systems are the most stable among the structural type present, while aliphatic C–C bond and C–H bonds readily break down to yield molecular fragments of free radical character which then undergo recombination (Golomb et al., 2001; Hwang et al., 2003).
More than 30 PAH compounds and several 100 PAH derivatives have been identified, that have carcinogenic and mutagenic effects, making them the largest single class of chemical carcinogens known (Bjorseth and Ramdahl, 1985). The physico–chemical properties of the PAH largely determine their environmental behaviour. They are semi–volatile substances at atmospheric conditions and frequently occur both in the vapour–phase and as attached to particles depending on the vapor pressure of each PAH (Wingfors et al., 2001; Basheer et al., 2003). Low molecular weight PAH, containing two or three fused rings are more water soluble and volatile and are found predominantly in vapour phase. High molecular weight PAH containing more than three fused rings, which are primarily associated with particles are found mainly adsorbed on particulate material.
Although PAH are mainly concentrated in urban and industrial zones, they can also be found in rural areas (Gevao et al., 2000; Garban et al., 2002) or even in remote regions (Kallenborn et al., 1998; Migaszewski, 1999) because of their persistence in the environment and their ability to be transported over long distances (Aamot et al., 1996; Halsall et al., 2001). Elevated levels of site specific PAH are generally found near emission sources. They have been measured extensively during the last few decades in environmental samples, especially in atmospheric particles (Halsall et al., 1994; Smith et al., 1996). It is known that some of these PAH are mutagenic and carcinogenic and some of them are associated with acute and chronic health problems and therefore may have a potential health impact on man (IARC, 1984; Menzie et al., 1992; Nielson et al., 1996; Fang et al., 2004). In the last decade, more and more data on airborne concentrations of PAH have become available from many industrialized countries around the world such as Brazil, 84.5 ng m–3 (Tavares et al., 2004), China, 170–490 ng m–3 (Simoneit et al., 1991), UK, 20–164 ng m–3 (Coleman et al., 1997; Gardner et al., 1995), USA, 48.3–58.3 ng m–3 (Simick et al., 1997), urban Malaysia, 7–9 ng m–3 (Fang et al., 1999; Omar et al., 2002), urban Heraclion, 21.4–59 ng m–3 (Gogou et al., 1996). However, for the less developed nations, the availability of data is far less. Existing studies of PAH concentration in urban atmospheres in India include those carried out in Mumbai (Mohan Rao et al., 1983; Kulkarni and Venkataraman, 2000), Lucknow (Bhargava et al., 2004), Ahmedabad (Aggarwal et al., 1982; Raiyani et al., 1993) and Nagpur (Vaishali et al., 1997) conducted with a view to evaluate the carcinogenic risk from PAH exposure. Studies carried out by Raiyani et al. (1993) in Ahmedabad showed total PAH concentration of 90–195 ng m–3 in an industrial area and between 23–66 ng m–3 in a residential area. Concentration of four PAH in an industrial area in Mumbai ranged between 20–95 ng m–3 (Pandit et al., 1996). PAH concentration in residential, commercial and industrial areas in Nagpur were 125–190 ng m–3 with over 70% of the mass in particles less than 10 µm diameter (Vaishali et al., 1997). Average total PAH levels were found to be 77.40±21.16 ng m–3 measured during winter for 3 years from 1992 to 1994 (Chattopadhyay et al., 1998). PAH concentrations in indoor studies from Lucknow were found high for cow dung cake combustion ranging from 2.23–46.07 µg m–3 and lowest for liquefield petroleum gas (LPG) combustion ranging from 0.86–4.76 µg m–3 (Bhargava et al., 2004). Studies carried out at Mumbai revealed higher concentrations of PAH in the breathing zones and maximum concentrations in winter compared to summer (Kulkarni and Venkataraman, 2000). Bimodal size distributions were obtained with a predominance of non–volatile PAH species in the fine mode and semi–volatile PAH species in the coarse mode with automobile emissions being the primary PAH contributor along with cooking fuel combustion and industrial oil burning (Kulkarni and Venkatraman, 2000). Recently a few studies have also been carried out at several locations to determine the major emission sources, seasonal variations and the factors causing these variations (NEERI, 2006; Sharma et al., 2008; Gupta et al., 2006)
Agra has experienced rapid urbanization and industrial expansion resulting in increased utilization of fossil fuels in automobiles, trucks and public transportation. It observes an arid climate that may further aggravate pollution levels resulting in enormous levels of suspended particulate matter, that have been reported to vary between 130–190 µg m–3 (Parmar et al., 2001). Studies on characterization of wet deposition, dry deposition, aerosols, fog and dew have been carried out at Agra, particularly with reference to their inorganic constituents (Saxena, 1992; Saxena et al., 1996; Kulshrestha et al., 1995; 1998; Kumar et al., 1996; Parmar et al., 2001). However, no data on PAH are available for Agra. The purpose of the present study was to obtain baseline information on the concentration of PAH in total suspended particulate matter.
2. Experimental section
2.1. Description of sampling site
Agra is situated in the extreme southwest corner of Uttar Pradesh and stretches across 26° 44' N to 27° 25' N and 77° 26' E to 78° 32' E. Its borders touch Rajasthan to its west and south, the district of Firozabad to its East and the districts of Mathura and Etah to its North. It is situated on the banks of river Yamuna, it has a limited forest area suporting mainly decidous trees. A map of Agra is shown in Fig. 1.
With increase in urbanization and industrialization, Agra has developed industrially in the last two decades. An increase in number of licensed industrial units has also resulted in an increase in population and vehicular traffic. According to census 2001, the area of Agra district is 4027 km2 with a total population of about 1,316,177 and density about 21,148 of km2 with 386,635 vehicles registered and 32,030 generator sets. In Agra, 60% pollution is due to vehicles (NAAQS, 2006). Three highways cross the city. Vehicular traffic on these highways is high (105 vehicles per day). Primarily, the economy of Agra is agriculture based with a few small–scale industries, commerce and trade. Anthropogenic sources in the city include emissions from industrial processes, transportation and biomass combustion. Apart from the local sources, Mathura refinery and Firozabad glass industries are both situated at a distance of about 40 km from Agra. Meteorology of Agra is such that prevailing winds are mostly from the north–west so that Mathura lies upwind while Firozabad downwind. However, on the basis of Gaussian dispersion model it has been shown that Mathura refinery contributes insignificant amount of SO2 (Goyal and Singh, 1990).
Agra observes a continental type of climate and extremities of climate with scorching hot summers and chilly winters. It is about 169 m above the mean sea level (msl), has been reported as having semiarid climate with atmospheric temperature ranging from 11–48 °C (max) and 0.7– 30 °C (min), relative humidity 25–95%, light intensity 0.7–5.6 oktas (cloudiness) and rainfall 650 mm per year. It has three distinct seasons: summer, winter and monsoon. The summer season extends from March to June, the monsoon season is from July to September, while the winter months are from October to February. During summer the temperature varies between 23–45 °C and relative humidity is low ranging between 25–40%. Summers are characterized by strong winds, which are usually accompanied by dust storms creating a haze of resuspended dust in the atmosphere. The monsoon months are characterized by high relative humidity (70–100%) and the temperature drops to 26–37 °C with occasional rains. In winter the temperature varies between 2–15 °C, while relative humidity ranges between 60–90% with occasional fog episodes when the visibility is reduced.
Figure 2 shows the seasonal changes in wind direction and wind frequency along with the graph projecting monthly variation in temperature and relative humidity during the study period. Generally speaking, the winter (October–February) and monsoon (July–September) seasons showed high relative humidity, while summers (March–June) were characterized by low relative humidity. During the study period due to lack of rainfall, monsoon months were hot with high relative humidity comparable to winter months.
The wind pattern of Agra is also shown in Figure 2 with the help of wind rose plots. As shown west–northwest–north winds with velocities ranging between 5–9 km h–1 were more prominent during winter season. The monsoon and summer seasons projects prevalence of west–east–northeast winds with velocities ≥ 10 km h–1.
Total suspended particulate matter (TSPM) present in the air were collected using high volume sampler (HVS–430) installed on the roof of a single storeyed building at Nunhai, Agra. This is an industrial area situated on the eastern periphery of the city. Industrial activities carried out here include cupola based ferrous and non–ferrous metal casting, rubber processing, lime oxidation, pulverization and general engineering works. The cupola conventionally is a unit for melting cast iron in the foundries. It normally uses coke as fuel. Combustion of coke generates a variety of gaseous products such as oxides of carbon (COx), nitrogen (NOx) and sulphur (SO2) as well as excessive suspended particulate mater (SPM). The exhaust emission from iron foundries have been reported to emit suspended particulate matter in the range of 400 to 3000 mg m–3, more than 400 mg m–3 of SO2 (http://www.nmlindia.org/Technology/cokelesscupoladetails.html) and some undesirable NOx. These figures are rather high from the pollution point of view. The permissible limits for SPM and for SO2 are 150 and 350 mg m–3, respectively, according to the Central Pollution Control Board (CPCB), India (http://www.nmlindia.org/Technology/cokelesscupoladetails.html). In concern with the protection of the Taj Mahal, situated at Agra, public awareness and the pressure from the environmental activities have forced foundry owners to look into the pollution aspects and to take corrective measures for its mitigation to the lowest permissible limits. The directives of the Honorable Supreme Court of India further strengthened the development of eco–friendly coke–less cupola in the year 1995. It prohibits the use of coke in all the foundries particularly in the Taj trapezium and in all the Indian foundries at large. Since then, natural gas based cokeless cupolas have been commissioned in some of the progressive foundries (http://www.nmlindia.org/Technology/cokelesscupoladetails.html). A major highway (NH–2) with a traffic density of about 20,000 vehicles per day lies approximately 1 km away from the site. To the north–west of the site is situated Foundary Nagar, another industrial subarea where iron foundries and diesel engine manufacturing units are located.
2.2 Sampling
PAH compounds were quantified in the TSPM collected on glass fibre filter papers (EPM 2000) using a high volume sampler (APM 430) from December 2005– December 2006. During this period 45 samples were collected. The sampler was installed on the roof of a single storeyed building at Nunhai, Agra. Samples were collected over a time period of 24–30 h at an average flow rate of 1.4 m3 min–1. The glass fiber filters were weighed on a Mettler (AJ 150) electronic balance of 0.0001g precision and desiccated until constant weight both before and after sampling to determine the total suspended particulate matter. The filters were stored in sealed polythene bags at low temperature until analysis. The filters were extracted thrice with HPLC grade dichloromethane (DCM) (Merck) by ultrasonication for 1 h. The samples were filtered through glass filters and concentrated to about 1 ml using rotary evaporator. The extract thus obtained was subjected to undergo cleanup process. The extract was loaded on the top of a column (10 cm x 1.0 cm i.d.) slurry packed with 5 g of silica gel (Fluka 230 mesh). The column was eluted with DCM to give a fraction enriched with PAH. The PAH containing fraction was concentrated to 1 ml by passing nitrogen and stored in teflon vials at low temperatures till further analysis.
2.3 Analysis
PAH were determined using a gas chromatograph (Shimadzu GC–17A) with a flame ionization detector (FID) in a splitless mode. The chromatograph was equipped with a 30 m long, 0.25 mm i.d., 0.25µm film thickness capillary column (dimethyl polysiloxane). Nitrogen was the carrier gas at flow rate of 12.7 ml min–1. The oven temperature was held at 40 °C for 5 min and programmed to rise to 179 °C at 10 °C min–1 held for 2 min and then elevated to 300 °C at a rate of 9 °C min–1. The temperature of injector was 210 °C and temperature of detector was 310 °C, the injection volume was 1 µl.
Quantification was performed from the GC profiles using the external standard method. The external standard was purchased from Supelco containing 16 PAH compounds (EPA 610 PAH mixture) including naphthalene [Nap], acenapthylene [Acy], acenapthene [Ace], fluorene [Flu], phenanthrene [Phen], anthracene [Anth], fluoranthene [Fla], pyrene [Pyr], benzo(a)anthracene [BaA], chrysene [Chy], benzo(b)fluoranthene [BbF], benzo(k)fluoranthene [BkF], benzo(a)pyrene [BaP], dibenz(a,h)anthracene [DbA], benzo(ghi)perylene [BghiP], indeno(1,2,3–cd)pyrene [IP]. Quantification of PAH was performed by the linear regression method (r2 > 0.99) using five–point calibration curves established between the authentic standard concentrations and corresponding peak areas. Analysis of serial dilutions of PAH standard showed the limit of detection of the chromatographic method between 0.007 to 0.16 ng for the PAH compounds. The limit of quantification (LOQ) defined as the limit of detection divided by the sampling volume (Vasconcellos et al., 2003) was in the range of 1.8 x 10⁻⁷ and 4.10 x 10⁻⁵ ng m–3 . The recovery efficiency of the method was evaluated by the analysis of filters spiked with known concentration of standard PAH compounds. Most of the compounds provided high recoveries with mean values ranging between 70 to 80%. Field and laboratory blanks were routinely analyzed for quality control. Blanks levels of individual analytes were normally very low and in most cases not detectable.
3. Results and discussion
3.1 Total PAH (TPAH) and TSPM concentrations at the site
Forty five samples were collected and quantified for 16 PAH compounds during December 2005 to December 2006. The concentration of TSPM ranged from 198 to 690 μg m–3. 30% samples presented TSP concentration above the Indian guideline value of 500 μg m–3 for industrial areas (National Ambient Air Quality Standards, NAAQMS, 1994). Total PAH concentration was obtained by summing up the individual concentration of PAH compounds. Concentrations of individual compounds showed a skewed distribution with total PAH concentrations varying between 15 to 392 ng m–3. Hence the concentrations of individual PAH compounds and TPAH are represented as their geometric means. These are summarized in Table I.

The mean value of TPAH 119 ± 17 ng m–3 observed at this site is lower than those observed at Delhi, Chennai, Mumbai, Kanpur and Kolkata reported by the National Environment Engineering Research Institute, Nagpur (NEERI 1991–2001) as listed in Table II. However, the observed value is comparable to the mean value of 106.6 ng m–3 reported from ten sites in Nagpur (Pandya et al., 2009). The TPAH concentration at this site is also comparable to those reported in TSP from urban sites in China (170–490 ng m–3 and 305 and 42 ng m–3 recorded in the months of November to March and March to November, respectively) (Simoneit et al., 1991; Okuda et al., 2006), 165 ng m–3 in London (Gardner et al., 1995), 20–164 ng m–3 in Manchester (UK) (Coleman et al., 1997), but higher than several urban locations such as 84.5 ng m–3 in Londrina (Brazil) (Tavares et al., 2004), and 48.3–53.8 ng m–3 in Chicago (USA) (Simick et al., 1997).
Sources of PAH in the urban atmosphere of industrial areas primarily include automobiles, resuspended soils, refineries and power plants. In addition, in the Indian urban environment, cooking fuel combustion is also a likely source of PAH. High concentrations of PAH have been measured in smoke from solid–fuel stoves burning wood, coal and dried cattle manure (Raiyani et al., 1993), which along with kerosene stoves (Saksena, 1999) are used as the primary cooking device by urban slum residents. The higher concentrations of PAH observed at the present site are probably contributed by multiple sources as the site is an industrial cum residential center located near a major traffic junction through which the National Highway 2 also passes by. The industries here are mainly the ferrous and non–ferrous foundries and several diesel generator manufacturing units. Although, most of the foundries are natural gas based, yet there are quite a large number of units that have not switched to the cleaner fuels and still use coal and coke based furnaces. The vehicle fleet in Agra comprises of trucks, buses, delivery vans, taxis, private cars and autorickshaws that are mainly diesel driven. The number of registered on–road diesel vehicles in Agra till January 2008 was approximately 51,938 (RTO, 2008). Diesel driven generators are almost exclusively used in the industrial units as well as in the households as a stand by to meet power requirements during periods of load shedding. The diesel quality is poor containing a high S content, to the extent of 0.25%, and a large amount of aromatics. We have also quantified PAH in the diesel fuel procured from several filling stations in Agra as well as in exhaust from a diesel generator (Rajput and Lakhani, 2009). Concentration of individual PAH compounds varied from 10 to 4.4 x 10² mg L–1 with TPAH concentration of 9.5 x 10³ mg L–1, higher than those reported in other studies (Rajput and Lakhani, 2009). Moreover, a large population of the slum residents of the area use coal, coke, wood, kerosene and cowdung cakes as the domestic fuel, which is burnt in small home made cookstoves. Earlier studies including measurements of several PAH species in ambient aerosol in Ahmedabad, New Delhi, Mumbai and Nagpur show that total PAH concentration in Indian cities are 10–50 times higher than those reported internationally and range between 23–190 ng m–3 (Raiyani et al., 1993; Pandit et al., 1996; Vaishali et al., 1997). Recently, Hafner et al. (2005) have also revealed that PAH concentrations in sites from developing countries like Brazil, Iran, Congo, India, China, Taiwan, Brunei, Croatia, the Czech Republic and Slovakia, are consistently over an order of magnitude higher than those in developed countries of the same population. This has been attributed to their increased reliance on coal for domestic energy (Hafner et al., 2005).
The influence of these multiple sources namely, emissions from industries, traffic and non–conventional domestic energy sources is evident from the profile and distribution pattern of individual PAH (Table I). Among the low molecular weight compounds Nap was almost undetectable in most of the samples, while Acy and Ace were detected in only a few samples. However Flu, Phen, Pyr and Chy were the dominant low molecular weight PAH and BbF, BkF, BaP, DbA, BghiP and IP were the dominant high molecular weight PAH. The concentrations of individual PAH ranged from 0.8 to 47.3 ng m–3.
Few PAH have been identified as markers for various sources in urban atmosphere (Daisey et al., 1986; Li and Kamens, 1993; Rogge et al., 1993; Venkataraman et al., 1994; Khalili et al., 1995). Pyr and Chy are emitted from industrial oil burning. Fla and Pyr are emitted from both petrol and diesel vehicles with additional IP from petrol vehicles and Chy, BbF, BkF from diesel powered vehicles. PAH profile of diesel bus emissions have also shown a large predominance of phenanthrene along with small amounts of chrysene and benzo(e)pyrene (Shankar, 1990). Wood burning in cooking stoves shows a predominance of benzo(a)pyrene (Li and Kamens, 1993). Emissions from dried cattle–manure show a predominance of the low molecular weight species (fuoranthene, pyrene and chrysene), possibly because of the lower combustion temperature than wood, and of benzo(a)pyrene. The fossil–cooking–fuel emissions show a predominance of pyrene and benzo(a)pyrene, while coal and kerosene show additional predominance of dibenz–anthracene, benzo(ghi)perylene and indeno (123–cd)pyrene.
At the present site it appears that both adsorption and absorption govern the gas/particle partitioning of PAH to aerosols. Although in the present study size–segregated analysis of PAH has not been done, however size distribution measured at Mumbai has shown a predominance of non–volatile PAH species in the fine mode and semi–volatile PAH species in the coarse mode (Venkataraman et al., 1999). Size distribution studies conducted by us in the past at Agra have shown that the ambient aerosols comprise both coarse (51.6 %) and fine aerosols (48.4 %) (Parmar et al., 2001). The coarse aerosols are largely soil derived while the fine aerosols have anthropogenic sources like industrial emissions and vehicular traffic which rely on diesel and gasoline fuels. As coarse particles undergo many cycles of resuspension and deposition this could result in multi–layer adsorption to them.
The sum of the concentration of nine major combustion PAH (CPAH) (Fla, Pyr, BaA, Chy, B(b+k)F, BaP, BeP, IP and BghiP) in these samples (excluding BeP) accounted for 73% of the total PAH mass. The ratio of CPAH/TPAH was 0.73. The value of CPAH/TPAH ratio has been calculated for non–catalyst (0.41) and catalyst (0.51) automobiles and for heavy duty diesel trucks (0.30) (Rogge et al., 1993). Higher CPAH/TPAH ratios indicate that there are more extensive combustion activities in the city. A less efficient emission control system in the vehicle fleet may also account for this high CPAH/TPAH ratio. In India vehicles are not equipped with a catalytic converter. According to Rogge et al. (1993), non–catalyst vehicles emit 27 times more PAH, especially HMW PAH, than catalyst equipped vehicles.
The carcinogenic PAH have high molecular weights and are especially bound to suspended particles. IARC has classified total carcinogenic PAH considered as probably carcinogenic to humans (namely BaA, BaP and DbA) and as possibly carcinogenic to humans (namely BbF, BkF and IP) (Pereira Netto et al., 2004). In the present study each of these represented 30% of the total PAH.
3.2 Variations in PAH concentration
A seasonal trend was observed for both individual compounds and the total PAH concentration. Concentration of PAH varied inversely with temperature, i.e. higher concentration in the cold months (December to February) and lower in the warm months (April to June). The monthly average total PAH concentrations at the site were in the range of 15–78 ng m–3 during April–June, while the monthly average of daily maximum temperature ranged between 30 to 49 °C compared with 40–392 ng m–3 from November to February, with monthly average of daily maximum temperature varying between 2–15 °C. The increase in particulate PAH concentration during the winter and the dependence of concentration on atmospheric temperature have been reported in a number of previously published studies (Sanderson et al., 2004; Tsapakis and Stephanou, 2005; Li et al., 2006). The seasonal distribution of particle associated PAH is controlled by a combination of emission factors, dispersion conditions and chemical mechanisms (Carricchia et al., 1999; Menichini et al., 1999). This balance depends on the relative importance of degradation processes and emission sources (Guo et al., 2003). As PAH are generated in the atmosphere due to combustion processes, high concentrations at lower temperatures during cold months reflect the increase due to increased fuel combustion involving wood burning and coal combustion for indoor activities and space heating. During the cold season, PAH emissions from automobile exhaust are also higher because of low ambient temperature and increased cold start impacts (Ludykar et al., 1999). Traffic congestion during winter due to poor visibility, fog, mist and haze might also result in enhanced PAH levels. In addition to the anthropogenic factors, effects of temperature and humidity on the physico–chemical properties of PAH, can also lead to variation of particulate PAH. Low atmospheric temperature can affect the distribution of PAH between the gas and particle phases and result in a relatively larger portion of PAH partitioning to the particles phase. Other factors known to contribute to higher wintertime PAH concentration include reduced atmospheric dispersion resulting from lower atmospheric mixing heights and decreased photochemical oxidation. In summer, the lower PAH levels are likely attributed to the combination of easier atmospheric dispersion of pollutants, photo–degradation (Baek et al., 1991) and a higher percentage in the vapor phase and, to a lesser extent, by wash out effects by intermittent rains.
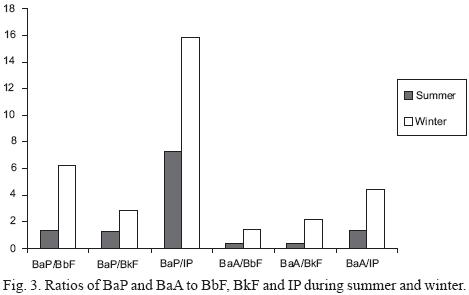
The interpretation of any seasonal variability of PAH profile is expected to be complicated by chemical and photochemical degradation of PAH, mostly occurring at higher rates under summer conditions, with high sunlight intensities, temperatures and ozone concentrations. This degradation is especially active for BaP, BaA and to a lesser extent to DbA, while a lower reactivity is reported for BbF and BkF and a minimum one for IP (Lane and Katz, 1977; Valerio and Pala, 1991; Lane, 1989). Hence to better understand the role of photo–degradation on the variability of the profile, profiles of PAH relative to BeP which is a more stable compound (Butler and Crossley, 1981; Lane, 1989) are usually calculated. The more the individual PAH are stable the more they are expected to be in constant ratio to BeP. In the present study since BeP was not analyzed, BbF, BkF and IP were chosen as reference to determine temporal variability. Concentration ratios of BaP/BbF, BaP/BkF, BaP/IP, BaA/BbF, BaA/BkF and BaA/IP were calculated for each sample and their mean values for summer and winter periods are shown in Figure 3. The ratios of BaP and BaA to the relatively stable BbF, BkF and IP showed a marked and very similar seasonality with lower values during summer months, which are characterized by maximum number of daylight hours, maximum sunlight intensity, high temperatures and also high ozone concentration. These findings are also consistent with the fact that BaA and BaP have similar susceptibility to degradation, and suggests that photochemical degradation was also an important factor causing variation of PAH concentrations over the two sampling periods.
3.3 Correlations
Correlation analysis was performed to determine relationships between individual PAH and to hypothesize probable sources on the assumption that two or more components may correlate either due to a common origin or atmospheric behavior. Correlations between individual PAH were determined by the SPSS software (version 9.0), the correlation matrix is presented in Table III. Significant correlation (r > 0.5; *p < 0.001, **p < 0.002; ***p < 0.015) was obtained among the low molecular weight (LMW) compounds as well as high molecular weight (HMW) PAH.
Diesel fuel is reported to contain high concentration of LMW compounds while HMW compounds are normally present at detection limits (Marr et al., 1999; Lin et al., 2006; Rajput and Lakhani, 2009). On the contrary, the HMW compounds are reported to exert greater emission rates on combustion of diesel fuel as compared to the LMW PAH that are ascribed to their pyrosynthesis during fuel combustion in engine (Marr et al., 1999; Lin et al., 2006; Rajput and Lakhani, 2009). The high correlations for the LMW PAH namely Flu, Ace and Acy are attributed to their primary emission from diesel exhaust, while significant correlation between HMW PAH, namely Fla, BaA, BkF, BbF and BaP is inferred to their secondary production during the combustion process. Further, good correlation is also observed between BkF, IP, Fla and Pyr indicating their contributions from both gasoline and diesel combustion. Significant correlations ranging between 0.89–0.99 are also observed between Fla, Pyr and BaP, which also points to their contribution from combustion of biofuels (wood and cowdung cakes) and coal.
3.4 Determination of PAH emission sources
In order to characterize the major sources of PAH, the study of ratios was applied. The impact of different sources can be qualitatively confirmed by molecular diagnostic ratios. Different ratios exist and are used to identify the contributions of sources such as combustion and biogenic emissions. When these ratios are used to determine the sources, it is hypothesized that paired chemicals are diluted to a similar extent and that the ratios remain constant en route from sources to receptors. Studies indicate that particulate organic samples collected in tunnels are enriched in benzo(ghi)perylene and coronene, which are characteristic of gasoline engines (Miguel et al., 1998). Masclet et al. (1986) found that diesel exhaust was enriched in Fla, Chy and Pyr. Khalili et al. (1995) identified that Anth, Phen, Fla and Pyr were source fingerprints of wood combustion while Anth, Phen, Fla, Pyr, BaA and Chy were markers of coal combustion. Thus concentrations of these marker compounds and their ratios can give some indication about the impact of different sources of airborne compounds and can be used in distinguishing emissions (Li and Kamens, 1993; Venkataraman et al., 1994; Khalili et al., 1995; Harrison et al., 1996; Alves et al., 2001). This diagnosis is performed by comparing computed ratios with those reported in literature (Kavouras et al., 2001; Kavouras and Stephanou, 2002; Park et al., 2002; Tsapakis and Stephanou, 2002). The concentration ratios of different PAH in particles from diesel engines, gasoline engines, factories, coal stoves from previous studies and this study are shown in Table IV. The vehicular influence determined by Fla/(Fla+Pyr) with a value of 0.5 in the present study lies in the range given by Tspakis et al. (2002) and Sicre et al. (1987) for gasoline and coal emissions. Literature reported values for IP/(IP + BghiP) ratio are 0.18, 0.37 and 0.56 for cars, diesel and coal respectively (Grimmer, 1983). The ratio obtained in this study (0.35) is comparable to the reported values for diesel emissions (Rogge et al., 1993). The value of BaA/(BaA + Chy) ratio of 0.46 is comparable to reported values of 0.38–0.64 (Sicre et al., 1987) for diesel–powered vehicles, while for gasoline powered vehicles values ranges between 0.22–0.55 (Simick et al., 1997). Based on BaP/(BaP+Chy) ratio with a value of 0.72, we may infer the contribution of emissions from diesel engine vehicles. The BaP/BghiP and IP/BghiP ratios with values 1.38 and 0.54, respectively, for the present study indicate the prevalent contribution from gasoline and traffic emissions (Carrichia et al., 1999; Pandey et al., 1999).
4. Conclusions
In this study, levels of atmospheric particle bound PAH were monitored at an industrial site of Agra. Higher concentrations of PAH were observed, that are possibly due to multiple sources in the area. Among all the PAH compounds, the 5 and 6 ring compounds were predominant. PAH levels also showed a seasonal dependence with greater concentrations in the cold months. Correlation and study of diagnostic ratios revealed influence of traffic emissions and coal and biofuel combustion.
Acknowledgements
The authors are grateful to the Director, Dayalbagh Educational Institute Agra; Head, Department of Chemistry for providing necessary help; and Department of Science and Technology, DST project No.: SR/S4/AS:207/02, New Delhi, for financial assistance.
References
Aamot E., E. Steinnes and R. Schmid, 1996. Polycyclic aromatic hydrocarbons in Norwegian forest soils; impact of long range atmospheric transport. Environ. Pollut. 92, 275–280. [ Links ]
Aggarwal A. L., C. V. Raiyani, P. D. Patel, P. G. Shah and S. K. Chatterjee, 1982. Assessment of exposure to Benzo(a)pyrene in air for various population groups in Ahmedabad. Atmos. Environ. 16, 867–870. [ Links ]
Alves C., C. Pio and A. Durate, 2001. Composition of extractable organic matter of air particles from rural and urban Portugese areas. Atmos. Environ. 35, 5485–5496. [ Links ]
Baek S. O., R. A. Field, M. E. Goldstone, P. W. W. Kirk, J. N. Lester and R. Perry, 1991. A review of atmospheric PAHs: Sources, fate and behaviour. Water Air Soil Poll. 60, 279–299. [ Links ]
Basheer C., R. Balasubramanian and H. K. Lee, 2003. Determination of organic micropollutants in rainwater using hollow fiber membrane/liquid phase microextraction combined with GC–MS. J. Chromatogr. A 1016, 11–20. [ Links ]
Bhargava A., R. N. Khanna, S. K. Bhargava and K. Sushil, 2004. Exposure risk to carcinogenic PAHs in indoor–air during biomass combustion whilst cooking in rural India. Atmos. Environ. 38, 4761–4767. [ Links ]
Bjorseth A. and T. Ramdahl, 1985. Sources of emissions of PAH. In: Handbook of Polycyclic Aromatic Hydrocarbons (A. Bjorseth and T. Ramdahl, Eds.) Volume 2, Marcel Dekker, New York, 1–20. [ Links ]
Butler J. D. and P. Crossley, 1981. Reactivity of polycyclic aromatic hydrocarbons adsorbed on soot particles. Atmos. Environ. 15, 169–182. [ Links ]
Caricchia A. M., S. Chiavarini and M. Pezza, 1999. PAHs in the urban atmospheric particulate matter in the city of Naples (Italy). Atmos. Environ. 33, 3731–3738. [ Links ]
Chattopadhyay G., G. Samanta, S. Chatterjee and D. Chakraborti, 1998. Determination of particulate polycyclic aromatic hydrocarbons in ambient air of Calcutta for three years during winter. Environ. Technol. 19, 873–882. [ Links ]
Coleman P. J., R. G. M. Lee, R. E Alcock and K. C. Jones, 1997. Observations on PAH, PCB and PCDD/F trends in UK urban air 1991–1995. Environ. Sci. Technol. 31, 2120–2124. [ Links ]
Daisey J. M., J. L. Cheney and P. J. Lioy, 1986. Profiles of organic particulate emissions from air pollution sources: status and needs for receptor source apportionment modelling. JAPCA J. Waste Ma. 36, 17–33. [ Links ]
Fang M., M. Zhgeng, F. Wang, K. L. To, A. B. Jaafar and S. L. Tong, 1999. The solvent extractable organic compounds in the Indonesia biomass burning aerosols– characterization studies. Atmos. Environ. 33, 783–795. [ Links ]
Fang G. C., Y. S. Wu, M. H. Chen, T. T. Ho, S. H. Huang and J. Y. Rau, 2004. Polycyclic aromatic hydrocarbons study in Taichung, Taiwan, during 2002–2003. Atmos. Environ. 38, 3385–3391. [ Links ]
Garban B., H. Blanchoud, A. Motelav–Masei and D. Ollivon, 2002. Atmospheric bulk precipitation of polycyclic aromatic hydrocarbons onto France at typical environmental sites. Atmos. Environ. 36, 5395–5403. [ Links ]
Gardner B., C. N. Hewitt and K. C. Jones, 1995. PAHs in air adjacent to inland water bodies. Environ. Sci. Technol. 29, 2405–2413. [ Links ]
Gevao B., J. Hamilton–Taylor and K.C. Jones, 2000. Towards a complete mass balance model for PCB and PAH in a small rural lake, Cumbria, UK. Limnol. Oceanogr. 45, 881–894 [ Links ]
Gogou A., N. Statigakis, M. Kanakidou and E. G. Stephanou, 1996. Organic aerosols in eastern Mediterranean: components source reconciliation by using molecular markers and atmospheric back trajectories. Org. Geochem. 25, 79–96. [ Links ]
Golomb D., E. Barry, G. Fisher, P. Varanusupakul, M. Koleda and T. Rooney, 2001. Atmospheric deposition of polycyclic aromatic hydrocarbons near New England coastal waters. Atmos. Environ. 35, 6245–6258. [ Links ]
Goyal P.and M.P.Singh,1990. The long term concentration of sulphur dioxide at TajMahal due to Mathura refinery. Atmos.Environ. 24, 407–411. [ Links ]
Greenberg A., 1989. Phenominological study of Benzo(a)Pyrene and cyclopenteno(cd)pyrene decay in ambient air using winter/summer comparisons. Atmos. Environ. 23, 2797–2799. [ Links ]
Grimmer G., 1983. Profile analysis of PAH in air. In: Handbook of polycyclic aromatic hydrocarbons. (A. Bjorseth, Ed.) Marcell Dekker Inc, New York, 149–183. [ Links ]
Guo H., S. C. Lee, K. F. Ho, X. M Wang and S. C. Zou, 2003. Particle–associated polycyclic aromatic hydrocarbons in urban air of Hong Kong. Atmos. Environ. 37, 5307–5317. [ Links ]
Gupta A. K., Subhankar Nag and U. K. Mukhopadhyay, 2006. Characterisation of PM10, PM2.5 and benzene soluble organic fraction of particulate matter in an urban area of Kolkata, India. Environ. Monit. Assess. 115, 205–222 [ Links ]
Hafner D. W., C. L Daniel and R. A. Hites, 2005. Influence of local human population on atmospheric polycyclic aromatic hydrocarbon concentrations. Environ. Sci. Technol. 39, 7374–7379. [ Links ]
Halsall C. J., P. J. Coleman, B. J. Davis, V. Burnett, K. S. Waterhouse and K. C. Harding–Jones, 1994. Polycyclic aromatic hydrocarbons in UK urban air. Environ. Sci. Technol. 28, 2380–2386. [ Links ]
Halsall C. J., A. J. Sweetman, L. A. Barrie and K. C. Jones, 2001. Modelling the behaviour of PAH during atmospheric transport from the UK to the Arctics. Atmos. Environ. 35, 255–267. [ Links ]
Harrison R. M., D. J. T. Smith and L. Luthana, 1996. Source apportionment of atmospheric polycyclic aromatic hydrocarbons collected from an urban location in Birmingham, UK. Environ. Sci. Technol. 30, 825–832. [ Links ]
Hwang Hyun–Min, L. Wade Terry and J. L. Sericano, 2003. Concentrations and source characterization of polycyclic aromatic hydrocarbons in pine needles from Korea, México and United States. Atmos. Environ. 37, 2259–2267. [ Links ]
IARC, 1984. Polynuclear aromatic compounds – Part I. Chemicals. International Agency for Research on Cancer. Environmental and Experimental Data. Monograph 32. [ Links ]
Kallenborn R., M. Oehme, D. D. Wynn–Williams, M. Schlabach and J. Harris, 1998. Ambient air levels and atmospheric long–range transport of persistence organochlorines to Signy Island, Antarctica. Sci. Total Environ. 220, 167–180 [ Links ]
Kavouras I. G., P. Koutrakis, M. Tsapakis, E. Lagoudaki, E. G. Stephanou, D. V. Baer and P. Oyala, 2001. Source apportionment of urban particulate aliphatic and polynuclear aromatic hydrocarbons (PAHs) using multivariate methods. Environ. Sci. Technol. 35, 2288–2294. [ Links ]
Kavouras T. G. and E. G. Stephanou, 2002. Gas/particle partitioning and size distribution of primary and secondary carbonaceous aerosols in public buildings. Indoor Air 12, 17–32. [ Links ]
Khalili N. R., P. A. Scheff and T. M. Holsen, 1995. PAH source fingerprints for coke ovens, diesel and gasoline engines, highway tunnels and wood combustion emissions. Atmos. Environ. 29, 533–542. [ Links ]
Knize M. G., C. P. Salmon, P. Pais and J. S. Felton, 1999. Food heating and the formation of heterocyclic aromatic amine and polycyclic aromatic hydrocarbon mutagens/carcinogens. Adv. Exp. Med. Biol. 459, 179–193. [ Links ]
Kulkarni P. and C. Venkataraman, 2000. Atmospheric polycyclic aromatic hydrocarbons in Mumbai, India. Atmos. Environ. 34, 2785–2790. [ Links ]
Kulshrestha U. C., A. Saxena, N. Kumar, K. M. Kumari and S. S. Srivastava, 1995. Mass distribution of aerosols at a suburban site of Agra. Indian J. Radio Space Physics 24, 178–183. [ Links ]
Kumar N., U. C. Kulshrestha, P. Khare, A. Saxena, K. M. Kumari and S. S. Srivastava, 1996. Measurements of formic and acetic acid in the vapour phases at Dayalbagh, Agra, India. Atmos. Environ. 30, 3545–3550. [ Links ]
Lane D. A. and M. Katz, 1977. The photomodification of benzo(a)pyrene, benzo(b)fluoranthene and benzo(k)fluoranthene under simulated atmospheric conditions. In: Fate of pollutants in the air and water environment. Part 2, Wiley, Toronto, Canada, 137–154. [ Links ]
Lane D. A., 1989. The fate of polycyclic aromatic compounds in the atmosphere and during sampling. In: Chemical analysis of Polycyclic Aromatic Compounds (T. Vo–Dinh, Ed.), Wiley, New York, 31–58. [ Links ]
Li C. K. and R. M. Kamens, 1993. The use of polycyclic aromatic hydrocarbons as source signatures in receptor modeling. Atmos. Environ. 27, 523–532. [ Links ]
Li J., G. Zhang, X. D. Li, S. H. Qi, G. Q. Liu and X. Z. Peng, 2006. Source seasonality of polycyclic aromatic hydrocarbons (PAHs) in a subtropical city, Guangzhou, South China. Sci. Total Environ. 355, 145–155. [ Links ]
Lin C. H., G. A. Ayoko and L. Morawska, 2006. Effect of fuel composition and engine operating conditions on PAH emission from a fleet of heavy duty diesel buses. Atmos. Environ. 39, 7836–7848. [ Links ]
Ludykar D., R. Westerholm and J. Almen, 1999. Cold start emissions at +22, –7 and –20 degrees C ambient temperatures from a three–way catalyst (TWC) car: regulated and unregulated exhaust components. Sci. Total Environ. 235, 65–69. [ Links ]
Marr L. C., T. W. Kirchstetter and R. A. Hartey, 1999. Characterization of PAHs in motor vehicle fuels and exhaust emissions. Environ. Sci. Technol. 33, 3091–3099. [ Links ]
Masclet P., G. Mouvier and K. Nikolaou, 1986. Relative decay index and sources of polycyclic aromatic hydrocarbons. Atmos. Environ. 20, 439–446. [ Links ]
Menichini E., F. Monfredini and F. Merli, 1999. The temporal variability of the profile of carcinogenic polycyclic aromatic hydrocarbons in urban air: A study in a medium traffic area in Rome, 1993–1998. Atmos. Environ. 33, 3739–3750. [ Links ]
Menzie C. A., B. B. Potoki and J. Santadonato, 1992. Exposure to carcinogenic PAHs in the environment. Environ. Sci. Technol. 26, 1278–1284. [ Links ]
Migaszewski Z. M. 1999. Determining organic compound ratios in soils and vegetation of the Holy Cross MTS, Poland. Water, Air Soil Poll. III, 123–138. [ Links ]
Miguel A. H., T. W. Kirchstetter, R. B. Harley and R. A. Hering, 1998. On–road emissions of particulate polycyclic aromatic hydrocarbons and black carbon from gasoline and diesel vehicles. Environ. Sci. Technol. 32, 450–455. [ Links ]
Mohan Rao A. M., R. Rajgopalan, M. H. Doshi and K. G. Vohra, 1983. Measurement of benzo(a)pyrene in the ambient air for estimation of carcinogenic risk. Sci. Total Environ. 27, 33–42. [ Links ]
NAAQS, 1994. National Ambient Air Quality Standards, Central Pollution Control Board, Delhi, India. [ Links ]
NAAQMS (2006). National Ambient Air Quality Monitoring Series: NAAQMS/28/2006–2007. Urban air monitoring: A case study in Agra 2002–2006. Central Pollution Control Board, India. [ Links ]
NEERI, 2006. Ambient air quality status for ten cities of India. Report (1991–2005). National Environmental Engineering Research Institute, Nagpur. [ Links ]
Nielson T., H. E. Jorgensen, J. C. Larsen and M. Poulsen, 1996. City air pollution of polycyclic aromatic hydrocarbons and other mutagens: occurrence, sources and health effects. Sci.Total Environ. 189–190, 41–49. [ Links ]
Okuda T., N. Daisuki, T. Masaki, S. Tanaka, H. Kebin, Y. Ma, F. Yang, Y. Lei, Y. Jia and D. Zhang, 2006. Polycyclic aromatic hydrocarbons (PAHs) in the aerosol in Beijing, China, measured by aminopropylsilane chemically–bonded stationary–phase column chromatography and HPLC/fluorescence detection. Chemosphere 65, 427–435. [ Links ]
Omar N. Y. M. J., M. Abas, R. Bin, K. Kamal Aziz and T. Norhayati Mohd, 2002. Concentrations of PAHs in the atmospheric particles (PM–10) and roadside particles collected in Kuala Lumpur, Malaysia. Atmos. Environ. 36, 247–254 [ Links ]
Pandey P. K., K. S. Patel and J. Lenicek, 1999. Polycyclic aromatic hydrocarbons: need for assessment of health risks in India? Study of an urban–industrial location in India. Environ. Monit. Assess. 59, 287–319. [ Links ]
Pandit G. G., S. Sharma, A. M. Mohan Rao and T. M. Krishnamoorthy, 1996. Chromatographic methods for the estimation of polycyclic aromatic hydrocarbons in atmospheric particulates. 5th National Symposium on Environment, Calcutta, India, 8 Feb. 28– 1 March, 133–136. [ Links ]
Pandya G. H., N. Chatterjee, R. Singh, S. Kashyap, S. Pentu Saheb and S. R. Wate, 2009. Assaying baseline status of particulate laden polyaromatic hydrocarbon for a grass root level industrial project. Bull. Environ. Contam. Toxicol. 82, 185–188. [ Links ]
Park S. S., Y. J. Kim and C. H. Kang, 2002. Atmospheric polycyclic aromatic hydrocarbons in Seoul, Korea. Atmos. Environ. 36, 2917–2924. [ Links ]
Parmar R. S., G. S. Satsangi, M. Kumari, A. Lakhani, S. S. Srivastava and S. Prakash, 2001. Study of size distribution of atmospheric aerosol at Agra. Atmos. Environ. 35, 693–702. [ Links ]
Pereira Netto A. D., I. F. Cunha, F. C. Muniz and E. C. P. Rego, 2004. Polycyclic aromatic hydrocarbons in street dust of Niteroi City, RJ, Brazil. Bull. Environ. Contam. Toxicol. 72, 829–835. [ Links ]
Raiyani C. V., J. P. Jani, N. M. Desai J. A. Shaha and S. K. Kashyap, 1993. Assessment of indoor exposure to polycyclic aromatic hydrocarbons for urban poor using various types of cooking fuel. Indian J. Environ. Protec. 50, 757–763. [ Links ]
Rajput N. and A. Lakhani, 2009. PAHs and their carcinogenic potencies in diesel fuel and diesel generator exhaust. Human and Ecological Risk Assessment 15, 201–213. [ Links ]
Rogge W. F., L. Hildemann, M. A. Mazurek, G. R. Cass and B. R. T. Simoneit, 1993. Sources of fine organic aerosol: Non–catalyst and catalyst equipped automobiles and heavy duty diesel trucks. Environ. Sci. Technol. 27, 636–651. [ Links ]
RTO2008. Road Traffic Office. Transport Nagar Agra, India. Personal communication. [ Links ]
Saksena S., 1999. Integrated exposure assessment of airborne pollutants in an urban community using biomass and kerosene cooking fuels. Ph. D. Thesis, Centre for Environmental Science and Engineering, Indian Institute of Technology, Bombay, 220 pp. [ Links ]
Sanderson E. G., A. Raqbi, A. Vyskocil and J. P. Farant, 2004. Comparison of particulate polycyclic aromatic hydrocarbon profiles in different regions of Canada. Atmos. Environ. 38, 3417–3429. [ Links ]
Saxena A., 1992. Studies on chemistry of dry, wet and bulk deposition at Agra. Ph.D. Thesis, Dayalbagh Educational Institute, Dayalbagh, Agra, India, 150 pp. [ Links ]
Saxena A., U. C. Kulshrestha, N. Kumar, K. M. Kumari, S. Prakash and S. S. Srivastava, 1996. Characterisation of precipitation at Agra. Atmos. Environ. 30, 3405–3412. [ Links ]
Shankar R. V., 1990. Characterization of atmospheric polynuclear aromatic hydrocarbons with special reference to automobile exhaust PhD Thesis. New Delhi, Jawaharlal Nehru University. 112 pp. [ Links ]
Sicre M.A., J. C. Marty, A. Saliot, X. Aparicio, J. Grimalt and J. Albaiges 1987. Aliphatic and aromatic hydrocarbons in different sized aerosols over the Mediterranean Sea: occurrence and origin. Atmos. Environ. 21, 2247–2259. [ Links ]
Simick M. F., H. Zhang, S. J. Eisenreich and T. P. Franz, 1997. Urban contamination of Chicago/coastal Lake Michigan atmosphere by PCBs and PAHs during AEOLOS. Environ. Sci. Technol. 31, 2141–2147. [ Links ]
Simoneit B. R. T., G. Sheng, X. Chen, J. Fu, J. Zhang and Y. Xu, 1991. Molecular marker study of extractable organic matter in aerosols from urban areas of China. Atmos. Environ. 25, 2111–2129. [ Links ]
Smith D. J. T. and R. M. Harrison, 1996. Concentrations, trends and vehicle source profile of polycyclic aromatic hydrocarbons in the UK atmosphere. Atmos. Environ. 30, 2513–2525. [ Links ]
Tavares M. J., P. Pinto, A. L. Souza, L. S. Scarminio and M. C. Solci, 2004. Emission of polycyclic aromatic hydrocarbons from diesel engine in a bus station, Londrina, Brazil. Atmos. Environ. 38, 5039–5044. [ Links ]
Tsapakis M. and E. G. Stephanou, 2002. Collection of gas and particle semi–volatile organic compounds: use of an oxidant denuder to minimize polycyclic aromatic hydrocarbons degradation during high–volume air sampling. Atmos. Environ. 37, 4935–4944. [ Links ]
Tsapakis M. and E. G. Stephanou, 2005. Occurrence of gaseous and particulate polycyclic aromatic hydrocarbons in the urban atmosphere: study of sources and ambient temperature effect on the gas/particle concentration and distribution. Environ. Pollut. 133, 147–156. [ Links ]
Vaishali R., K. M. Phadke, R. Thakre and M. Z. Hasan, 1997. PAHs in respirable particulate matter of Nagpur city air. J. Indian Assoc. Environ. Manag. 24, 11–16. [ Links ]
Valerio F. and M. Pala, 1991. Effects of temperature on the concentration of polycyclic aromatic hydrocarbons (PAHs) adsorbed onto airborne particulates. Fresen. J. Anal. Chem. 339, 777–779. [ Links ]
Vasconcellos Pierola C., D. Zacariasa, A. F. Piresa Maria, S. Poolb Cristina and R. F. Carvalho Lilian, 2003. Masurements of polycyclic aromatic hydrocarbons in airborne particles from the metropolitan area of Sao Paulo City, Brazil. Atmos. Environ. 37, 3009–3018. [ Links ]
Venkataraman C., J. M. Lyons and S. Fiedlander, 1994. Size distribution of aromatic hydrocarbons and elemental carbon. Sampling, measurement methods and source characterization. Environ. Sci. Technol. 28, 555–562. [ Links ]
Venkataraman C., T. Salimol and P. Kulkarni, 1999. Size distributions of polycyclic aromatic hydrocarbons– gas/particle partitioning to urban aerosols. J. Aerosol Sci. 30, 759–770. [ Links ]
Wingfors H., A. Sjodin, P. Hagland and E. Brorstom–Lunden, 2001. Characterization and determination of profiles of polycyclic aromatic hydrocarbons in traffic tunnel in Gothenburg, Sweden. Atmos. Environ. 35, 6361–6369. [ Links ]

