


Servicios Personalizados
Revista
Articulo
 Inglés (pdf)
 Artículo en XML
 Referencias del artículo
 Enviar artículo por email
Indicadores
-
 Citado por SciELO
 -
 Accesos
Links relacionados
-
 Similares en
SciELO
Similares en
SciELO
Compartir

 Permalink
Atmósfera
versión impresa ISSN 0187-6236
Atmósfera vol.23 no.1 Ciudad de México ene. 2010
Simulation of high impact convective events over Indian region by ARPS model with assimilation of Doppler Weather Radar radial velocity and reflectivity
KULDEEP SRIVASTAVA, S. K. ROY BHOWMIK, S. SEN ROY
India Meteorological Department, Lodi Road, New Delhi–110003, India
Corresponding author: S. K. Roy Bhowmik; e–mail: skrb.imd@gmail.com
S. B. THAMPI
Cyclone Detection Radar, Regional Meteorological Center
India Meteorological Department. Rajaji Salai, Chennai 600 001, India
Y. K. REDDY
Cyclone Detection Radar, India Meteorological Department, Machilipatanam, India
Received January 7, 2008; Accepted November 8, 2009
RESUMEN
En este trabajo se determina el impacto de la asimilación de datos del radar meteorológico hindú (DWR) por medio del sistema meteorológico de predicción numérica (ARPS) a una resolución horizontal de 9 km. La velocidad radial y las observaciones de reflectividad de dos estaciones DWR, Chennai (Lat. 13.0° N, Long. 80.0° E) y Machilipatnam (Lat. 16.5° N, Long. 81.3° E) se asimilan utilizando el sistema de asimilación de datos (ADAS) ARPS y el esquema de análisis de nubosidad del modelo. Se seleccionaron dos casos de estudio, 1) el ciclón tropical Ogni de octubre de 2006 en la Bahía de Bengala, y 2) la tormenta eléctrica local del 5 de junio de 2009 sobre parte del suroeste de la India. El estudio muestra que el modelo a una resolución de 9 km con la asimilación de observaciones DWR de Chennai, pudo simular características de mesoescala como: número de células, estructura de la banda de lluvia espiral, localización del centro, fortalecimieno de los vientos troposféricos bajos y el movimiento hacia el norte de la pequeña tormenta ciclónica, tanto en el análisis como en el pronóstico. El modelo con la asimilación de DWR pudo retener la intensidad del ciclón hasta las seis horas de pronóstico. Después de esto el ciclón se debilitó al alejarse del sitio del radar. En el caso de la tormenta eléctrica, el modelo con la asimilación DWR pudo capturar la precipitación convectiva en la localización correcta. La asimilación DWR pudo reproducir de manera realista el proceso de desarrollo y el movimiento hacia el sur de las células de la tormenta.
ABSTRACT
In this paper, impact of assimilation of Indian Doppler Weather Radar (DWR) data has been assessed by numerical weather prediction system (ARPS) at 9 km horizontal resolution. The radial velocity and reflectivity observations from two DWR stations namely, Chennai (Lat. 13.0° N and Long. 80.0° E) and Machilipatnam (Lat. 16.5° N and Long. 81.3° E) are assimilated using the ARPS Data Assimilation System (ADAS) and cloud analysis scheme of the model. Two case studies selected are 1) Bay of Bengal Tropical Cyclone Ogni of October 2006 and 2) A local thunderstorm event of 5 June 2009 over the southeast parts of India. The study shows that the model at 9 km resolution with the assimilation of DWR observations (Chennai) could simulate mesoscale features suchas: number of cells, spiral rain band structure, location of the center, strengthening of the lower tropospheric winds and northerly movement of the small size cyclonic storm in the analysis as well as in the forecasts. The model with DWR assimilation could retain the intensity of the cyclone up to 6 hours of forecasts. Thereafter the cyclone showed a weakening trend when it was drifting away from the radar site. In case of thunderstorm, the model with the DWR assimilation could capture the convective precipitation in the right location. The DWR assimilation could realistically reproduce the development process and south–westward movement of thunderstorm cells.
Keywords: Radial wind, reflectivity, ADAS, cloud analysis, cyclone, thunderstorm.
1. Introduction
A convective heavy rainfall event is one of the most disastrous weather phenomena affecting a large population and of common interest for tropical countries. Accurate forecast of these events are crucial for the early warning system. For the realistic prediction of these events, there is a need for a very high resolution non–hydrostatic numerical weather prediction model, with sophisticated data assimilation strategies for ingesting new data of higher temporal and spatial density. It must be capable to handle atmospheric phenomena ranging from regional scales down to microscales, as interactions across this spectrum have strong impacts on storm scale phenomena.
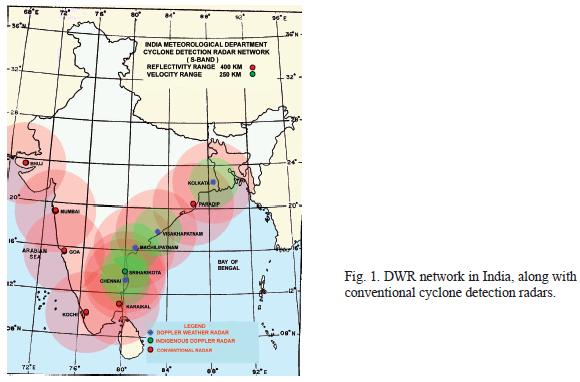
For the mesoscale modeling, determination of the three dimensional (3D) wind and thermo–dynamic fields is an essential task. The most important source of volumetric information on meso–scale in the current operational observing system is the Doppler Weather Radar (DWR). The installation of four Gematronic Meteor 1500S model DWR at Chennai during the year 2002, Kolkata (2003), Machilipatanam (2004) and Vishakhapattnam (2006) has heightened the prospects for the operational implementation of numerical model to explicitly predict the evolution of mesoscale phenomena. Figure 1 presents the location of these DWRs along the east coast of India. The DWR scans with beam width of 1° creates 360 beams radials of information per elevation angle. This provides high resolution measurement of radial velocity and velocity spectrum width to ranges of 250 km and of reflectivity to ranges of 300 km. Observational studies based on the Indian DWR data are reported by several authors (Sinha and Pradhan, 2006; Suresh, 2007; etc.).
Realizing the importance of DWR observations in mesoscale and microscale weather analysis and forecasting, Das et al. (2006) attempted to study the impact of retrieved wind fields from single Doppler radar (Kolkata) for simulation of pre–monsoon convective events over India by MM5 model using three dimensional variational (3 DVAR) data assimilation. Xiao et al. (2005, 2007) carried out a study on the assimilation of DWR radial wind and reflectivity into MM5 model using the 3 DVAR system for the heavy rainfall events over South Korea region. A number of case studies on the positive impact of DWR radial wind and reflectivity observations in the assimilation cycle of Advanced Regional Prediction System (ARPS) were documented by Xue et al. (2003). For the mesoscale modelling, ARPS is an entirely new three dimensional non–hydrostatic model known to handle storm scale weather phenomena. It is a comprehensive multi–scale prediction system formulated in generalized terrain following coordinates that include data ingests quality control, objective analysis package, DWR parameter retrieval and data assimilation procedure (Xue et al., 2003). From the results of several experiments of thunderstorm events over central United States of America (USA) with the use of DWR observations, Xue et al. (2003) concluded that the assimilation of the data had a significant positive impact on the forecast. According to the study, tornado outbreak of January 2003 over central USA was successfully predicted 8 hours in advance.
The main interest in this study is to ingest radial wind and reflectivity observations of Indian DWR in the assimilation cycle of ARPS (version 5.2.5) at 9 km horizontal resolution and demonstrate its impact in the analysis and forecast for simulation of severe convective events over Indian region. This is a new study of this kind carried out for Indian region focusing impact of radar radial velocity and reflectivity observations in a numerical weather prediction system. In an earlier study (Das et al., 2006), wind fields derived from DWR radial wind applying Uniform Wind Technique (UWT) were used in the assimilation cycle of MM5 model for simulation of pre–monsoon convective events over India. The limitation of the UWT technique is that, due to the simple spatial dependence assumed for the wind field, it fails when the wind field is complex (Waldteufel and Corbin, 1979).
2. Current features of the ARPS
The ARPS consist of four principal components: a) programs to remap and super–ob the radar and satellite data to the analysis grid, b) ARPS Data Assimilation System (ADAS) for analyzing all kinds of meteorological observations, c) a cloud and hydrometer analysis which applies diabatic adjustments to the temperature field and d) a non–hydrostatic forecast model. The assimilation can be performed as a sequence of intermittent cycles. Also, an incremental analysis update procedure (IAU) can be employed in which the analysis increments is applied to the model state gradually over a period of time. The salient features of the ARPS version 5.2.5 are documented by Xue et al., 2003.
Early work on single Doppler velocity retrieval (SDVR) focused on the velocity azimuth display (VAD) and volume velocity processing (VCP) methods (Waldteufel and Corbin, 1979) of analysis, where radial velocity measurements were fit to a single linear wind model. The method for retrieval horizontal wind fields from radial velocity measurements of single site radar under the assumption of linear wind model is called UWT. The wind field derived from this technique is valid at constant or small elevation angles close to the radar site.
The success of the numerical predictions depends on the quality of the retrieved fields. Since the radar coverage is incomplete, the retrieved wind field does not cover the entire model domain and contain internal data "holes". Moreover, the retrieved wind field generally does not satisfy mass conservation on the model grid (due to discretization errors associated with the interpolation). Thus it is desirable to "blend" the retrieved wind field with a background wind field and adjust the blended wind field to satisfy mass conservation on the model grid. The ARPS ADAS is equipped with an integrated package for single Doppler velocity and thermodynamic retrieval together with the associated variational procedure as designed by Shapiro et al. (1995). The sequential single Doppler retrieval involves two primary components. The first is a single Doppler velocity retrieval designed to deduce the unobserved crossbeam wind (azimuth and polar components) from a time series of single Doppler observations of reflectivity and radar velocity data. Three additional steps are also included in the procedure: a single algorithm for blending the radar retrieval winds with background winds, a variational adjustment for blending wind fields to satisfy mass conservation and the observed radial velocity on the model grid and a moisture specification step.
With the assimilation of reflectivity observations, a cloud analysis procedure in the ADAS creates three dimensional fields of cloud water, rain–water and improved fields of water vapor and temperature (Zhang et al., 1998). Diagnosis of precipitation area is made from the use of analyzed temperature field and then the hydrometeor mixing ratio is determined utilizing radar reflectivity observations. Direct replacement of the background hydrometeors is done in areas where observed reflectivity is greater than a prescribed threshold (typically 10 dBZ). Precipitation is removed from the background in areas having reflectivity less than the precipitation threshold (within the radar volume coverage). An important aspect of building and maintaining thunderstorm updrafts in a non–hydrostatic model is the inclusion of the effect of latent heat release due to condensation processes in the updraft regions. A moist adiabatic ascent from the analyzed cloud base (with entrainment) is calculated and any excess in this temperature over the analyzed temperature is then added to the analyzed value.
3. Case studies
Two cases selected for the simulation experiments are:
Tropical cyclone Ogni over the Bay of Bengal of October 29–30, 2006
Thunderstorm activity of 5 June 2009 along Andhra Pradesh coast, in the southeast part of India.
Experiments for cyclone Ogni were made with the DWR observations of Chennai (Lat. 13.0° N, Long. 80.0° E) and for the thunderstorm event, observations of DWR Machilipatnam (Lat. 16.5° N, Long. 81.3° E) were used.
3.1 Cyclone Ogni
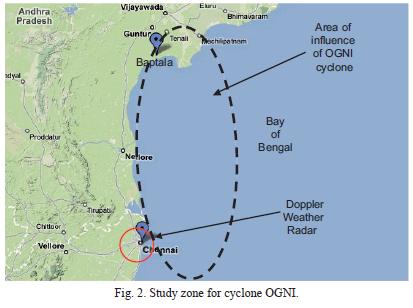
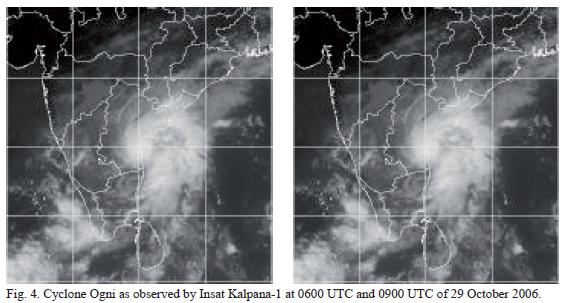
During October 2006, Andhra coast of India was hit by a cyclone named as Ogni. It caused widespread rainfall with scattered heavy to very heavy falls and isolated extremely heavy falls over coastal Andhra Pradesh leading to flood over the region. As a result there were 24 human deaths and heavy loss of property. The area of influence of the cyclone Ogni is shown in Figure 2. This cyclonic storm was very unique in its nature as it had a very small core (100 km diameter) and short life (18 hours). It moved nearly northward over the Bay of Bengal along the coast and weakened into a deep depression before landfall. The system was mainly detected and tracked by Doppler Weather Radar. According to DWR observation at Chennai the vortex was first noticed in radar scope around 08 UTC of 28 October. As it was located very close to the coast it did not travel enough by sea to attain higher intensity. Radar picture taken by DWR Chennai at 0548 UTC and 0848 UTC of 29 October is shown in Figure 3. The DWR observation (reflectivity) of Chennai could distinctly capture the vortex in radar scope. Figure 4 displays Indian satellite (Kalpana I) imageries at 0600 UTC and 0900 UTC of 29 October 2006. The organization of mesoscale convection over the region is clearly depicted. The observed track of the system as reported by India Meteorological Department is given in Figure 5. The system was moving parallel to the coast, before the landfall. The three hourly observed track positions, estimated central pressure, maximum sustained wind, and pressure drop etc., as reported by India Meteorological Department, are given in Table I.
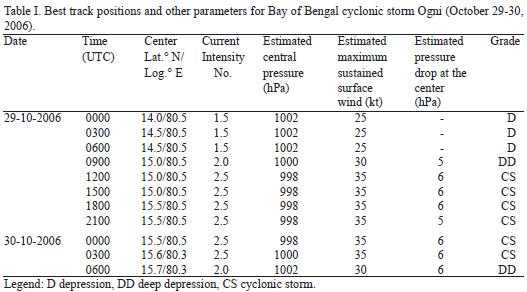
According to the report documented by Hatwar et al. (2008), a low pressure area formed over west–central Bay of Bengal off Andhra Pradesh coast in the evening of 28 October 2006. It intensified into a depression and lay centered near Lat. 14° N/Long. 80.5° E in the morning of 29. While moving slowly in a northerly direction it intensified into a deep depression and lay centered near Lat. 15° N/80.5° E in the afternoon of the same day. The system further intensified into a cyclonic storm in the evening of 29 October. The system moved slightly northward and its movement was very slow till the morning of 30 October. It lay centered near Lat. 19.5° N/Long. 83.5° E at 0000 UTC of October 3 0, 2006. The cyclonic storm moved northwestward and crossed the coast as deep depression around noon of October 30, 2006. After crossing the coast, the system weakened into a depression in the afternoon of same day. The depression further weakened into a low pressure areaover north Andhra Pradesh and adjoining areas in the evening of October 30, 2006. As the system was a small core system, the coastal winds at lower levels were not very strong with wind speed being 20 knots at 850 hPa level at 00 UTC of 28 October. The coastal winds suggested gradual intensification of the system from 00 UTC to 1200 UTC of 29 October and weakening of the system from 0000 UTC of 30 October. However, associated cyclonic circulation (in the operational synoptic weather chart) extended up to mid–tropospheric level till morning of 30 October. The steering wind at 200 hPa level at 0000 UTC of 29 October suggested quasi–stationary slow northward movement, as it lay close to the ridge line at 200 hPa. The system remained practically stationary or with very slow movement at nearly northerly direction throughout its life, covering 135 km in 24 hours.
The size of the cyclone was so small (diameter 100 km) that the system could not be predicted by any of the operational Numerical Weather Prediction (NWP) models (Hatwar et al., 2008). It poses a challenge to the NWP modeling community to predict such a small core and short lived high impact weather system.
3.1.1 Data sources and methodology
The scan strategy of 10 minutes scan was applied to obtain DWR observations. This scan strategy was optimized, taking into account the limitations of the radar hardware and the meteorological requirement of sampling frequency for convective events over the Indian region. An interface software is developed (Sen Roy et al., 2009) to convert the data files (raw data) in VOL format (proprietary Rainbow format of Gematronik Corporation) to a non–proprietary open source NETCDF format. This program also separates the volume scanned data into separate files for each elevation angle to simulate the Nexrad scanning strategy. For quality control of these raw data before ingesting into the rapid updates assimilation cycle of ADAS, application software (Lakshmanan et al., 2006) called Warning Decision Software Integrated Information (WDSSII) is used.
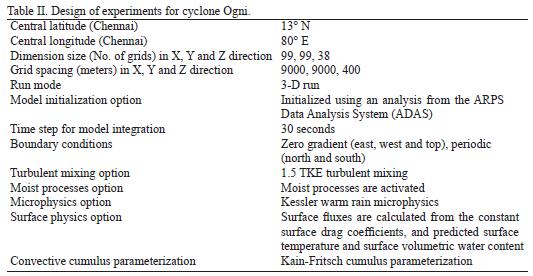
As the formation and intensification process of the low pressure system took place within the radar range of Chennai, it provided a unique opportunity to study the impact of DWR observation in a mesoscale model for simulation of a land falling cyclone. The domain selected for the model run is shown in Figure 6. The size of the domain is 901 x 901 km with 9 km grid spacing and Chennai is kept at the center of the domain. The vertical grid stretched from 20 m at the surface to about 400 m at the model top which is located at about 15 km height. The design details of the experiment are shown in Table II. The model ARPS (version 5.2.5) is run at the horizontal resolution of 9 km. Background and boundary conditions are obtained from the National Center for Environmental Prediction Global Forecast System (NCEP GFS) freely available in the Internet at the resolution of 1 x 1° Lat./Long. The NCEP GFS fields are interpolated for ADAS grid at 9 km resolution. Half hourly intermittent assimilation cycles are performed within 3 hours assimilation window from 0000 to 0300 UTC. The life cycle used for the IAU assimilation window is 30 minutes. Two sets of numerical experiments are conducted. In the first experiment (termed as "control" run), the model is run without ingesting the DWR observations in the assimilation cycle. In the second experiments (termed as "dwr" run), DWR radial wind and reflectivity observations are ingested in the model assimilation cycle. For that, DWR observations are first pre–processed to convert them into the desired format of model assimilation. Then radial velocity data are analyzed using ADAS, while reflectivity data are used through the cloud analysis procedure. The temperature adjustment scheme based on the moist adiabatic temperature profile is used in the cloud analysis scheme. Figure 7 shows the 3 hours assimilation window and then 21 hours forward forecasts (valid up to 00 UTC of 30 October 2006).
3.1.2 Discussion of results
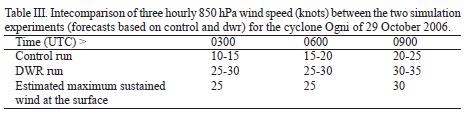
The model simulated wind fields at 850 hPa with superimposed vorticity fields for the control run and dwr run at 3 hourly intervals starting from 0000 UTC of 29 October are illustrated in Figure 8. The left column in the figure indicates results of control experiment and figure in the right column shows results of dwr experiments. At 0000 UTC of 29 October when the depression lay over the sea near Lat 14° N/Long 80.5° E, both control and dwr experiments show the system over the land near Lat. 14.1° N/ Long. 79.5° E. The control run shows a very weak circulation. Where as corresponding dwr run could produce strong south–south–easterly winds of order 30 knots to the south east sector of the system. It is very interesting to notice that at 0300 UTC in the dwr simulation the system lay over the Sea (Bay of Bengal), very close to the observed position. The simulation could reproduce strong winds of order 30 knots around the depression center at 850 hPa. The system is seen as a very small core system with a strong vorticity field occurring at its center. Where as the control run continued to show the system as weak circulation. However, with the ADAS procedure, the location of the system is found to be shifted to the east near the observed position. At 0600 UTC, the dwr simulation continues to depict strong winds over a small area around the center of the system and a strong vorticity field near the center. The corresponding control experiments maintain the system as a weak circulation. Table III presents a quantitative inter–comparison of results between the two experiments. Control run shows wind speed (at 850 hPa) of order 10 to 25 knots during 0300 to 0900 UTC. The dwr run indicates wind speed of order 25 to 35 knots during the above period, against the estimated maximum sustained wind at the surface of order 25 to 30 knots. In the dwr experiments, the lower tropospheric southerly wind around the storm center is found to be increased by 10 to 25 knots in the analysis and as well as in the forecasts. Though dwr slightly overestimated the wind speed, the magnitude has been closer to the observed values. These results clearly demonstrated the superiority of the forecasts (up to 0900 UTC) when DWR observations are assimilated. The dwr experiments could simulate realistically the strong wind and vorticity fields at 850 hPa over a small domain close to the center of the system. The stronger cyclonic vortex with strong southwesterly oceanic convergence to the vortex arises mainly due to wind vector from the DWR. Till 0900 UTC, the dwr simulation retained intensity of the system (strong wind and vorticity fields). But thereafter the cyclone showed a weakening trend in the forecast when the system was moving northwards and drifting away from the radar site.
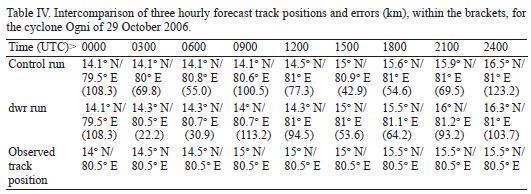
An intercomparison between observed and predicted tracks (in the dwr run) of the system is shown in Figure 9. Table IV presents quantitative intercomparison forecast track errors between the two experiments. In the control run forecast track error ranges between 42 to 123 km, where as in the dwr experiment forecast error is found to be between 22 to 113 km. The forecast errors have been considerably less (22 to 30 knots) up to 6 hours of forecast in the dwr run. The model with DWR assimilation could retain the minimum track position errors up to 6 hours of forecasts. Thereafter the forecast errors started increasing, when the cyclone was moving away from the radar site.
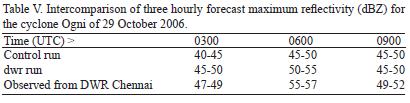
In order to investigate the impact of DWR observations in the analysis and forecasts of reflectivity (dBZ), we also present a comparison of the simulated reflectivity fields from control and dwr experiments in Figure 10. A quantitative intercomparison of dBZ between the dwr run and control run is presented in Table V. It can be seen that the dwr simulated reflectivity pattern could reproduce reflectivity (dBZ) in the order 45 to 50 along the area of wall cloud zone. The magnitude was relatively less in the control run. The convective cell first developed over the wall cloud zone. The region of highest reflectivity also matches well with the 850 hPa wind pattern. Like wind and vorticity fields, the dwr run could maintain the intensity of reflectivity up to 6 hours forecast. Thereafter the dwr simulation shows a weakening trend of the system and hardly any difference is noticed in the reflectivity fields between the dwr and control runs after 12 hours of forecast, when the cyclone was away from the radar site.
The above results showed that the model with DWR assimilation could retain the intensity of the cyclone as well as the minimum track position errors during the early forecast hours, when the cyclone was closer to the radar site. Thereafter, errors in terms of intensity and track position showed an increasing trend. This might have resulted due to the dominance of the large scale features present in the initial fields (NCEP GFS) over the local features due to DWR observations, with the progress of time integration of the model. Moreover, the cyclone was drifting away to the north from the radar location with the progress of model integration. The intercomparison of results between the control and dwr runs very clearly demonstrated the positive impact of assimilation of DWR observation to predict the intensity and the track of this small core tropical cyclone.
3.2 Thunderstorm event
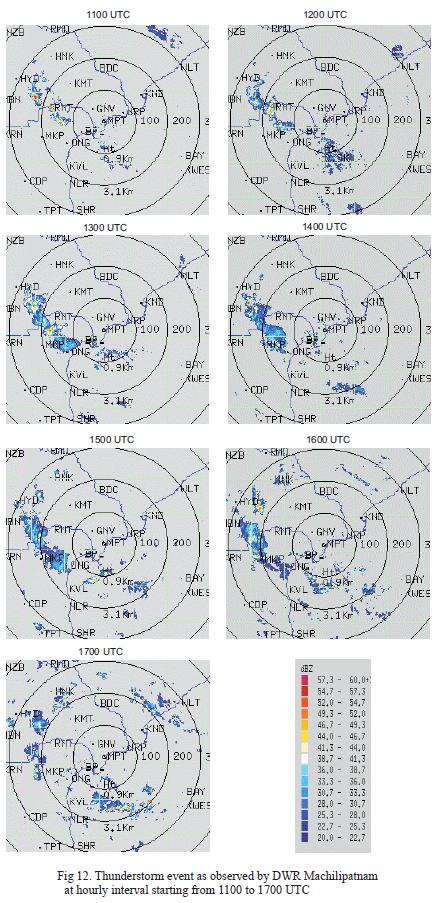
On 5 June 2009, the initial development of the thunderstorm cell was observed as southwest oriented radar echo at 1100 UTC along coastal Andhra Pradesh (Fig. 11), which became well developed at around 1300 UTC. It gradually moved southwestward and subsequently dissipated at around 1700 UTC. Figure 12 depicts the observed reflectivity (dBZ) of DWR Machilipatnam at an hourly interval starting from 1100 to 1700 UTC of 5 June.
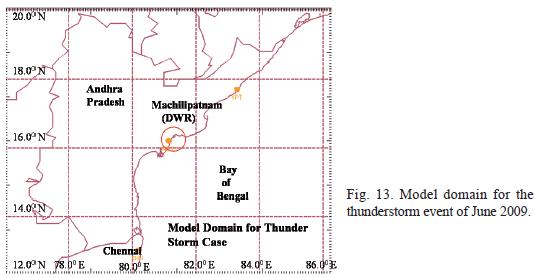
In this case, in one experiment, the model is run using GFS initial conditions without assimilation of DWR, which is termed as control run. In the second experiment, the model is run using Doppler radar data in the ARPS Data Assimilation System. In the experiment, a 6 hours ARPS forecast is conducted with the initial condition at 1200 UTC, incorporating the Kessler warm rain microphysics (WARMRA) and the Kain–Fritsch cumulus parametization sheme (Kain and Fritsch, 1993) and making use of DWR observations of Michilipatnam in the half hourly assimilation cycle for the window 1100–1200 UTC. The model domain (Fig.13) covers a 500 x 500 km2 area with grid spacing pf 9 km. The radar site Michilipatnam is kept at the center of the model domain. The first–guess is interpolated from NCEP GFS. The model run is for 6 hours forecast.
3.2.1 Discussion of results
The rectangular box in Figure 14 (a, b) presents an intercomparison between analyzed 850 hPa reflectivity fields of control and dwr runs valid at 1200 UTC. At 1200 UTC 5 June, three small mesocells are observed by the DWR station (Fig. 12). The observed maximum reflectivity is of the order of 50 dBZ. In the observation one patch is also observed over the Bay of Bengal. The analyzed reflectivity in control run exhibits reasonable structures of the storm between Hyderabad and Ongole as a weak echo. Maximum reflectivity in this case is of the order 30 dBZ. The analysis reflectivity with assimilation of DWR data shows three mesocells. Another patch is also found over the Bay of Bengal. In this case, the storm rain band structure and position is nearly matching with the observed one. Maximum reflectivity in this case noted to be 45 dBZ which is very close to observed one. The analysis field is found to be nearly realistic.
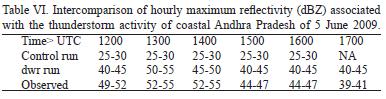
Hourly forecast fields of 850 hPa reflectivity staring from 1300 to 1700 UTC with the initial condition of 1200 UTC are presented in Figs. 15 to 19 (Figure 15, 16, 17, 18 and 19). An quantitative intercomparison of dBZ between dwr and control runs against the observed value for the thunderstorm event of coastal Andhra Pradesh is presented in Table VI. In the control run dBZ values have been considerable less (25 to 30 dBZ), compared to the observed value of order 40 to 45 dBZ. The magnitude of the observed dBZ has been closer to that of dwr run values. At 1300 UTC 5 June, the observation (Fig. 12) exhibits a well organized mature stage thunderstorm. Its intensity (55 dBZ) as well as the horizontal extension is found to be increased considerably. The one hour forecast (Fig. 15) in the control run valid at 1300 UTC could retain a horizontal pattern of weak reflectivity and southwestward movement, but failed to show any development. While in the dwr run, the model with DWR assimilation could realistically capture northwest and southeast oriented well organized thunderstorm cells. Maximum predicted reflectivity has been 55 dBZ which is nearly close to the observed one. Southwestward movement also resembles nearly close to the observation.
At 1400 UTC thunderstorm moved southwestward and showed a decaying tendency (Fig. 12). In the control run for two hour forecast (Fig. 16) the movement of the system is similar to the observed one, but it failed to capture the decaying trend. While in case of dwr run, the model could capture movement as well as the decaying trend more realistically.
At 1500 UTC, results of both the experiments (Fig. 17) indicated a southwestward movement of the system without any intensity change from the previous hour. The dwr run rightly indicated an intensification of cells over the Bay of Bengal.
At 1600 UTC, dwr run (Fig. 18) could correctly indicate dissipating stage of the system. But both the runs (dwr as well as control) failed to indicate the genesis of new cells over the northwest sector near Hyderabad.
At 1700 UTC observation shows dissipation of thunderstorm (Fig. 19) over the land. The dwr run could realistically simulate the development process of the thunder cell over the Bay of Bengal.
The 6 hourly accumulated rainfall between 1200 to 1800 UTC as estimated by Tropical Rainfall Monitoring Mission (TRMM) and corresponding to the predicted rainfall by dwr run is shown in Figure 20. The predicted rainfall is found to be very close to the observed (TRMM) rainfall in terms of spatial pattern and magnitude. The dwr run could capture the heavy rainfall peaks (of order 7 cm) nearly at the right position.
4. Conclusions
The main objective of this study was to ingest the radial velocity and reflectivity observations of Indian DWR in the assimilation cycle of the storm scale NWP system (ARPS) to examine impact of new observations in the analysis and forecasts of severe convective events over the Indian region. This task has been successfully accomplished.
The study shows that the model at 9 km resolution with the assimilation of DWR observations (Chennai) could simulate this small size cyclonic storm in the analysis and forecasts. However, it is worth to be mentioned that the model with DWR assimilation could retain the intensity as well the minimum track position errors of the cyclone up to 6 hours of forecasts. Thereafter it shows a weakening trend, underestimation of the intensity and increased position errors. Perhaps these arises due to the dominance of the large scale characteristics over the local features present in the initial fields (NCEP GFS) with the progress of time integration. Moreover, the cyclone was drifting away to the north from the radar location.
In the case of thunderstorm, the model with the DWR assimilation could successfully capture the convective precipitation in the area of occurrence. The general behavior and evaluation of predicted the thunderstorm agreed very well with the corresponding observation.
Definitely, the results are very promising, particularly in the very short range forecast scale. However, these results being preliminary, require further investigation for a variety of different storm types and with single Doppler retrieval as well as dual Doppler retrieval algorithms utilizing observations from a good network of DWR.
In the near future, India Meteorological Department (IMD) is going to install a good network of DWR. The present work not only affirms the validity of the direction taken by NWP group of IMD to utilize these new and important observations in the storm scale NWP model but also demonstrates the process of capacity building to transform research to operation.
Acknowledgement
The study was initiated as a part of a collaborative work under the GOI–USAID project on Climate Forecasting System. Authors are indebted to the Center for Atmospheric Prediction of Storms (CAPS) of Oklahoma University, especially to Dr. M. Xue, Dr. J. GAO and Dr. K. Brewster for the technical support. Authors are grateful to Dr. A. Tyagi, Director General of Meteorology of IMD, for his encouragement and keen interest in this work. Thanks are also due to the radar unit at the H/Q of IMD for all cooperation to carry out this work. Authors like to express gratitude to the anonymous reviewers for their valuable suggestions to improve the quality of the paper.
References
Das S., S. Abhilash, M. Das Gupta, J. P. George, S. R. Kalsi, S. K. Banerjee, B. S. Thampi, D. Pradhan and K. Mohankumar, 2006. Assimilation of Doppler weather radar wind in amesoscale model and their impact on simulation of thunderstorms and severe weather systems. Report No. MMRF/RR/01/2006, 120 pp, published by NCMRWF, A–50 Institutional Area, Sector 62, Noida, India 201307. [ Links ]
Hatwar H. R., V. Subrahmanyam, M. Mohapatra, S. K. Roy Bhowmik, B. K. Bandyopadhay, Ch. Singh and K. Srivastava, 2008. A report on the cyclonic storm "Ogni" 2006, 2008. India Meteorological Department, Meteorological Monograph, Cyclone Warning Division 2/2008, 73 pp. [ Links ]
Kain J. S. and Fritsch J. M., 1993. Convective parameterization for mesoscale models: The Kain–Fritsch scheme. The representation of cumulus convection in numerical models. Meteor. Monogr. 24, Amer. Meteor. Soc. 165–170. [ Links ]
Lakshmanan V., T. Smith, G. Stumpf and K. D. Hondi, 2006. The warning decision support system integrated information. Weather Forecast. 22, 596–612. [ Links ]
Sen Roy S., V. Lakshmanan, S. K. Roy Bhowmik and S. B. Thampi, 2010. Doppler weather radar based nowcasting of cyclone Ogni. J. Earth Sys. Sci. Accepted. [ Links ]
Shapiro A., S. Ellis and J. Shaw, 1995. Single–Doppler radar retrievals with Phoenix II data: Clear air and microburst wind retrievals in the planetary boundary layer. J. Atmos. Sci. 52, 1265–1287. [ Links ]
Sinha V. and D. Pradhan, 2006. Supercell storm at Kolkata, India and neighborhood. Analysis of thermodynamics conditions, evolution, structure and movement, Indian J. Radio Space 35, 270–279. [ Links ]
Suresh R., 2007. Observations of sea breeze front and its induced convection over Chennai in southern peninsular India using Doppler weather radar. Pure Appl. Geophys. 164, 1511–1525. [ Links ]
Waldteufel, P. and H. Corbin, 1979. On the analysis of single Doppler radar data. J. Appl. Meteorol. 18, 532–542. [ Links ]
Xiao Q., Y. H. Kuo, J. Sun, W. C. Lee, E. Lim, Y. R. Guo and D. M. Barker, 2005. Assimilation of Doppler radar observations with a regional 3 DVAR system: Impact of Doppler velocities on forecast of heavy rainfall case. J. Appl. Meteorol. 44, 768–788. [ Links ]
Xiao Q., Kuo Y. H., Sun, J., Lee W. C., Barker, D. M. and Lim, E., 2007. An approach of radar reflectivity data assimilation and its assessment with the inland QPE of Typhoon Rusa (2002) at landfall. J. Appl. Meteor. Clim. 46, 14–22. [ Links ]
Xue M., D. Wang, J. Gao, K. Brewster and K. K. Droegemeier, 2003. The advanced regional prediction system (ARPS) storm scale numerical weather prediction and data assimilation. Meteorol. Atmos. Phys. 82, 139–170. [ Links ]
Zhang J., F. Carr and K. Brewster, 1998. ADAS cloud analysis, Preprints, 12th Conference on Numerical Weather Prediction. Phoenix, AZ, Amer. Meteor. Soc. Boston, 185–188, [ Links ]

