


Services on Demand
Journal
Article
 English (pdf)
 Article in xml format
 Article references
 Send this article by e-mail
Indicators
-
 Cited by SciELO
 -
 Access statistics
Related links
-
 Similars in
SciELO
Similars in
SciELO
Share

 Permalink
Atmósfera
Print version ISSN 0187-6236
Atmósfera vol.23 n.1 Ciudad de México Jan. 2010
The impact of urbanization on the monthly averaged diurnal cycle in October 2004 in the Pearl River Delta region
W. LIN, B. WANG, J. LI, X. WANG, L. ZENG
School of Environmental Science and Engineering, Sun Yat–sen University, Guangzhou, China
Corresponding author: W. Lin; e–mail: eeslws@mail.sysu.edu.cn
L. YANG, H. LIN
Institute of Space and Earth Information Science, The Chinese University of Hong Kong, Shatin,
New Territories, Hong Kong
Received June 27, 2008; Accepted October 6, 2009
RESUMEN
En el sur de China la región del delta del río Perla (PRD, por sus siglas en inglés) ha experimentado una rápida urbanización y un dramático crecimiento económico en los últimos veinticinco años. Utilizando observaciones meteorológicas idénticas para condiciones de frontera laterales, se realizaron dos simulaciones de un mes: la primera utilizando los datos originales de la cobertura de superficie de 24 categorías del United States Geological Survey (USGS) y la otra con los datos de cobertura de superficie de 2004 de las imágenes de satélite del Moderate Resolution Imaging Spectroradiometer como condiciones de frontera baja en un modelo de mesoescala. Se escogió el mes de octubre de 2004 debido a que no hubo precipitación por corresponder a condiciones de sequía. El valor promedio espacial (promedio del dominio, valor promedio de superficie, valor promedio urbano) utilizado para el análisis puede reflejar el clima regional en un área de cientos de kilómetros. Los resultados de la simulación muestran que la urbanización adicional en la región del PRD incrementa el promedio espacial del ciclo diario de temperatura de superficie, los flujos de calor sensible y la altura de la capa límite planetaria (PBL, por sus siglas en inglés), disminuye la humedad relativa, el vapor de agua en el aire y el flujo de calor latente, e incrementa el rango de temperatura diurno. La simulación también muestra que después de la expansión urbana la intensidad de la isla urbana de calor es de unos 0.4° en la noche y de unos 1.3° en el día.
ABSTRACT
The Pearl River Delta (PRD) region in southern China has experienced rapid urbanization and dramatic economic growth in last 25 years. Using identical observed meteorology for lateral boundary conditions, two one–month simulations were conducted: one using the original United States Geological Survey (USGS) 24–category land cover data (namely NU) and the other using the urban land cover data from 2004 Moderate Resolution Imaging Spectroradiometer (MODIS) satellite images (namely HU) as lower boundary conditions in a mesoscale model. October 2004 was chosen for simulation due to no precipitation in the Pearl River Delta corresponding to drought conditions. The spatially averaged value (domain–averaged, land–averaged value, urban–averaged value) used for the analysis can reflect the regional climate over an area of several hundreds of kilometers. The simulation results show that the additional urbanization in the PRD amplifies the spatially averaged diurnal cycle of surface temperature, sensible heat fluxes and planetary boundary layer (PBL) height, decreases relative humidity, water vapor in the air and latent heat flux, and increases the diurnal temperature range (DTR). The simulation also shows that the urban heat island (UHI) intensity is about 0.4° in the nighttime and about 1.3° in the daytime after the urban expansion.
Keywords: Land cover, mesoscale model, simulation, China.
1. Introduction
Urbanization is a process that traces back to the 1800s (Landsberg, 1981; Oke, 1976). The remarkable characteristics of urbanization are the change of land use, and the concomitant crowding of anthropogenic activity. Conversion of vegetated surfaces to urban hardscapes modifies the exchange of heat, water, trace gases, aerosols, and momentum between the land surface and overlying atmosphere (Foley et al., 2005). These changes imply that urbanization can affect local, regional, and possibly global climate on diurnal, seasonal and long–term scales (Zhou et al., 2004; Kaufmann et al., 2005; Zhang et al., 2005). Evaluation of the impact of urbanization is important for the interpretation of long climate records that are potentially affected by land use change. One of the most noticeable effects of urbanization on atmosphere is the urban heat island (UHI) (Oke, 1976; Wang et al., 1990; Sang et al, 2000; Arnfield, 2003). There is much research aimed at understanding and modeling the complex land–atmosphere interaction in urban areas (Rotach, 1995; Brown, 2000; Grimmond and Oke, 2002). For example, using idealized environments, some studies have been carried out to investigate various aspects of the UHI and urban–induced momentum mixing (Uno et al., 1989; Grimmond and Oke, 2002; Martilli et al., 2002; Dupont et al., 2004). Higher resolution land cover data and improved planetary boundary layer parameterization schemes allow more realistic model simulations on the urbanization and subsequently improve mesoscale numerical model simulations (Chen and Dudhia, 2001; Pielke et al., 2001; Ek et al., 2003; Grossman–Clarke et al., 2005).
In this study, the fifth–generation Pennsylvania State University–National Center for Atmospheric Research (NCAR) nonhydrostatic Mesoscale Model (MM5) (Dudhia, 1993; Grell et al., 1994) was applied to the PRD cities cluster in order to investigate the influence of urban expansions on the monthly averaged diurnal cycle in October 2004. The PRD area is one of the most populated areas of China and contains some of the country's highest concentrations of industry (Cao et al., 2003). More than 50 million people live in this area where the 10 major cities of Hong Kong, Shenzhen, Guangzhou, Macao, Foshan, Huizhou, Jiangmen, Zhongshan, and Zhuhai are located. These cities are interspersed with smaller towns and farms. The PRD region has experienced unprecedented land use/land cover (LULC) changes as a result of policy change and rapid economic development over the last two decades (Yeh and Li, 1997, 1998; Seto et al., 2002; Weng, 2002). The effect of urbanization in the PRD on climate has been reported in the literature. The rise of the winter minimum temperatures in Guangdong province began in the second half of 1960s and the warming has been more evident since the 1980s (Liang and Wu, 1999). Kalnay and Cai (2003)recently introduced a method to estimate the impact of urbanization and other land–use changes on climate by comparing trends in surface temperature recorded by 1982 meteorological stations with those in the National Centers for Environmental Prediction–National Center for Atmospheric Research (NCEP/NCAR) Reanalysis. The analyses using Kalnay and Cai's method to estimate the impact of urbanization over Southeast China suggest that the temperature in Southeast China increases about 0.05 °C per decade as a result of urbanization (Zhou et al., 2004). Another study also shows that urbanization and other land use changes may contribute to the observed 0.12 °C per decade increase for daily mean surface temperature in East China (Zhang et al., 2005). According to the analysis of UHI effect in the PRD urban cluster, the annual UHI intensity in PRD rose from 0.11 °C in 1983 to 0.15 °C in 1993 (Zeng et al., 2004).
Because field experiments are rarely repeatable under identical conditions, such experiments are not well suited for answering questions about the consequences of urban effects (Mölders and Olson, 2004). To answer questions about how urbanization in the PRD affects regional climate, we turn to numerical modeling techniques. The MM5 was employed for this study and performed with and without increased urban area in the PRD. October 2004 was chosen to assess the extent to which urbanization in the PRD may have affected the monthly averaged diurnal cycle, such as variations in temperature, precipitation, humidity, turbulent heat fluxes, and planetary boundary layer (PBL) height. In MM5, urbanization is defined as a decrease in albedo and soil moisture, an increase in roughness length and stomatal resistance and a change in empirical parameters used to calculate transpiration (Mölders and Olson, 2004). In this study, only the land cover change of urbanization is considered. The land use of a rural region after urbanization was not considered to change. The anthropogenic impacts such as aerosol, moisture and heat release after urban expansion in the PRD were not taken account in this study.
2. Model description and experiment design
MM5 version 3.7 was used to simulate the monthly climate in South China. The simulated experiment included three nested computational domains, which were run in two–way interactive mode. The central latitude and longitude of the simulation domain were 24° N and 114° E, respectively. On a Mercator conformal map the three domains consist of: 101 x 97 grid points with the grid length of 27 km at the coarse domain (D01); 81 x 81 grid points with the grid length of 9 km at the domain D02; and 79 x 79 grid points with the grid length of 3 km at the domain D03. The terrain height and land use of domain D03 is shown in Figure 1. The coarse domain captured the changes in large–scale forcing and the fine increment of domain D03 permitted us to resolve mesoscale weather and urbanization over the PRD at a reasonable scale. Vertically, from the top to surface level, there were 31 sigma levels. The model top was 50 hPa. The first layer (sigma = 0.995) above ground was about 19 m thick. Eleven layers were below 1–km height.
The medium range forecast (MRF) PBL parameterization scheme (Hong and Pan, 1996), 5–layer soil model (Dudhia, 1996), NCAR Community Climate Model (CCM2) longwave and shortwave schemes (Hack et al., 1996), and Reisner mixed phase cloud microphysics scheme (Reisner et al., 1998) were used for the model physics in all the simulated domains. The Kain–Fritsch cumulus parameterization scheme (Kain and Fritsch, 1993) was used for the two outermost domains (D01 and D02), whereas no cumulus parameterization scheme was used for the finest domain (D03) because it was assumed that convection was reasonably well resolved by the explicit microphysics (Liu et al., 1997; Weisman et al., 1997).
Ten arc–minute (about 19 km) averaged terrain data and five minute (about 9 km) averaged terrain data (PSU–NCAR) were interpolated to the 27 and 9 km model grids using a Cressman type objective analysis scheme and filtered by a two–pass smoother/desmoother, individually. For the 3 km domain, a 30 arc second (about 0.9 km) global topography dataset [data source from United States Geological Survey (USGS)] was interpolated to the grid in order to better resolve the Pearl River delta. Two land cover situations were used in the PRD within the domain D03 in a case study setting. One land cover (namely NU) employed the original USGS 25–category vegetation data of MM5, which corresponded to the pre–1980 land cover (we consider that the experiment NU used the land cover of 1980 in the following) with little human disturbance (Fig. 1b), while another land cover (namely HU) used the land cover data of 2004 after urban expansion, which was updated from 2004 MODIS satellite images at 500 x 500 m resolution (Fig. 1c). Only the difference of urban area was included because the urban expansion was the focus of this study and the other change of land cover was not considered.
The National Center for Environmental Prediction (NCEP) 1° x 1° resolution global reanalysis data (Kistler et al., 2001) were interpolated to specify the initial and boundary conditions for the coarse model resolution grid (27 km) and for the vertical direction to 31 sigma levels. Surface and upper–air conventional observational data were incorporated into the analysis using a Cressman–type analysis scheme. Initial conditions for the two finer domains were obtained by interpolating from the coarsest domain. In order to reduce the initial imbalance of the model, the integrated mean divergence in a column was removed. The time steps were 60, 20, and 6.6 seconds for the domains D01, D02, and D03, respectively.
October 2004 was chosen for simulation because its weather conditions cause air pollution (Li et al., 1999; Fan et al., 2005) and there is little precipitation in the PRD during this period. Because the real–time MM5 forecasts were initialized with a cold start (no initial hydrometeors), it takes 12 to18 hours on average for the model to spin up (Colle et al., 1999). Atotal of 31 simulations, initialized every 24 h between 1200 UTC 30 September 2004 and 0000 UTC 31 October 2004, were completed. Because we use the 5–layer soil model (Dudhia, 1996) in the MM5 model in which the soil moisture is always initialized by climatology time–invarying soil wetness (a function of land use types), so the current model setup by reinitializing every 24 hours is designed to test the first order effect of "urban expansion". The effect of changing land–atmosphere feedback cannot be tested in the current model configuration. This approach was similar to that of Westrick and Mass (2001) in order to reduce the total error that would have accumulated over the relatively long monthly forecast period and to bypass the uncertainty in a regional climate model related to lateral boundary conditions (Wu et al., 2005). In all of the atmospheric simulations, the 13 to 36 h atmospheric forecast results (every hour) will be analyzed for information about the diurnal cycle. The statistical comparison of the results in the finest domain D03 will be shown in the next section.
3. The results of simulation
The spatially averaged value can reflect to what extent land–atmospheric interactions affect the weather on a somewhat larger spatial scale (Poveda and Mesa, 1997). The following analysis includes the simulated domain–averaged values (for all grids points in the domain D03), land–averaged values (for all land grids points in the domain D03), urban–averaged values (for all urban grids points in the domain D03), and their diurnal cycles during October 2004.
3.1 Shelter–level temperature and ground temperature
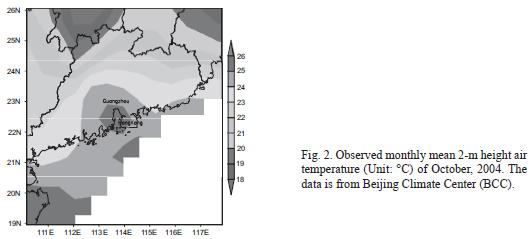
The observed monthly mean temperature (six–hourly observed data) and the simulated monthly mean 2–m height air temperature are shown in Figure 2 and Figure 3, respectively. The magnitude of simulated results is close to the observed in the northern part of Guangdong province but lower than the observed near the coast. The difference between HU and NU shows some warmer centers in the PRD due to urban expansion (Fig. 3c).

The simulation results show that, the monthly mean 2–m height air temperature increases by 0.07 °C with a domain–averaged value (from 21.76 °C in NU to 21.83 in HU), by 0.09 °C with a land–averaged value (from 20.62 °C in NU to 20.71 °C in HU), and by 0.36 °C with an urban–averaged value (from 21.24 °C in NU to 21.60 °C in HU) (Table I). The land–averaged value increases about 0.04 °C per decade, which approximates the results of Zhou et al. (2004), in which their estimated warming of mean surface temperature is 0.05 °C per decade in southeast China due to rapid urbanization.

The monthly mean 2–m daily maximum temperature in HU increases by 0.26 °C with a domain–averaged value, by 0.39 °C with a land–averaged value, and by 1.62 °C with an urban–averaged value, compared with those in NU. However, the monthly mean daily 2–m minimum temperature in HU decreases by 0.08 °C with a domain–averaged value, by 0.13 °C with a land–averaged value, and by 0.55 °C with an urban–averaged value, compared with those in NU. Because the maximum temperature has a warming trend and the minimum temperature has a cooling trend, the diurnal temperature range (DTR) increases in HU by 0.34 °C with a domain–averaged value, by 0.52 °C with a land–averaged value, and by 2.17 °C with an urban–averaged value. DTR with the land–averaged value in HU increases about 0.2 °C per decade, which is opposite to the analyses of Zhou et al. (2004) and Zhang et al. (2005), in which the daily diurnal temperature range has decreased as a result of urbanization. However, only the urban land use type is considered, and the impacts on aerosol, moisture and heat release after urban expansion in the PRD were neglected in this simulation. In MM5, urbanization meant a reduced heat capacity of the urban surface. Therefore, it is reasonable that the minimum temperature has a cooling trend and DTR increases.
Figure 4 is the diurnal cycle of average 2–m temperature over domain 03, land and urban. It is shown that the domain–averaged and land–averaged value in 2004 is higher than in pre–1980 in daytime and the two estimates are almost equivalent in nighttime. In urban region of HU, the daytime maximum increases and the night minimum decreases. Therefore, the complete diurnal cycle of shelter–level temperature is amplified. The maximum increase is at local solar time (LST) 13:00, by 0.3 °C with domain–averaged value, by 0.4 °C with land–averaged value, and by 1.8 °C with urban–averaged value (figure not shown).
The diurnal cycle of skin temperature of the two experiments is similar to that of 2–m temperature (Fig. 5).
In this study, the near–surface UHI intensity (ΔTu – r) was defined as the difference between the urban–averaged temperature and rural–averaged temperature (for all rural grids points where the height above sea level is lower than 100–m in the domain D03) which is different from Atkinson's (2003) definition. The simulated monthly mean urban–averaged temperature is 21.60 °C and monthly mean rural–averaged temperature is 20.77 °C, resulting in monthly mean UHI intensity of 0.83 °C. According to the statistical analysis of Zeng et al. (2004) on the UHI effect in Pearl River Delta, the mean UHI intensity in PRD is 0.69 °C in October during the period from 1993 to 2004. Therefore, the simulated UHI intensity ΔTu – r corresponds well to the Zeng's analysis.
Figure 6 shows the diurnal variations in the simulation of monthly mean urban–averaged temperature, rural–averaged temperature, and ΔTu – r. The simulation captured the role of UHI intensity. Monthly mean ΔTu – r was positive throughout the day and night; monthly mean ΔTu – r was about 0.4 in the nighttime and about 1.3 °C in the daytime.
3.2 Moisture
As shown in Table I, the simulated mixing ratios on October, 2004 for domain–averaged, land–averaged, and urban averaged values decrease distinctly ranging from 0.01 to 0.02 g/kg due to urbanization. The monthly mean mixing ratio in HU decreases by 0.2 g/kg with a domain–averaged value, by 0.2 g/kg with a land–averaged value and by 0.1 g/kg with an urban–averaged value. Accordingly, the monthly time–averaged relative humidity in HU decreases by 0.4% with a domain–averaged value from 60.0% in NU to 59.6% in HU, by 0.7% with a land–averaged value from 60.1% in NU to 59.4% in HU, and by 1.4% with an urban–averaged value from 59.2% in NU to 57.8% in HU.
Figure 7 shows the diurnal cycle of monthly averaged relative humidity. It is shown that the diurnal variations of simulated monthly mean relative humidity decreases throughout the day and night. In the daytime the monthly mean relative humidity decreases more than it does at night. The maximum decrease is about 3.6% at 13:00 LST. The atmospheric precipitable water, which is the vertical integration of the vapor water mixing ratio, can indicate the amount of vapor water in the air. Figure 8 shows that the atmospheric precipitable water decreases after urban expansion in the PRD.
3.3 Surface fluxes
The results show that the change in surface fluxes over an area is very significant due to urbanization. As shown in Table I, the monthly mean surface sensible heat fluxes increase with the spatially domain–averaged value for the domain D03 by 4.0 W/m2 (from 24.8 in NU to 28.9 W/m2 in HU), with a land–averaged value by 4.9 W/m2 (from 16.6 in NU to 21.5 W/m2 in HU), and with an urban–averaged value by 57.5 W/m2 (from 28.5 W in NU to 86.0 W/m2 in HU). On the other hand, the monthly mean latent heat fluxes decrease with a domain–averaged value for the domain D03 by 5.9 W/m2 (from 198.1 W in NU to 192.2 W/m2 in HU), with a land–averaged value by 11.4 W/m2 (from 117.0 Win NU to 105.6 in HU), and with a urban–averaged value by 87.0 W/m2 (from 128.8 in NU to 41.8 W/m2 in HU). The Bowen ratio which is the ratio, of surface sensible heat fluxes to the latent heat fluxes, increases from 0.22 in NU to 2.06 in HU over the urban region. Grimmond and Oke (1999) analyzed observed data of seven cities (Chicago, Illinois; Los Angeles, California; México City, Distrito Federal; Miami, Florida; Sacramento, California; Tucson, Arizona; and Vancouver, British Columbia) in North America and pointed out that the daytime range of Bowen ratio is 1.37–2.87 for suburban areas. The averaged Bowen ratio with the 2004 land cover is greater than that with the pre–1980 land cover, indicating that more energy is going into heating the air than evaporating water.
The diurnal cycle of averaged sensible and latent heat fluxes is shown in Figures 9 and 10. The increase of averaged sensible heat fluxes from NUto HU occurs in daytime and the maximum increase is at 13:00 LST. On the other hand, the decrease of averaged latent heat fluxes from NU to HU also occurs in daytime and the maximum decrease is at 13:00 LST. Comparing Figure 9 and 10 with Figure 4, the impact of the surface fluxes on the 2–m temperature is phased–shifted and the time of the maximum 2–m temperature (15:00 LST) is 2 hours later than that of maximum surface fluxes (13:00 LST).
The diurnal cycle of Bowen ratio is amplified (Fig. 11) because the sensible heat fluxes increase and latent heat fluxes decrease concurrently.
3.4 Planetary boundary layer height
Since Oke (1987) first put forward the concept of urban canopy layer, the study of the impact of urban expansion on the PBL has been a focus. Dupont et al. (2004) used the MM5 to simulate the meteorological fields within and above the urban and rural canopies. Although the parameterization of urban canopy layer was not considered and the roughness scale was used for the properties of urbanization in this study, the impact of urban expansion on the urban boundary layer can be illustrated by the change of the height of the simulated atmospheric boundary layer. The monthly mean PBL height increases by 12 m with a domain–averaged result of 827 m in NU to 839 in HU, by 18 m with a land–averaged result of 765 m in NU to 783 in HU, by 76 m with a urban–averaged result of 780 m in NU to 855 in HU. From the diurnal variations of the PBL height (Fig. 12), we found that the PBL height increases in the daytime, and the maximum increase of PBL height occurs at 15:00 LST.
4. Conclusions
Over the PRD during the past 25 years, there has been a widespread conversion of natural vegetation classes to urban land. These landscape changes are permanent and the process will continue. These urban expansions over the PRD are likely to have altered the local weather patterns. By using identical observed meteorology for lateral boundary conditions, two one–month simulation were conducted to investigate the possible effect of urbanization on the regional climate: one using the original USGS 24–category land use data and another using the urban land use data from 2004 MODIS satellite images as lower boundary condition. The results of this study using MM5 showed that over the PRD, additional urbanization amplifies the diurnal cycles of surface temperature, sensible heat fluxes and PBL height, decreases relative humidity, water vapor in the air and latent heat flux, and increases the DTR. Furthermore, these influences mainly occur in the daytime. When averaged spatially over the model domain, these amplifications reflect that the urban expansion over the PRD affect the regional climate at the spatial scale at least several hundreds of kilometers.
The simulation also shows that the UHI intensity is about 0.4 °C in the nighttime and about 1.3 °C in the daytime after the urban expansion. Comparison of the simulated monthly mean 2–m temperature against the observed monthly mean temperature revealed that the magnitude of simulated results is close to the observed near the coastal area. Future work should include the high–resolution land use data and the parameterization of the urban canopy layer into the numerical model. To take anthropogenic activity into account, it is necessary to include emissions of urban aerosols, moisture, and heat release in the model.
These results indicate that unless urbanization effects on weather are explicitly included in climate trend analyses, the analysis of regional climate change can be erroneously concluded. This study could have important implications for land use management interests in the PRD and help policy makers make cost–efficient decisions and implement effective policies.
Acknowledgements
This study was supported by the National Key Program for Developing Basic Research of China (973–Program; No. 2010CB428504), the National Natural Science Foundation of China (Grant No. U0833001), Science and Technology Planning Project of Guangdong Province, China (Ref. No. 2007B080703006), and Public Good Industry Project of State Environmental Protection Administration (No. 200709023). The authors would also like to thank USGS for providing remote sensing images and DEM data used in this work, and the Resource and Environmental Scientific Data Center of Chinese Academy of Science for supplying LULC database. Acknowledgement is also made to the Network and Information Technology Center at Sun Yat–sen University for computer time used in the research.
References
Arnfield A. J., 2003. Two decades of urban climate research: a review of turbulence, exchanges of energy and water, and the urban heat island. Int. J. Climatol. 23, 1–26. [ Links ]
Atkinson B. W., 2003. Numerical modelling of urban heat–island intensity. Bound.–Lay. Meteorol. 109, 285–310. [ Links ]
Brown M., 2000. Urban parameterization for mesoscale models. In: Mesoscale atmospheric dispersion. (Z. Boybey Ed.) Wessex Press, NY, 448 pp. [ Links ]
Cao J. J., S. C. Lee, K. F. Ho, X. Y. Zhang, S. C. Zou, K. Fung, J. C. Chow and J. G. Watson, 2003. Characteristics of carbonaceous aerosol in Pearl River Delta region, China during 2001 winter period. Atmos. Environ. 37, 1451–1460. [ Links ]
Chen F. and J. Dudhia, 2001. Coupling an advanced land surface–hydrology model with the Penn State–NCAR MM5 Modeling System. Part I: Model Implementation and Sensitivity, Mon. Wea. Rev. 129, 569–585. [ Links ]
Colle B. A., K. J. Westrick and C. F. Mass, 1999. Evaluation of MM5 and Eta–10 precipitation forecasts over the Pacific northwest during the cool season. Weather Forecast. 14, 137–145. [ Links ]
Dudhia J., 1993. A Non–hydrostatic version of the Penn State–NCAR mesoscale model: Validation tests and simulation of an Atlantic cyclone and cold front. Mon. Wea. Rev. 121, 1493–1513. [ Links ]
Dudhia J., 1996. A multi–layer soil temperature model for MM5. In: Preprint from the Sixth PSU/ NCAR Mesoscale Model Users' Workshop, Boulder, CO. (http://www.mmm.ucar.edu/mm5/lsm/lsm–docs.html). [ Links ]
Dupont S., T. L. Otte, and J. K. S. Ching, 2004. Simulation of meteorological fields within and above urban and rural canopies with a mesoscale model (MM5). Bound. –Lay. Meteorol. 113, 111–158. [ Links ]
Ek M. B., K. E. Mitchell, Y. Lin, E. Rogers, P. Grunmann, V. Koren, G. Gayno and J. D.Tarpley, 2003. Implementation of Noah land surface model advances in the National Centers for Environmental Prediction Operational Mesoscale Eta Model. J. Geophys. Res. 108, No.D22, 8851. [ Links ]
Fan S. J., A.Y. Wang, Q. Fan, J. Liu and B. M. Wang, 2005. Atmospheric boundary layer concept model of the Pearl River Delta and its application. J. Trop. Meteorol. 21, 286–292. (in Chinese). [ Links ]
Foley J. A., R. DeFries, G. P. Asner, C. Barford, G. Bonan, S. R. Carpenter, F. S. Chapin, M. T. Coe, G. C. Daily, H. K. Gibbs, J. H. Helkowski, T. Holloway, E. A. Howard, C. J. Kucharik, C. Monfreda, J. A. Patz, I. C. Prentice, N. Ramankutty and P. K. Snyder, 2005. Global consequences of land use: Review. Science 309, 570–574. [ Links ]
Grell G. A., J. Dudhia and D. R. Stauffer, 1994. A description of the Fifth–Generation Penn State/ NCAR mesoscale model (MM5), NCAR Technical Report No. 398, 120 pp. [ Links ]
Grimmond C. S. B. and T. R. Oke, 1999. Heat storage in urban areas: Local–scale observations and evaluation of a simple model. J. Appl. Meteorol. 38, 922–940. [ Links ]
Grimmond C. S. B. and T. R. Oke. 2002. Turbulent heat fluxes in urban areas: Observations and local–scale urban meteorological parameterization scheme (LUMPS). J. Appl. Meteor. 41, 792–810. [ Links ]
Grossman–Clarke S., J. A. Zehnder, W. L. Stefanov, Y. Liu and M. A. Zoldak, 2005. Urban modifications in a mesoscale meteorological model and the effects on near–surface variables in an arid metropolitan region. J. Appl. Meteor. 44, 1281–1297. [ Links ]
Hack J. J., B. A. Boville, B. P. Briegleb, J. T. Kiehl, P. J. Rasch and D. L.Williamson, 1993. Description of the NCAR community climate model (CCM2). NCAR Technical Note, NCAR/ TN–382+STR, National Center for Atmospheric Research, Boulder, CO, 108 pp. [ Links ]
Hong S. Y. and H. L. Pan, 1996. Nonlocal boundary layer vertical diffusion in a medium–range forecast model. Mon. Wea. Rev. 124, 2322–2339. [ Links ]
Kain J. S. and J. M. Fritsch, 1993. Convective parameterization for mesoscale models: The Kain–Fritsch scheme. The representation of cumulus convection in numerical models. Meteor. Monogr. 46, 165–170. [ Links ]
Kalnay E. and M. Cai, 2003. Impact of urbanization and land use change on climate. Nature 423, 528–531. [ Links ]
Kaufmann R. K., K. C. Seto, A. Schneider, Z. T. Liu, L. M. Zhou and W. L. Wang, 2005. Climate response to rapid urban growth: Evidence of a human–induced precipitation deficit. J. Climate 20, 2299–2306. [ Links ]
Kistler R., E. Kalnay, W. Collins, S. Saha, G. White, J. Woollen, M. Chelliah, W. Ebisuzaki, M. Kanamitsu, V. Kousky, H. van den Dool, R. Jenne and M. Fiorino, 2001. The NCEP/NCAR 50–year reanalysis: Monthly means CD–ROM and documentation. Bull. Amer. Meteor. Soc. 82, 247–268. [ Links ]
Landsberg H. E., 1981. The urban climate. Academic Press, NY, 275 pp. [ Links ]
Li Q., F. J. Li, Y. X. Ye and S.W. Liu, 1999. The relationship between synoptic patterns and potential pollution and the density of surface air pollution over Pearl River Delta. J. Trop. Meteorol. 15, 364–369. (in Chinese) [ Links ]
Liang J. Y. and S. S. Wu, 1999, Climatological diagnosis of winter temperature variations in Guangdong. J. Trop. Meteorol. 15, 221–229. (in Chinese) [ Links ]
Liu Y. B., D. L. Zhang and M. K. Yau, 1997. A multiscale numerical study of hurricane Andrew (1992). Part I: Explicit simulation and verification. Mon. Wea. Rev. 125, 3073–3093. [ Links ]
Martilli A., A. Clappier and M. W. Rotach, 2002. An urban surface exchange parameterization for mesoscale models. Bound.–Lay. Meteorol. 104, 261–304. [ Links ]
Mölders N. and M. A. Olson, 2004. Impact of urban effects on precipitation in high latitudes. J. Hydrometeor. 5, 409–429. [ Links ]
Oke T. R., 1976. City size and the urban heat island. Atmos. Environ. 7, 769–779. [ Links ]
Oke T. R., 1987. Boundary layer climate, 2nd ed. Methuen, London, UK, 435 pp. [ Links ]
Pielke R. A. Sr., 2001. Mesoscale meteorological modeling. Academic Press, NY, 676 pp. [ Links ]
Poveda G. and O. J. Mesa, 1997. Feedbacks between hydrological processes in tropical south american and large–scale ocean–atmospheric phenomenon. J. Climatol. 10, 2690–2702. [ Links ]
Reisner J., R. M. Rasmussen and R. T. Bruintjes, 1998. Explicit forecasting of supercooled liquid water in winter storms using the MM5 mesoscale model. Quart. J. Roy. Meteorol. Soc. 124, 1071–1107. [ Links ]
Rotach M. W., 1995. Profiles of turbulence statistics in and above an urban street canyon. Atmos. Environ. 29, 1473–1486. [ Links ]
Sang J. G., Z. K. Zhang and B. Y. Zhang, 2000. Dynamical analysis on heat island circulation, Acta Meteorol. Sin. 58, 321–327. (in Chinese) [ Links ]
Seto K. C., C. E. Woodcock, C. Song, X. Huang, J. Lu and R. K. Kaufmann, 2002. Monitoring land–use change in the Pearl River Delta using LandsatTM. Int. J. Remote Sens. 23, 1985–2004. [ Links ]
Uno I., H. Ueda and S. Wakamatsu, 1989. Numerical modeling of nocturnal urban boundary layer. Bound.–Lay. Meteor. 49, 77–98. [ Links ]
Wang W. C., Z. M. Zeng and T. R. Karl, 1990. Urban heat islands in China. Geophys. Res. Lett. 17, 2377–2380. [ Links ]
Weisman M. L., W. C. Skamarock and J. B. Klemp, 1997. The resolution dependence of explicitly modeled convection. Mon. Wea. Rev. 125, 527–548. [ Links ]
Weng Q., 2002. Land use change analysis in the Zhujiang Delta of China using satellite remote sensing, GIS and stochastic modeling. J. Environmental Management 64, 273–284. [ Links ]
Westrick K. J. and C. Mass, 2001. An evaluation of a high–resolution hydrometeorological modeling system for prediction of a cool–season flood event in a coastal mountainous watershed. J. Hydrometeor. 2, 161–180. [ Links ]
Yeh A. G. O. and X. Li, 1997. An integrated remote sensing and GIS approach in the monitoring and evaluation of rapid urban growth for sustainable development in the Pearl River Delta, China. Int. Plan. Stud. 2, 193–210. [ Links ]
Yeh A. G. O. and X. Li, 1998. Sustainable land development model for rapid growth areas using GIS. Int. J. Geogr. Inf. Sci. 2, 169–189. [ Links ]
Zeng X., G. M. Qian and W. J. Pan, 2004. Study on urban heat island effect in Pearl River Delta urban group. Meteor. Mon. 30, 12–15. (in Chinese) [ Links ]
Zhang J. Y., W. J. Dong, L. Y. Wu, J. F. Wei, P. Y. Chen and D. K. Lee, 2005. Impact of land use changes on surface warming in China. Adv. Atmos. Sci. 22, 343–348. [ Links ]
Zhou L. M., R. E. Dickinson, Y. H. Tian, J. Y. Fang, Q. X. Li, R. K. Kaufmann, C. J. Tucker, and R. B. Myneni, 2004. Evidence for a significant urbanization effect on climate in China. P. Nat. Acad. Sci. USA, 101, 9540–9544. [ Links ]

