


Services on Demand
Journal
Article
 English (pdf)
 Article in xml format
 Article references
 Send this article by e-mail
Indicators
-
 Cited by SciELO
 -
 Access statistics
Related links
-
 Similars in
SciELO
Similars in
SciELO
Share

 Permalink
Atmósfera
Print version ISSN 0187-6236
Atmósfera vol.23 n.1 Ciudad de México Jan. 2010
The role of convective parameterization in the simulation of a cyclone over the South Atlantic
R. P. DA ROCHA
Departamento de Ciências Atmosféricas, Instituto de Astronomia, Geofísica e
Ciências Atmosféricas, Universidade de São Paulo, Brasil
E. CAETANO
Centro de Ciencias de la Atmósfera, Universidad Nacional Autónoma de México,
Circuito Exterior de Ciudad Universitaria, México, D. F., 04510, Mexico
Corresponding author; e–mail: caetano@servidor.unam.mx
Received November 17, 2008; Accepted October 1, 2009
RESUMEN
Se realizaron simulaciones numéricas para examinar el papel de las parametrizaciones de cúmulos de Kuo y Kain–Fritsch (KF) y la dinámica seca en el desarrollo de un ciclón bajo una atmósfera baroclínica débil en aguas subtropicales del Océano Atlántico sur. La fase inicial del desarrollo del ciclón es investigada con una malla horizontal gruesa (75 km) y cuando el ciclón llega a la etapa de madurez, se utilizan dos resoluciones horizontales diferentes (75 y 25 km). La mejor simulación para la fase inicial del ciclón se produce cuando se aplica el esquema de convección Kuo, y esto puede ser atribuido a un mayor calentamiento diabático en la troposfera. Por otro lado, la simulación seca no es capaz de proporcionar la ubicación correcta y la intensidad del ciclón en su fase inicial. Durante la fase de madurez del ciclón la profundización es más intensa para el experimento del esquema de Kuo, asociada con la mayor liberación de calor latente en la columna vertical. La presencia de corrientes descendentes en el esquema KF, que actúan para enfriar y secar los niveles inferiores, es esencial para estabilizar la atmósfera y para reproducir el ciclón más cercano a la tasa de profundización observada. La mayor profundización del ciclón se encuentra en el esquema Kuo para el experimento de alta resolución. Esto sugiere que el sistema de convección KF es menos sensible a la resolución de la malla horizontal. También se muestra que los procesos diabáticos son cruciales para simular las características observadas de este ciclón marino en la región subtropical.
ABSTRACT
Numerical simulations are carried out to examine the role of the Kuo and Kain–Fritsch (KF) cumulus parameterization schemes and dry dynamics on a cyclone development, in a weak baroclinic atmosphere, over subtropical South Atlantic Ocean. The initial phase of the cyclone development is investigated with a coarse horizontal mesh (75 km) and when the cyclone reaches the mature stage two different horizontal resolutions are used (75 and 25 km). The best performance simulation for the cyclone initial phase occurs when the Kuo convective scheme is applied, and this may be attributed to a greater diabatic warming in the troposphere. On the other hand, the dry simulation is not capable of simulating the correct location and intensity of the cyclone in its initial phase. During the mature phase, a cyclone over deepening occurs in the Kuo scheme experiment associated with larger latent heat release in a deep vertical column. The presence of downdraft currents in the KF scheme, which acts to cool and dry the lower levels, is essential to stabilize the atmosphere and to reproduce the nearest observation cyclone deepening rate. The largest cyclone deepening is found in the Kuo scheme high resolution experiment. This suggests that the KF convective scheme is less sensitive to the horizontal grid resolution. It was also revealed that the diabatic processes are crucial to simulate the observed features of this marine cyclone over subtropical region.
Keywords: Subtropical cyclone, Kuo, Kain–Fritsch, marine cyclone.
1. Introduction
During the period April to September, the cyclones activity drives the day–by–day weather changes and the climate in the South America (SA) region. Sinclair (1995), Hoskins and Hodge (2005) and Reboita (2008) have found a preferable subtropical cyclogenesis area around 25–30° S. Using extended empirical orthogonal functions, Vera et al. (2002) analyzed the climatological characteristics of these subtropical cyclones in winter conditions. They showed that when these systems are at lee side of the Andes Mountains, acquire atypical baroclinic wave structure at low levels, and that its intensification depends on diabatic processes. Previous observational studies also indicated that the baroclinic instability and the release of latent heat contribute to the development of these cyclones (Sinclair, 1995; Gan and Rao, 1991).
Numerical simulations of the cyclogenesis processes over the ocean have been concentrated on the rapidly deepening systems, due to the low skill of operational models to forecast those systems (Liou and Elsberry, 1987; Reed et al., 1988, 1993; Huo et al., 1996). Kuo and Low–Nam (1990), for instance, performed several numerical experiments for nine intense extratropical cyclones over North Atlantic Ocean. They found that the moist processes play an important role on the rapid cyclone deepening and the associated diabatic heating is dependent of the cumulus scheme utilized. For all nine cases, the Grell (1993) scheme has presented better results. Seeking for the more adequate cumulus scheme to represent the mesoscale structures embedded in intense marine cyclone over North Atlantic, Kuo et al. (1996) compared six cumulus schemes for two horizontal grid resolution (60 and 20 km). They showed that the Kain and Fritsch (1990), hereafter KF, convective scheme produced the best simulation for both grid resolutions. This result was attributed to the fact that the KF scheme is specially designed for mesoscale models. Wang and Seaman (1997) compared the performance of four convective parameterization schemes for three cold and one warm seasons precipitation event over continental North America. They found that the precipitation forecast skill is generally higher for cold–season events and according to authors none of the convective schemes consistently out performs the others by a wide margin or in all measures of skill. In general the precipitation volume is better predicted than the maximum rainfall, indicating that the model tends to underestimate (overestimate) the intense (light) precipitation.
There are very few numerical studies over South Atlantic Ocean (SAO). Seluchi and Saulo (1998) have investigated the role of moist processes and the Andes topographic effect over an explosive coastal cyclone developing over the northeastern Argentina and Uruguay. Their results suggested that diabatic heating due to the condensation is an important mechanism for the rapidly cyclone deepening. Examining the sea wave activity near Brazilian coast, Innocentini and Caetano Neto (1996) simulated a marine cyclone with a slow deepening rate (about 6 hPa in 24 hours) and traveling eastwards. Normally, many of those systems developed over southeastern Brazilian coast (around the latitude of 30° S; Reboita, 2008) displacing slowly eastwards (Campos, 1999; Iwabe, 2008; Reboita, 2008). This kind of cyclogenesis represents a challenge for numerical weather forecast over the region. Recently the cyclone Catarina made a transition from extratropical to tropical cyclone and it became known as the first SAO hurricane (McTaggart–Cowan et al., 2006). All the operational forecast models of Brazil failed to forecast the Catarina hurricane (Bonatti et al., 2004).
A typical system with the characteristics described before (Campos, 1999; Iwabe et al., Reboita; 2008) was initiated at 28 May 1997 on the southeastern Brazilian coast, persisting up to 7 June 1997 over subtropical SAO. During the first four days, strong surface winds generated high sea waves as reported by the newspapers and documented by Campos (1999). This event caused four shipwrecks and nine boats sinking, socioeconomic damages and few casualties were also reported. The Brazilian Center for Weather Prediction and Climate Studies (CPTEC) global model (Satyamurty and Bittencourt, 1999) forecast was again unable to predict this system.
In order to improve the forecast skill of subtropical cyclones over SAO a better understanding of the role of the convective parameterization in the numerical weather prediction models is needed. Numerical experiments identified KF convective scheme as the best performance to simulate intense extratropical cyclones over North Atlantic Ocean (Kuo et al., 1996). Over subtropical areas, however, very little is known about the performance of the convective parameterization schemes.
This paper investigates the role of Kuo and KF convective schemes on subtropical cyclone development on the southeastern Brazilian coast on 28 May 1997. The numerical experiments used the Japan Meteorological Agency (JMA) limited area atmospheric model (Ninomiya et al., 1984) with initial and boundary conditions provided by the CPTEC global model forecasting system (Satyamurty and Bittencourt, 1999). The impact of horizontal resolution in the cyclone mature phase is also examined.
This paper is organized as follow. Section 2 describes the numerical atmospheric model, data set used and numerical experimental designs. The cyclone synoptic overview is in section 3. The numerical simulation results are discussed in sections 4 and 5. The impact of horizontal resolution is discussed in section 6 and the conclusions are presented in section 7.
2. Numerical simulations and data
a) Model
The limited area model (LAM) used in this study was developed by JMA (Ninomiya et al., 1984). The governing equations are written in flux form and sigma–pressure vertical coordinate. The model uses a numerical integration scheme developed by Tatsumi (1983) designated to damp the high frequency oscillations at the beginning of the simulation period.
The surface layer parameterization follows the universal functions proposed by Businger et al. (1971) and in the planetary boundary layer the vertical fluxes of heat, moisture and momentum are resolved by the second–order level two Mellor and Yamada (1974) scheme. The radiative processes are parameterized according to Kondo (1976), and the Bhumralkar (1975) ground temperature prognostic equation is used over land areas. A fourth order numerical diffusion is applied to the prognostic variables in order to filter the numerical waves induced by the numerical scheme. The horizontal diffusion coefficients (KH) are function of the horizontal grid size and model time step (Anthes et al., 1987).
For the grid scale precipitation a simple large–scale condensation scheme, which removes the moisture excess when the relative humidity reaches saturation, is used. This scheme also considers explicitly the evaporative effect of the precipitation falling through sub–saturated layers following the Nagata and Ogura (1991) scheme.
Two different cumulus parameterization schemes are assessed: the Kuo (1974) scheme with modifications proposed by Geleyn (1985), and the KF scheme (Kain and Fritsch, 1990). The KF was implemented in JMA model by da Rocha (1999). In the Kuo scheme the convective precipitation is proportional to large–scale moisture convergence and it is triggered when the lower troposphere is convectively unstable. In the Geleyn formulation for the Kuo scheme, the partition of atmospheric moistening and precipitation is determined level–by–level considering only the environment moisture availability, i.e., it is not necessary to compute the "b" parameter (Kuo, 1974). To represent implicitly the cooling associated with downdraft current, the Kuo scheme initiates the moist adiabatic ascension from the surface level. In the KF convective parameterization the heating/moistening of the atmosphere and the convective precipitation rate are functions of the convective available potential energy (CAPE). This scheme considers that all CAPE on the model grid element is removed during a convective time period (usually between 30 and 60 minutes). The KF scheme also includes the mass detrainment at middle levels, the downdraft currents and the cloud overshooting above of the equilibrium level. Finally, a relationship between updraft and downdraft currents and the height of cloud base defines the precipitation efficiency in the KF scheme.
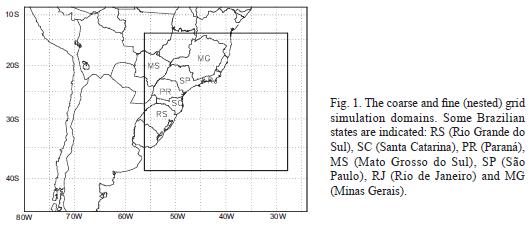
b. Experimental design and data
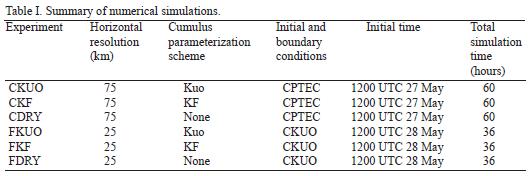
The numerical experiments are focused on the cyclogenesis and cyclone mature phase periods. As summarized in Table I, two domains –main and nested– (Fig. 1) are used with horizontal resolutions of 75 km (coarse) and 25 km (fine) and two convective parameterization schemes (Kuo and KF) and with no moist process (DRY). The initial conditions for coarse resolution experiments (CKUO, CKF and CDRY) were set up to begin at 1200 UTC 27 May 1997 for 60 hours of simulation. The fine resolution (FKUO, FKF and FDRY) experiments start at 1200 UTC 28 May for 36 hours of simulation. These experiments used initial and boundary conditions (every 3 hours) from the CKUO experiment (Table I).
The analysis and the CPTEC global model forecasting (Satyamurty and Bittencourt, 1999) were used as initial and boundary conditions for the coarse grid simulations. This data set has 1.875° x 1.875° latitude and longitude horizontal resolution for 0000, 0600, 1200 and 1800 UTC, and ten pressure levels (from 1000 to 30 hPa) for the variables: temperature, zonal and meridional wind, geopotential, and relative humidity (from 1000 to 300 hPa). The sea surface temperature (1° x 1° of horizontal resolution) was specified from the climatological data set provided by the JMA analysis. Over the continent, the topography was obtained from the global topography of the US Navy archive (10' x 10' horizontal resolution).
To compare with the numerical experiment results, the NCEP (National Centers for Environmental Prediction) reanalysis (Kalnay et al., 1996) and the daily rainfall from INMet (Meteorology National Institute of Brazil) surface network over Brazil were used. This data set was interpolated to the LAM grid using Cressman (1959) objective analysis scheme. Additionally, the simulated rainfall was compared with GPCP (Global Precipitation Climatology Project; ftp.ncdc.noaa.guv/pub/data/) daily precipitation dataset that has 1° x 1° horizontal resolution. As described in Huffman et al. (1997) the GPCP rainfall analysis includes rainfall estimate from geostationary and polar–orbiting satellites plus rain gauge observations.
3. Synoptic overview
The NCEP reanalysis of the mean sea level pressure (MSLP) for 1200 UTC 27 May 1997 shows a broad low–pressure area located over Paraguay, extending to southern Brazil as an inverted surface trough (Fig. 2a). A weak baroclinic zone at 920 hPa is identified by the weak meridional temperature gradient over southern sector of the low–pressure center (Fig. 2a). The convective activity (Fig. 2c) has been trigged at the same area where there is the inverted surface trough in the MSLP field (Fig. 2a). At mid–level a minimum cyclonic vorticity center (–4 x 10⁻⁵ s–1, indicated by a full circle in Fig. 2a) is situated in the western sector of the surface low pressure. Figure 2b shows that downstream of the 500 hPa small amplitude trough, there is a widespread area of warm advection (maximum of the 5 °C day–1) at 850 hPa level. Although the warm advection is not intense it contributes to the upward motion generating favorable conditions to the cyclone development (Carlson, 1991; Holton, 1992).
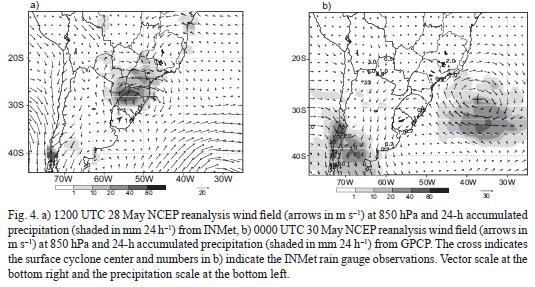
The NCEP reanalysis of MSLP field at 1200 UTC 28 May (Fig. 3a) shows that an incipient cyclonic circulation, represented by 1012 hPa closed isobar, has been formed at southern Brazilian coast (around 28.5° S, 48° W). Near the cyclone center, at 920 hPa, the meridional temperature gradient has intensified. At mid levels the trough has moved eastward and amplified, and it is located about ~550 km westward of the surface cyclone (Fig. 3a), while the 850 hPa warm (cold) at east (at west) of the system also has intensified in the last 24 hours (Fig. 3b). In this more favorable baroclinic environment, the convective activity is widespread and intense over the east and north sides of surface cyclone (Fig. 3c), contributing to intensify the low levels winds (Fig. 4a). From 1200 UTC 27 to 28 May, the system has produced light to moderated precipitation over the southern and southeastern Brazil (Fig. 4a). The intensification of 500 hPa cyclonic vorticity (minimm of ~ –7 x 10⁻⁵ s–1) and the 850 hPa thermal advection pattern contributes to the cyclone deepening later on.
From CPTEC global model 24 hours forecast, valid for 1200 UTC 28 May (Fig. 5a), it is clear that this model does not simulate the cyclone initial phase as shown in the NCEP reanalysis (Fig. 3a).
After 1200 UTC 28 May, the subtropical cyclone has displaced slowly eastward over the SAO with a weak deepening rate of 11 hPa in 36 hours, reaching 1001 hPa of central pressure at 0000 UTC 30 May. At this time, the surface cyclone is centered over the SAO (~28° S, 38° W) and amore intense meridional temperature gradient is observed (Fig. 6a). Although the pressure–deepening rate is not strong, the pressure gradients have strengthened in the southwestern cyclone sector (Fig. 6a), associated with both the eastward displacement of the polar anticyclone and cyclone intensification. At this time the convective activity is more intense in the southeastern flank of surface cyclone and a dry air intrusion in the cloud free area over northwestern of the cyclone sector (Fig. 6c) is observed. The cyclonic circulation at 850 hPa level (Fig. 4b) occupies a large area over the SAO, and the last 24 hours accumulated precipitation has occurred over the center–south area of the surface cyclone. Comparing the MSLP and temperature from NCEP reanalysis (Fig. 6a) with CPTEC 60 hours forecast (Fig. 5b) it is clear that the CPTEC model fails to reproduce the cyclone intensity and localization and also the meridional temperature gradient.
4. Simulation of the initial cyclone development
a. Analysis
The CKUO, CKF and CDRY simulated MSLP valid for 1200 UTC 28 May (Fig. 7) show a similar broad low–pressure area over Paraguay and southern Brazil, however the CKUO experiment shows a better agreement with the NCEP reanalysis (Fig. 3a). Note that the 1012 hPa closed isobar over southern Brazil coast in CKUO coincides with the NCEP reanalysis (Fig. 3a). The CKF experiment will only reproduce this closed isobar in the next 3 hours. This delay in the cyclone initial development could be associated with the differences in the diabatic heating profiles at this phase (Fig. 12b). In the CDRY experiment (Fig. 7c) the central pressure is about 2 hPa higher compared to the moist experiments. This difference among the dry and moist experiments indicates that the moist processes are essential for the cyclogenesis process over subtropical latitudes and under weak baroclinic forcing.
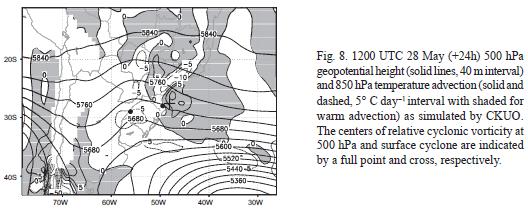
At 500 hPa, the simulated trough position and intensity is very similar among the experiments (Fig. 8, only CKUO fields shown). However, CKUO and CKF simulated two cyclonic vorticity centers (~ –4 x 10⁻⁵ s–1) at 500 hPa (Fig. 8): one near the trough axis and another one more intense (–12 x 10–5 s–1) closer to the surface cyclone center. This last cyclonic core is due to the tilting term in the vorticity equation. The CDRY experiment is not able to simulate this feature. As the NCEP reanalysis (Fig. 3b) the simulated 500 hPa trough has small amplitude and a north–south axis orientated (Fig. 8). In the CKUO (Fig. 8) and CKF (figure not shown) experiments the 850 hPa thermal advection intensity and spatial pattern have a good agreement with the NCEP reanalysis (Fig. 3b).
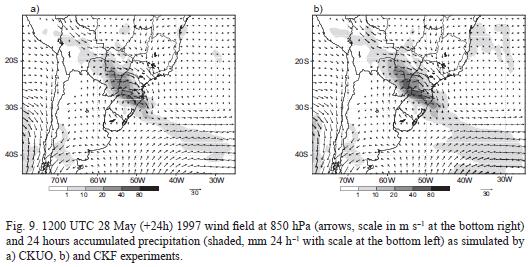
At 1200 UTC 28 May the 850 hPa wind field for CKUO and CKF experiments show a more intense winds over northern sector of the cyclone (Figs. 9a, b). The center of the cyclonic circulation is further north from that shown by the NCEP reanalysis (Fig. 4a). Over the continent, the 24–h accumulated precipitation simulated by CKUO and CKF (Figs. 9a–b) seems to reproduce fairly well the observed pattern (Fig. 4a) over the south Brazilian states (SC, PR, RS; see Fig. 1). Both simulations produce, however, less precipitation than observed over SP State. The CKUO generates an intense core of heavy precipitation (up 40 mm 24 h–1) around 28° S–5 1° W, while in the CKF this core is widespread and displaced westward. The mean precipitation in the area of cyclone (60, 48° W and 32, 20° S) reaches 13.8, 9.5 and 12.5 mm 24 h–1 for the observation, CKUO and CKF forecasting, respectively. This means that in terms of mean rainfall amount in the cyclone area the CKF is closer to observation (as will be discussed late on, this does not imply a larger diabatic heating).
b. Diabatic heating
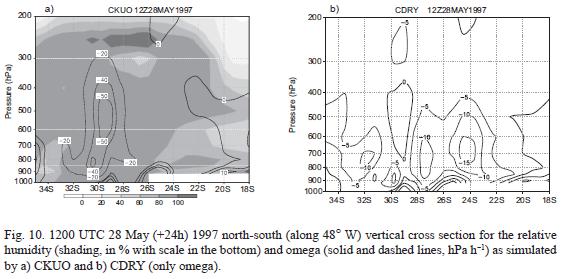
The upward motion, at 1200 UTC 28 May, simulated by CDRY (–15 hPa h–1 maximum) is weaker and restricted to lower troposphere (Fig. 10b), meanwhile in the CKUO the maximum reaches –50 hPa/h at the mid–levels (Fig. 10a), that is similar to CKF (figure not shown). Moist experiments show that the intense upward motion area is embedded in a deep layer of high relative humidity (greater than 90%; Fig. 10a). This deep moist environment determines the vertical profile of diabatic moistening and heating in the Kuo and KF cumulus parameterization schemes.
Taking the CKUO minus CDRY vertical cross section along 48° W for the potential temperature (Fig. 11a) results that the CKUO is colder in low and high troposphere and warmer in the middle troposphere (associated with latent heating in the Kuo scheme). The low levels colder air in the CKUO is explained by the moist adiabatic ascension from surface level in the Kuo parameterization modified by Geleyn (1985). In the CKUO the diabatic heating at mid levels overcomes the adiabatic cooling associated with the upward motions (Fig. 10a) and the air column warms and expands. The CKUO minus CDRY geopotential cross section presents a vertical structure with a negative geopotential height from low to mid levels and positive at upper troposphere (Fig. 11a). This configuration contributes to increase the mass convergence (divergence) in the low (upper) troposphere, favoring the cyclone deepening in the CKUO experiment.
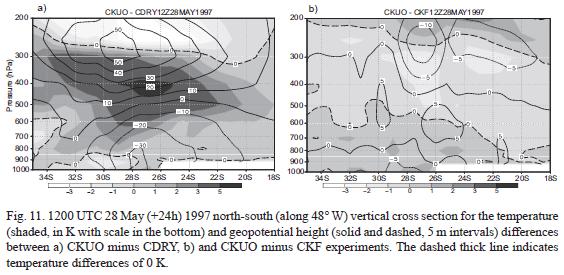
The CKUO minus CKF temperature vertical cross section (Fig. 11b) reflects the distinct physical approaches considered in each convective parameterization. For the first 24 hours simulation, the accumulated latent heating release vertical profiles (convective, large–scale and total) calculated over the cyclone area (60, 48° W and 33, 20° S) are shown in Figure 12. As the convection is triggered in a moist environment, the mass in the updraft current increases with the height in the KF scheme (i.e., the updraft is undiluted). Therefore, the convective heating is maximized in the upper troposphere (near 400 hPa) decreasing quickly above this level (Fig. 12a). Two cooling layers are evident in the CKF profile: below 800 and above 300 hPa, associated, respectively, with the explicitly parameterized downdraft current and the updraft overshooting above of the equilibrium level (Kain and Fritch, 1990). The Kuo scheme presents a simpler convective latent heating vertical structure (Fig. 12a), with a maximum near 600 hPaand a very narrow cooling layer near the surface due to the moist adiabatic ascent from the surface (Geleyn, 1985).
Vertical profiles of large–scale latent heating show a maximum at 500 hPa that is greater than convective heating (Fig. 12a). Note that in the CKF experiment, the large–scale condensation produces greater heating in the layers where the KF convective heating is small. As result, in those cooled layers due the downdraft and cloud top overshooting, the total heating (convective plus large scale) at low (below 700 hPa) and upper (above 280 hPa) levels is larger in the CKUO (Fig. 12b). The vertical structure of the total diabatic heating differences between CKUO and CKF experiments (Fig. 12b) is very similar to the potential temperature differences presented in Figure 11b. The stronger diabatic heating in the CKUO experiment might explain a better–defined initial cyclone development compared with CKF.
5. The cyclone mature phase
a. CKUO experiment
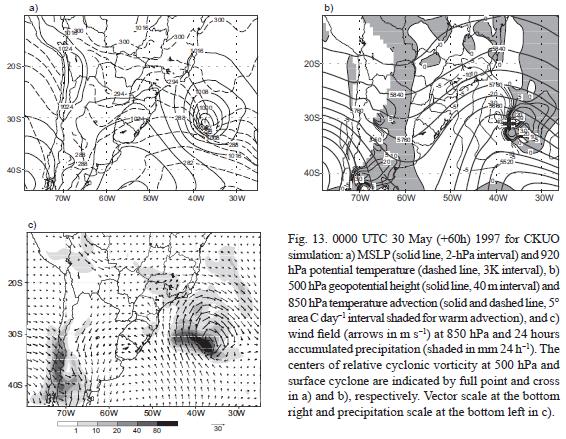
The MSLP and 920 hPa potential temperature fields simulated by CKUO experiment at 0000 UTC 30 May (Fig. 13a) show a stronger pressure gradient than the NCEP reanalysis (Fig. 6a) at the southwestern sector of the cyclone center. Near the cyclone center the warm (cold) air has shifted southward (northward) and there was an enhanced temperature gradient compared to the initial phase (Fig. 7a). The 850–hPa warm (cold) advection at the east (west) of the 500 hPa trough (Fig. 13b) is stronger than in the initial phase (Fig. 7a) and than in NCEP (Fig. 6b). The 850 hPa winds reach 30 m s–1 (Fig. 13c) and similar intense and broad cyclonic circulation is also present in the NCEP reanalysis (Fig. 4b). High precipitation rates are simulated in the center–south of cyclone (Fig. 13c), which is similar to the GPCP precipitation analysis (Fig. 4b). The CKUO mean precipitation rate overthe cyclone area is 8.3 mm 24 h–1 that agrees reasonable well with the GPCP analysis, which is 9.0 mm 24 h–1. The CKUO shows some areas of rainfall over the continent that is not present in the GPCP analysis. However some of these precipitation areas are partially supported by surface data (point values in Fig. 4b) and GOES infrared images (Fig. 6c).
b. Cyclone evolution
The NCEP reanalysis shows a zonal displacement of the cyclone that is well reproduced by the CKF experiment (Fig. 14a). At final simulation time (0000 UTC 30 May) the CKF cyclone center is about 140 km apart from the NCEP reanalysis position. The CKUO, FKF and FKUO tend to displace the cyclone southward compared to NCEP reanalysis, reflecting in a larger position error at final simulation time (about 370 km in the CKUO experiment). Comparing the CKF and FKF experiments one might infer that the use of CKUO as initial and boundary conditions has an important impact in the cyclone displacement, since the FKF cyclone positions are closer to CKUO than CKF positions until 1800 UTC 29 May.
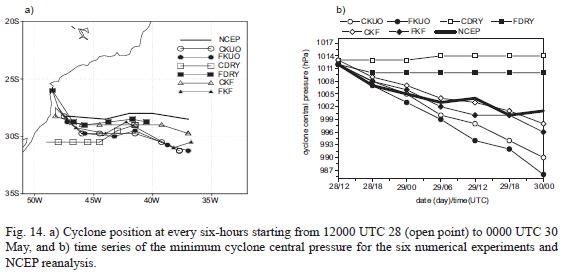
The CKUO and FKUO simulations show the cyclone moving southeastward with no notable differences between them. Similar results were found by McInnes et al. (1994) over southeast Australia, where the increase of horizontal resolution from 150 to 50 km does not lead to an improvement of the frontal position. Gyakum et al. (1996) comparing an ensemble of numerical models found out also little improvement in the position of one extratropical cyclone with the horizontal resolution increase from 50 to 25 km. In dry experiments (Fig. 14a), the cyclone displacement is lagged behind moist experiments and NCEP reanalysis about 12 hours, leading an error position of about 450 and 340 km in the CDRY and FDRY, respectively, at 0000 UTC 30 May. The resulting shallow and weaker circulation produce probably a slower cyclone displacement in dry experiments.
The time evolution of central pressure shows similar cyclone deepening rate in the moist experiments and NCEP reanalysis until 0000 UTC 29 May (Fig. 14b). After this time, the CKUO and FKUO simulate greater cyclone deepening, while in the CKF and FKF experiments the deepening rate is smaller and similar to the NCEP reanalysis. This implied that at final simulation time (0000 UTC 30 May) the cyclone intensity simulated by CKF is closest of NCEP reanalysis (Fig. 14b).
On the other hand in the CDRY and FDRY experiments no cyclone deepening is simulated and the central pressure keeps around of 1014 and 1010 hPa, respectively, that are higher than NCEP reanalysis (Fig. 14b). The lower central pressure in the FDRY is mainly attributed to the use of CKUO as initial and boundary conditions. Therefore one may conclude that diabatic processes are essential to simulate the development and evolution of this subtropical cyclone over SAO.
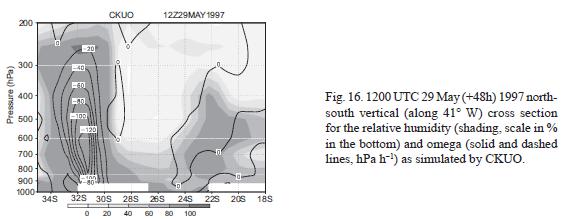
To summarize, Table II presents the mean and standard deviation (sd), spatial correlation (r), and the root mean square error (rmse) for the 850 hPa wind intensity obtained comparing the NCEP reanalysis and the numerical experiments. These indexes were calculated considering the grid points inside the fine mesh domain (see inner box in Fig. 1). The NCEP reanalysis shows the increase of both wind intensity and variability (as measured by standard deviation) between 1200 UTC 27 and 0000 UTC 30 May. These characteristics are simulated by the moist experiments (CKUO, CKF, FKUO and FKF, but not by the dry experiments (CDRY and FDRY). Wind intensity in the moist experiments present larger spatial correlation with NCEP reanalysis than dry experiments. This high correlation indicates similar spatial distribution of wind intensity among NCEP and moist experiments that can be attributed to the better simulations of cyclone trajectories in the moist experiments. For all times, the statistical (mean, sd, r and rmse) indexes (Table II) indicate that the CKF simulates the 850 hPa wind field closer of the NCEP reanalysis, while the CDRY presents the worst results.
c. CKUO and CKF differences
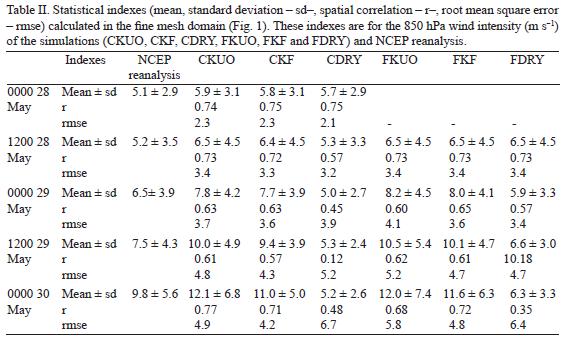
At 1200 UTC May 29, the resulting distribution of CKUO minus CKF (CKUO–CKF) for the precipitation and MSLP fields, show a more intense cyclone and larger accumulated precipitation in the central–south part of the cyclone in the CKUO experiment (Fig. 15a). However, throughout the 24 hours period, the area–average accumulated precipitation over cyclone area is 9.8 mm 24 h–1 and 8.3 mm 24 h–1 for CKF and CKUO, respectively.
Vertical cross section along 41° W of CKUO and CKF experiments of temperature difference shows at the polar side of the surface cyclone (southern of 30° S) that CKUO is warmer than CKF below 300 hPa level and colder above. In response to greater low–mid levels warming there is a decrease of geopotential high below 500 hPa, which explain the larger cyclone intensity in the CKUO (Fig. 15a). To the north, between 30–26° S, the geopotential height falls in the CKUO experiment from surface up to high levels. At north of 26° S, in the cyclone warm sector, the CKUO experiment is relatively warmer, colder and warmer at low, medium and high troposphere, respectively, and shows a geopotential height decrease above 600 hPa.
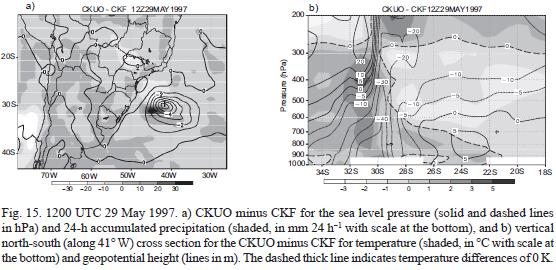
At the cold side of cyclone center (southern of 30° S) the upward motion extending from surface to upper levels is embedded in a very moist environment and it is more intense in the CKUO (Fig. 16) than in CKF (figure not shown). To the north of 30° S, the upward motion is weaker and the moist air is restricted to low levels (below 700 hPa), and above there is a deep layer of dry air layer, associated with the large scale subsidence at the cyclone western sector.
The differences in the vertical profile of Figure 15b are controlled by the differences in the vertical distribution of diabatic heating in the last 24 hours. The cyclone area–average (35, 23° S and 49.5, 34° W) of the latent heating profiles are ahown in the Figure 17. In the CKUO experiment the maximum convective heating is near 750 hPa (Fig. 17a), that is lower than 24 h before (Fig. 12a). This lowering occurs because the convection is triggering mainly in the center–north sector of the cyclone, where moist air is confined in the low troposphere (Fig. 16). According to Geleyn (1985) formulation of the Kuo scheme, the convective heating has a maximum where the moisture availability is larger. The CKF convective heating presents a more complex vertical structure (Fig. 17a), with two maximum: at 750 and 450 hPa. The 750 hPa maximum is associated with convection over the center–north of the cyclone, where the moist updraft currents penetrate into the middle troposphere dry environment. The 450 hPa maximum is attributed to the convective activity occurring in the moister environment in southern sector of cyclone, implying an updraft mass flux increase with height and convective heating maximization at upper levels. As the mass processed in the updraft decreased (Fig. 17a) compared with 24 hours before (Fig. 12a) there is a reduction of the upper troposphere cooling due to the cloud overshooting. At this time, the CKF shows strong cooling (–8 °C 24 h–1) due to the downdraft currents occupying a shallow layer near to the surface (Fig. 17a).
In both CKUO and CKF experiments, the large–scale latent heating has a maximum in the middle troposphere (Fig. 17a) and an increase compared to 24 hours before (Fig. 12a). The CKUO experiment total heating is larger along the vertical column (Fig. 17b), reaching 8 °C 24 h–1 near the surface. The downdraft effect considered in the KF scheme reduces the diabatic heating (Fig. 17b) and prevent the over deepening of cyclone (Fig. 14b). Other factor that contributes to less intense diabatic heating in CKF is the detrainment of updraft when penetrates in a dry environment with consequent reduction of the latent heating release (Fig. 17a, b). Both processes imply a more stable troposphere which inhibits the excessive diabatic heating and consequently the cyclone over deepening.
d. CKUO and CDRY differences
At cyclone mature phase, 1200 UTC 29 May, the MSLP field differences between CKUO and CDRY (CKUO – CDRY) show a large area around cyclone center of negative difference indicating a more intense cyclone in the CKUO (Fig. 18). As in the initial phase, the cross sections show weaker and widespread vertical motion in CDRY (figure not shown) compared to the moist experiments (Fig. 16 for CKUO). In the CDRY it is not possible to distinguish the narrow upward cell at south sector, as well as the large subsidence area at north of the cyclone simulated in the moist experiments (Fig. 16). In the absence of latent heating release the CDRY experiment is also unable to generate a reduction of horizontal scale of the upward motion area.
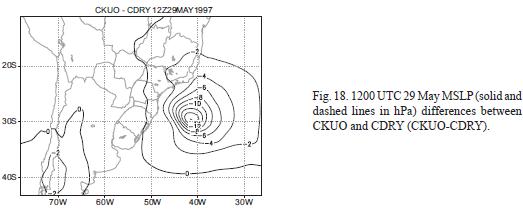
The present results show the importance of the diabatic heating on the development of subtropical cyclones. In dry case, the cyclone does not show the intense upward cell at cyclone cold sector, there is no deepening and the cyclone displacement is lagged behind compared with the moist experiments and NCEP reanalysis.
6. Mesoscale structures
The fine grid simulations, FKUO and FKF (Fig. 19) present mesoscale structures in the precipitation field that are not observed in the coarse grid simulations (Fig. 13c). The 24 hours accumulated precipitation (valid for 0000 UTC 30 May) in the FKUO and FKF experiments (Figs. 19a, b) is more intense at center–southern sector of the cyclone as well as in the coarse grid experiments. However, it can be noted that in the FKF experiment (Fig. 19b) the rainfall over the north sector of cyclone is more intense and widespread, while FKUO simulates more intense rainfall concentrated in a small area over the center–south of cyclone (Fig. 19a). Considering the same size area around the cyclone center, this implies an average precipitation of 12.8 mm 24 h–1 and 10.9 mm 24 h–1 for FKF and FKUO experiments, respectively, while the GPCP estimation shows 11.6 mm 24 h–1, i.e., both simulations are close to the value reported by GCPC.
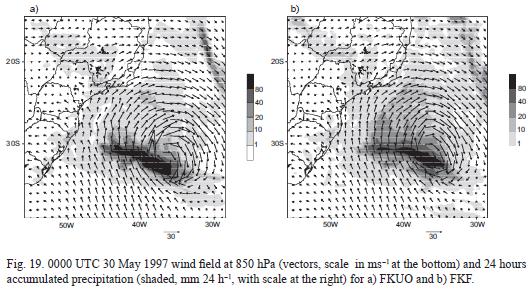
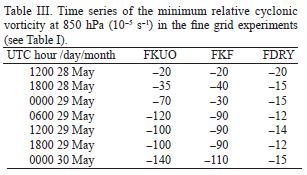
Figures 19a, b show that in the fine grid moist experiments the 850 hPa wind is intense around cyclone center and stronger than in the FDRY experiment (figure not shown). This implies that cyclonic relative vorticity attain values of the order of 10–4 – 10–3 s–1 at the cyclone mature phase in the FKUO and FKF experiments, meanwhile it is one order of magnitude smaller in the FDRY (Table III). The mature cyclone in the fine grid moist experiments show an intense and narrow upward cell lining to cold air side (figure not shown), which is not observed in the coarse grid and dry experiments. Another important mesoscale structure is the intensification of the descendent cell between middle levels and the surface around 32° S (figure not shown), which is due to the rainfall evaporation in the cold air cyclone sector. The FDRY experiment does not organize the upward cell at the center–south of cyclone center. As in the CDRY, in the FDRY the upward motion is weak and widespread around cyclone area.
7. Summary and conclusions
The Japan Meteorological Agency LAM was applied to examine the impact of convective (Kuo and KF) schemes and dry dynamics at different grid horizontal resolution on the simulation of a subtropical cyclone that developed over SAO during 27–30 May 1997.
The combination of Kuo scheme and a coarse grid size (75 km) has resulted in a better simulation of the cyclone initial development. This result can be attributed to the strong latent heating release that contributes to upward motion intensification and to decreases of surface pressure. If KF scheme is used, the cooling mechanisms due to the downdraft current and cloud overshooting reduce the total latent heating in the vertical column delaying in 3 hours the cyclone formation. The dry simulation fails to simulate the correct localization and intensity of the initial cyclone. Therefore, in contrast to intense extratropical cyclones, where the latent heating acts to reduce the system horizontal scale initiated by the baroclinic structure disturbance (Nuss and Anthes, 1987; Reed et al., 1988; Kuo et al., 1991; Balasubramanian and Yau, 1994, 1996), in the case examined here, the diabatic processes are essential to reproduce correctly the initial development phase of the system.
At mature phase the use of Kuo parameterization shows an over deepening of cyclone, while the KF simulates a cyclone intensity and displacement closest to NCEP reanalysis. This is attributed to the downdraft currents acting to cool the low levels and also to the development of convection in a dryer atmosphere. Both features act to stabilize the environment reducing the latent heating release to the atmosphere with KF scheme and simulating a weaker cyclone than in Kuo parameterization.
In the high horizontal resolution experiments (25 km) the Kuo parameterization simulates a more intense cyclone than obtained in coarse grid (75 km) and also in the NCEP reanalysis. No such impact occur using KF scheme, where there is small change of cyclone intensity with the increase of the horizontal resolution. This suggested that KF convective scheme is less sensitive to grid size resolution.
An important result which comes out from this study is that the latent heating release is an essential mechanism to this subtropical cyclone development. This characteristic differs from the classical cyclone development (Nuss and Anthes, 1987; Kuo et al., 1991), where diabatic heating only enhances the dry baroclinic development. Furthermore, for longer simulations (>24 hours) the KF parameterization scheme seems to be more appropriate since it provides a cyclone intensity and trajectory closer to the NCEP reanalysis. This result is also obtained through wind statistical analysis over the cyclone area.
A very different outcome regarding to previous studies (Kuo and Low–Nam, 1990; Kuo et al., 1996) is the excessive cyclone deepening with the Kuo parameterization, independent of the grid size used. The reason is that in the Kuo parameterization modified by Geleyn (1985), the level of maximum convective heating is function of the moisture availability in the vertical column. This can produce maximum latent heating at different levels that differs from previous studies using Kuo, where maximum heating occurs at upper levels (~ 300 hPa; Anthes, 1977; Kuo and Low–Nam, 1990; Kuo et al., 1996). In this case, the vertical motion at lower troposphere is relatively weak affecting the development of grid scale precipitation (Kuo and Reed, 1988; Kuo and Low–Nam, 1990; Kuo et al., 1996) and reducing the cyclone deepening.
Acknowledgements
This research was supported by the State of São Paulo Research Foundation (FAPESP) grants, under contract 95/04573–5R. One of the authors, RPR, wishes to thank the National Council for Scientific and Technological Development of Brazil (CNPq) for the financial support, under contract 476361/2006–0 and 307519/2008–2. Thanks also to the Japan Meteorological Agency for gently provide us the original model code used in this study.
References
Anthes R. A, 1977. A cumulus parameterization scheme utilizing a one–dimensional cloud model. Mon. Wea. Rev. 105, 270–286. [ Links ]
Anthes R. A., E.–Y. Hsie and Y.–H. Kuo, 1987. Description of the Penn State/NCAR mesoscale model version 4 (MM4). NCAR/TN–282+STR, National Center for Atmospheric Research, USA, 66 pp. [ Links ]
Balasubramanian G. and M. K. Yau, 1994. The effects of convection on a simulated marine cyclone. J. Atmos. Sci. 51, 2397–2417. [ Links ]
Balasubramanian G. and M. K. Yau, 1996. The life cycle of a simulated marine cyclone: energetics and PV diagnostics. J. Atmos. Sci. 53, 639–653. [ Links ]
Bhumralkar C. M., 1975. Numerical experiments on the computation of ground surface temperature in atmospheric general circulation models. J. Appl. Meteor. 14, 1246–1258. [ Links ]
Bonatti J. P., V. B. Rao and P. L. S. Dias, 2004. Estudo observacional da propagação para leste do fenômeno Catarina e sua simulação com modelo global de alta resolução. Annals of XIII Congresso Brasileiro de Meteorologia, Fortaleza, Ceará, Brazil. [ Links ]
Businger J. A., J. C. Wyngaard, Y. Izumi and E. F. Bradley, 1971. Flux–profile relationships in the atmospheric surface layer. J. Atmos. Sci. 28, 181–189. [ Links ]
Campos C. N., 1999. Estudo dafrontogênese em um ciclone do tipo Shapiro–Keyser. MSc Dissertation, Instituto Nacional de Pesquisas Espaciais, Brazil, 88 pp. [ Links ]
Carlson T. N., 1991. Mid–latitude weather systems. London, Harper Collins Academic, 507 pp. [ Links ]
Cresmann G. P., 1959. An operative objective analysis scheme. Mon. Wea. Rev. 86, 293–297. [ Links ]
da Rocha R. P., 1999. Impacto de Parametrizações de Convecção em Ciclogênese Sobre o Oceano. Ph. D. Thesis. Instituto Nacional de Pesquisas Espaciais–INPE, 201 pp. [ Links ]
Gan M. A. and V. B. Rao, 1991. Surface cyclogenesis over South America. Mon. Wea. Rev., 119 1293–1302. [ Links ]
Geleyn J. F., 1985. On a simple, parameter–free partition between moistening and precipitation in the Kuo scheme. Mon. Wea. Rev. 113, 405–407. [ Links ]
Grell G. A., 1993. Prognostic evaluation of assumptions used by cumulus parameterizations. Mon Wea. Rev. 121, 764–787. [ Links ]
Gyakum J. R., M. Carrera, D.–L. Zhang, S. Miller, J. Caveen, R. Benoit, T. Black, A. Buzzi, C. Chouinard, M. Fantini, C. Folloni, J. J. Katzfey, Y.–H. Kuo, F. Lalaurette, S. Low–Nam, J. Mailhot, P. Malguzzi, J. L. McGregor, M. Nakamura, G. Tripoli and C. Wilson, 1996. A regional model intercomparison using a case of explosive oceanic cyclogenesis. Weather Forecast. 11, 521–543. [ Links ]
Hoskins B. J. and K. I. Hodges, 2005. A new on Southern Hemisphere storm tracks. J. Climate 18, 4108–4129. [ Links ]
Huffman G. J., R. F. Adler, P. A. Arkin, A. Chang, R. Ferraro, A. Gruber, J. J. Janowiak, R. J. Joyce, A. McNab, B. Rudolf, U. Schneider and P. Xie, 1997. The global precipitation climatology project (GPCP) combined precipitation data set. Bull. Amer. Meteor. Soc. 78, 5–20. [ Links ]
Huo Z., D. –L. Zhang and J. Gyakum, 1996. The cycle of intense IOP–14 storm during CASP II. Part II: sensitivity experiments. Atmosphere–Ocean 34, 81–102. [ Links ]
Innocentini V. and E. S. Caetano Neto, 1996. A case study of the 9 August 1998 South Atlantic storm: Numerical simulations of the wave activity. Weather Forecast. 11, 78–88. [ Links ]
Iwabe C. M. N., 2008. Intrusão estratosférica associada com ciclogênesesna costa do sul do Brasil: uma análise utilizando o conceito de vorticidade potencial. MSc. Dissertation. Depatmento de Ciências Atmosféricas. IAG/USP, Brazil, 106 pp. [ Links ]
Kain J. S. and J. M. Fritsch, 1990. A one–dimensional entraining/detraining plume model and its application in convective parameterization. J. Atmos. Sci. 47, 2784–2802. [ Links ]
Kalnay E., M. Kanamitsu, R. Kistler, W. Collins, D. Deaven, L. Gandin, M. Iredell, S. Saha, G. White, J. Woollen, Y. Zhu, M. Chelliah, W. Ebisuzaki, W. Higgins, J. Janowiak, K. C. Mo, C. Ropelewski, J. Wang, A. Leetmaa, R. Reynolds, R. J. Roy and J. Dennis, 1996. NCEP/NCAR 40–year reanalysis project. Bull. Amer. Meteor. Soc. 77, 437–471. [ Links ]
Kondo J., 1976. Heat balance of the East China Sea during the air mass transformation experiment. J. Meteor. Soc. Japan 34, 382–398. [ Links ]
Kuo H. L., 1974. Further studies of the parameterization of the influence of cumulus convection on large–scale flow. J. Atmos. Sci. 31, 1232–1240. [ Links ]
Kuo Y.–H. and R. J. Reed, 1988. Numerical simulation of an explosively deepening cyclone in the Eastern Pacific. Mon Wea. Rev. 116, 2081–2105. [ Links ]
Kuo Y.–H. and S. Low–Nam, 1990. Prediction of nine explosive cyclones over the western Atlantic Ocean with a regional model. Mon. Wea. Rev. 118, 3–25. [ Links ]
Kuo Y.–H., M. A. Shapiro and E. G. Donall, 1991. The interaction between baroclinic and diabatic processes in a numerical simulation of rapidly intensifying extratropical marine cyclone. Mon. Wea. Rev. 119, 368–384. [ Links ]
Kuo Y.–H., R. J. Reed and Y. Liu, 1996. The ERICA IOP 5 storm. Part III: Mesoscale cyclogenesis and precipitation parameterization. Mon. Wea. Rev. 124, 1409–1434. [ Links ]
Liou C.–S. and R. L. Elsberry, 1987. Heat budgets of analyses and forecasts of an explosively deepening maritime cyclone. Mon. Wea. Rev. 115, 1809–1824. [ Links ]
McInnes K., J. L McBride and L. M. Leslie, 1994. Cold fronts over Southeastern Australia: Their representation in an operational numerical weather prediction model. Weather Forecast. 9, 384–409. [ Links ]
McTaggart–Cowan R., L. Bosart, C. A. Davis, E. H. Atallah, J. R. Gyakum and K. A. Emanuel, 2006. Analysis of hurricane Catarina (2004), Mon. Wea. Rev. 134, 3029–3053. [ Links ]
Mellor G. L. and T. Yamada, 1974. A hierarchy of turbulence closure models for planetary boundary layers. J. Atmos. Sci. 31, 1791–1806. [ Links ]
Nagata M. and Y. Ogura, 1991. A modelling case study of interaction between heavy precipitation and low–level jet over Japan in the Baiu season. Mon. Wea. Rev., 119, 1309–1336. [ Links ]
Ninomiya K., H. Koga, Y. Yamagishi and Y. Tatsumi, 1984. Prediction experiment of extremely intense rainstorm by a very–fine mesh primitive equations model. J. Meteor. Soc. Japan 62, 273–295. [ Links ]
Nuss W. A. and R. A. Anthes, 1987. A numerical investigation of low–level processes in rapid cyclogenesis. Mon. Wea. Rev. 115, 2728–2743. [ Links ]
Reboita M. S., 2008. Ciclones extratropicais sobre o Atlântico Sul: Simulação climática e experimentos de sensibilidade. Ph. D. Departamento de Ciências Atmosfércias, IAG–USP, Brasil, 316 pp. [ Links ]
Reed R. J., A. J. Simmons, M. D. Albright and P. Undén, 1988. The role of latent heat release on explosive cyclogenesis: three examples based on ECMWF operational forecasts. Weather Forecast. 3, 217–229. [ Links ]
Reed R. J., G. A. Grell, and Y. H. Kuo, 1993. The ERICA IOP 5 storm. Part I: Analysis and simulation. Mon. Wea. Rev. 121, 1577–1594. [ Links ]
Satyamurty P. and D. P. Bittencourt, 1999. Performance evaluation statistics applied to derived fields of NWP model forecasts. Weather Forecast. 14, 726–740. [ Links ]
Seluchi M. E. and A. C. Saulo, 1998. Possible mechanisms yielding an explosive coastal cyclogenesis over South America: experiments using a limited area model. Aust. Met. Mag. 47, 309–320. [ Links ]
Sinclair M. R., 1995. Climatology of cyclogenesis for the Southern Hemisphere. Mon. Wea. Rev. 123, 1601–1619. [ Links ]
Tatsumi Y., 1983. An economical explicit time integration scheme for a primitive model. J. Meteor. Soc. Japan 61, 269–288. [ Links ]
Vera C., P. K. Vigliarolo and E. H. Berbery, 2002. Cold season synoptic–scale waves over subtropical South America. Mon Wea. Rev. 130, 684–699. [ Links ]
Wang W. and N. L. Seaman, 1997. A comparison study of convective parameterization schemes in a mesoscale model. Mon. Wea. Rev. 125, 252–278. [ Links ]

