


Serviços Personalizados
Journal
Artigo
 Inglês (pdf)
 Artigo em XML
 Referências do artigo
 Enviar este artigo por email
Indicadores
-
 Citado por SciELO
 -
 Acessos
Links relacionados
-
 Similares em
SciELO
Similares em
SciELO
Compartilhar

 Permalink
Atmósfera
versão impressa ISSN 0187-6236
Atmósfera vol.22 no.3 Ciudad de México Jul. 2009
A comparison of two cases of low–latitude thundersnow
G. DOLIF NETO
Centro de Previsao del Tempo e Estudos Climáticos–Instituto Nacional de Pesquisas Espaciais, São Paulo, Brazil.
P. S. MARKET, A. E. BECKER, B. PETTEGREW, C. MELICK, C. SCHULTZ, P. I. BUCKLEY, J. V. CLARK, A. R. LUPO
Department of Soil, Environmental and Atmospheric Sciences, University of Missouri–Columbia, MO, USA.
Corresponding author: P. S. Market; e–mail: marketp@missouri.edu
R. HOLLE, N. DEMETRIADES
Vaisala Incorporated, Tucson, AZ, USA.
C. E. BARBIERI
Department of Parks, Recreation, and Tourism, University of Missouri–Columbia, MO, USA.
Received April 16, 2008; Accepted May 11, 2009
RESUMEN
Se examinan dos eventos de nevada con relámpagos en latitudes bajas a fin de identificar sus características. Ambos eventos se originaron a escala sinóptica y tuvieron impactos de pequeña escala (por ejemplo, ascenso orográfico e inestabilidad elevada). El primer evento ocurrió en el hemisferio sur y se desarrolló a finales del invierno influenciado por la orografía subyacente. Este evento presentó abundancia de relámpagos (94 destellos nube–suelo en la región); sin embargo, la acumulación de nieve fue insignificante. Este evento fue dominado por relámpagos con polaridad negativa, con una amplitud máxima promedio de –43.2 kA. El segundo evento fue un caso de convección elevada en el hemisferio norte con frontogénesis debajo de una capa extensa de inestabilidad potencial. Este evento también presentó abundantes relámpagos (706 destellos nube–suelo en la región), así como considerable acumulación de nieve sobre un área extensa. Este evento también fue dominado por relámpagos con polaridad negativa, con una amplitud máxima promedio de –23.7 kA. Ambos eventos ameritan mayor investigación dado que estudios sobre tormentas similares no son abordados frecuentemente en la literatura. Más aún, teniendo en consideración que las regiones cálidas sub–tropicales usualmente no están preparadas para enfrentar ni siquiera los efectos de pequeñas acumulaciones de nieve o hielo. En el futuro, los pronosticadores pueden anticipar mejor estos eventos anómalos observando las siguientes características generales: 1) sistemas climáticos sinópticos significativos y bien definidos enbajas latitudes; 2) una zona baroclínica fuerte con estructura de chorro superpuesta bien definida (>60 ms–1); 3) una extensión considerable y profunda de aire frío más próximo al ecuador de lo típico; y 4) una capa con humedad neutral a inestabilidad condicional sobre la zona frontal.
ABSTRACT
Two cases of low–latitude snow with lightning are studied to determine their characteristics. Both cases had synoptic–scale origins, but also featured smaller–scale influences (e. g. orographic lift and elevated instability). The first event occurred in the Southern Hemisphere and was a late winter case that developed under the influence of underlying orography. Lightning was plentiful in that event (94 cloud–to–ground flashes in the region), but snow accumulations were not significant. Lightning flashes of negative polarity dominated this case, with a mean peak amplitude of –43.2 kA. The second event was a Northern Hemisphere case of elevated convection, with frontogenesis beneath an extended layer of potential instability. Appreciable lightning occurred with this event as well (706 cloud–to–ground flashes in the region), and snow accumulations were significant over a broad area. Lightning flashes of negative polarity dominated this case also, with a mean peak amplitude of –23.7 kA. Each of these events is worthy of further scrutiny, as studies of such storms do not appear often in the literature. Indeed, such warm, subtropical regions are often unprepared for the effects of just a little snow or ice accumulation. Future forecasters can anticipate better such anomalous events by looking for these broad features: 1) significant and well–defined synoptic–scale weather systems at low latitudes, 2) a strong baroclinic zone with a well–defined (>60 ms–1) jet structure aloft, 3) cold air of appreciable depth and areal extent drawn much closer to the equator than is typical, and 4) a moist neutral to conditionally unstable layer above the frontal zone.
Keywords: Thundersnow, low–latitude, winter convection.
1. Introduction
Thundersnow can lead to deep snow accumulations and dangerous travel conditions in areas where it occurs (Crowe et al., 2006). Very often a middle–latitude occurrence (e.g. Market et al., 2002), these thundersnow storms can deposit anomalous snow totals, usually on human populations who are well–prepared to cope with their impacts (impassable roads, diminished emergency services, etc.) and return daily life to normal fairly quickly (chemical treatment of roads, physical snow removal, etc.). In short, thundersnow tends not to be a tropical or subtropical phenomenon. Yet, low latitude events do occur (e.g. Guinan 1988) –deep snow accumulations make it difficult for all, but especially problematic for those who live in areas totally unprepared for such severe winter weather. Until recently, snowstorms with lightning had received little attention in the literature; such events in lower latitudes have received even less.
The current study looks at two low–latitude snow events with lightning. One event occurred in the Southern Hemisphere in the Brazilian state of Santa Catarina. This event featured lightning and thunder during snowfall as a result of convection originating in the boundary–layer. This convection also occurred in association with a cold frontal passage and forced ascent over significant terrain; a moist neutral layer in the mid–levels was present as well. The second event considered occurred in the Northern Hemisphere over the state of Texas in the United States. This event featured lightning and thunder with elevated convection, the result of instability released above the frontal inversion well north of a surface cold front.
For these case studies, we employ a quasi–geostrophic framework for the synoptic analysis using observed data, along with output from the United States National Weather Service's Global Forecasting System (GFS). This approach is employed to promote a more uniform, larger–scale comparison of meteorological fields between the events. On the mesoscale, comparisons are made using initial fields from the GFS as well as observed data from radiosonde flights, lightning networks, and satellite observations.
Having introduced the topic, this brief paper will present both cases concurrently and in a similar fashion. In section 2, a synoptic overview precedes mesoscale analyses of the Southern Hemisphere case; the same approach is used in section 3 forthe Northern Hemisphere case. Concluding remarks on these two unique cases will be offered in section 4.
2. Case 1– Southern Hemisphere
2.1 Synopsis
On the morning of 12 September 2005, a brief thundersnow event occurred near São Joaquim, Santa Catarina, Brazil, (latitude: 28.29°S and longitude: 49.93°W). Lasting only a few minutes, the snow and thunder occurred between 1043 and 1115 UTC 12 September 2005 in São Joaquim (Cruzeiro), at an altitude of 1510 m and in the Morro da Igreja (latitude 28.12°S and longitude 49.49°W), at an altitude of 1828 m, with the surface weather station air temperature oscillating between –0.6 and +1.2°C. No measurable snowfall was reported at either station. Santa Catarina is located between latitudes 25 and 30°S, and with much of the state elevated above mean sea level by 500 m or more, snow is not unheard of there. Nevertheless, the unusual nature of this event demands further scrutiny.
The synoptic analysis begins aloft, where at the outset the parent cyclone was an aging, occluded storm and already quite deep (952 hPa), with a surface center far southeast of the thundersnow location (Fig. 1). The thundersnow event was situated beneath the equatorward, entrance region of the 300–hPa jet streak (Fig. 2a) embedded in quasi–linear flow. Wind speeds in excess of 60 ms–1 were found to begin north of 30°S, highlighting the subtropical origins of this jet streak. This arrangement suggests divergence aloft, and the encouragement of vertical motions over the Santa Catarina region. While across–stream ageostrophic winds and upper air divergence values were diagnosed in the appropriate quadrant at several levels (up to +6 x 10⁻⁵ s–1 at 300–hPa), they were maximized over the state of São Paulo, some 200–250 km to the north of the event site. The 300–hPa divergence values approached zero over Santa Catarina at 0000 UTC, but vertical motions were still robust in the lower troposphere, as the reader will see shortly.
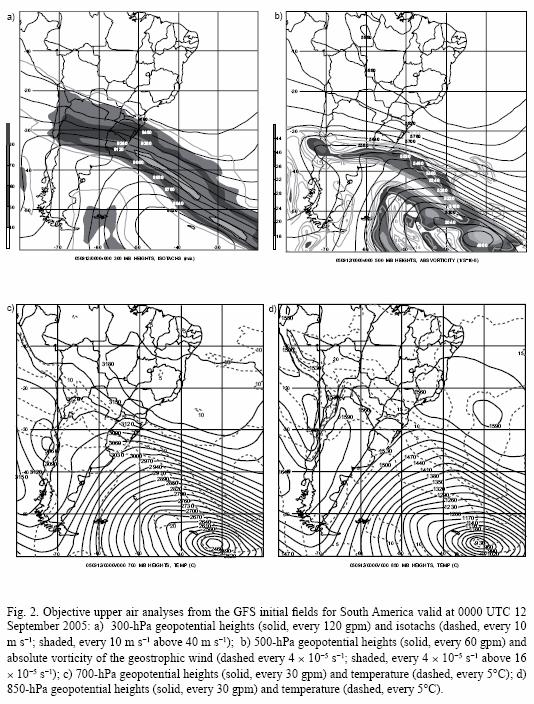
At 500 hPa, a closed low was found near 56°S 33°W (Fig. 2b). To the north and west, elongated trough and vorticity axes were diagnosed well south of Santa Catarina, over southern Uruguay. The 500–hPa level gives a clearer picture of the age of the parent cyclone in which this event occurred. In addition to the low heights (<4980 gpm) found with the cyclone center at this level, three distinct vorticity lobes were found along and behind the leading trough. Yet, the trough axis at more northern latitudes (and thus, over the continent) was located north and downstream of the one at 300 hPa, so some baroclinic organization was still in evidence at this time. In many ways, this system resembles the cold air surges described by Lupo et al. (2001).
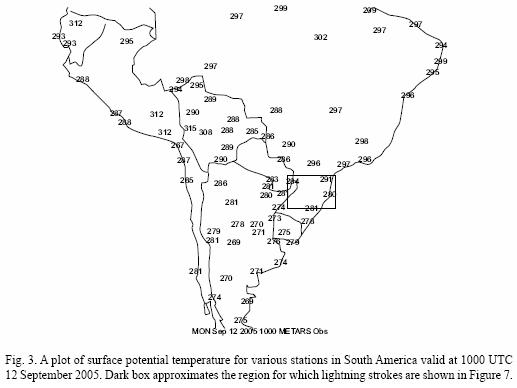
The vertical slope of the trough axis was in evidence at 700 hPa also (Fig. 2c), along with significant cold advection associated with the cold front at that level. However, note that this analysis was valid nearly twelve hours before the time of thundersnow in Santa Catarina, with the leading edge of the frontal zone at this level well south of the state at 0000 UTC. The vertical slope of the trough downward toward the warmer air persisted at 850 hPa (Fig. 2d), but frontal structure is more difficult to diagnose. While cold advection was clearly evident off the south coast of Brazil, the signature was weak at best for onshore locations to the south of Santa Catarina. Although the location where the thundersnow occurred was on the trailing edge of the surface cold frontal zone, a significant low–level thermal gradient accompanied this boundary, as evidenced by the surface potential temperature gradient across the Santa Catarina region at 1000 UTC (Fig. 3).
2.2 Mesoscale analysis
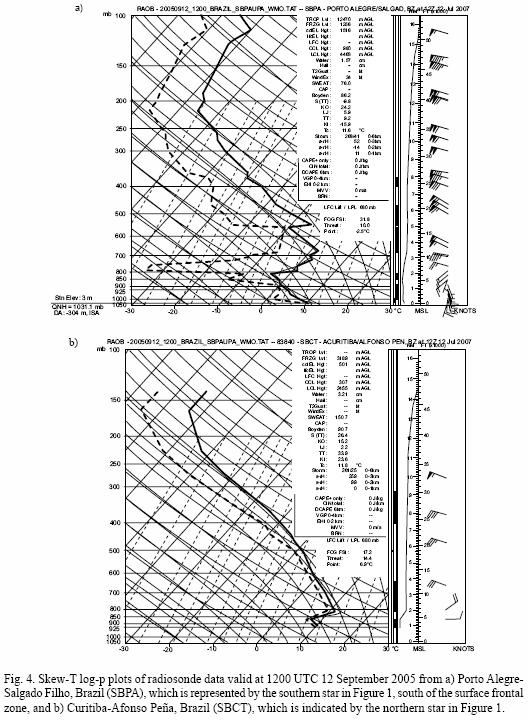
Two radiosonde ascents occurred nearby, just after the time of the thundersnow event. The first flight from Porto Alegre–Salgado Filho, Brazil (SBPA; latitude: 30.00°S and longitude: 51.18 °W), was south of the surface cold front location, thus representing the cold post–frontal air (Fig. 4a). The surface layer at SBPA was nearly dry adiabatic over the lowest ~100 hPa while winds veered from southerly to westerly through the lowest ~250 hPa, marking the top of the frontal inversion layer. The second radiosonde flight (Fig. 4b) occurred in the warm air north of the cold frontal zone, from Curitiba–Afonso Peña, Brazil (SBCT; latitude: 25.52°S and longitude: 49.17°W). Although an inversion was present and based some ~50 hPa from the surface (likely the remnants of a radiation inversion), winds backed from easterly to northwesterly, suggesting a warm advection signature ahead of the cold frontal zone. A deep, nearly moist adiabatic layer occurred with this sounding, but none of the stability metrics were particularly robust; even the convective available potential energy (CAPE) for a parcel lifted from the most unstable level yielded a value of zero. Thus, the cold frontal zone and thundersnow event occurred near the time of but between these radiosonde observations, neither of which revealed significant mid–level instability. Yet, the sounding for SBPA (Fig. 4a) was conditionally unstable over the lowest ~200 hPa. Along with onshore flow (Fig. 1) and orographic lift, this sounding (Fig. 4a) suggested conditions suitable for post–frontal, low–level convection. Meanwhile the SBCT sounding (Fig. 4b), farther north and ahead of the surface cold front, revealed a deep layer that is convectively neutral.
A cross section of the frontal zone (Fig. 5) revealed a well–developed baroclinic structure, with isentropes sloping down toward the warmer air, and veering winds in the lower troposphere from the warm side to the cold side of the front (cold southerlies south of the front and warm northerlies to the north of the frontal zone). The frontal zone intersected the surface of the earth (in a region where the terrain extends as high as ~900 hPa) near the center of this analysis (Fig. 5). A jet structure was present at 300 hPa with speeds in excess of 100 kt, aloft and poleward of the surface frontal location. In addition, a direct thermal circulation was suggested in the thinned (grid spacing of 2.5° latitude x 2.5° longitude) GFS fields, with ascent (<–3 µb s–1) embedded in a nearly–saturated region of the mid–troposphere just poleward of the surface frontal zone. Farther south, a region of descent (>3 µb s–1) was found just above the frontal zone and beneath the upper level jet streak. Finally, note that the best moisture and ascent not only occurred near the location of the surface frontal zone, but above a region of significant terrain and with a shallow layer of elevated potential instability.
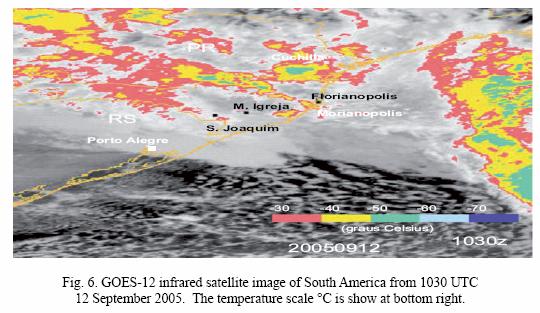
Satellite imagery (Fig. 6) showed the coldest over–land temperatures were found over the western reaches of Santa Catarina, with onshore cloud top temperatures generally warmer than –40°C. Nevertheless, the analysis of cloud–to–ground lightning flashes (Fig. 7) revealed a steady northward progression of the flash patterns that attended the motion of the frontal zone, with numerous flashes detected over Santa Catarina and Paraná during the period in question. Lightning flash frequency was never very high with this system, and was also on the decline between 0800 and 1100 UTC over the state of Santa Catarina. There were 47 cloud–to–ground lightning flashes over the entire state between 0800 and 0900 UTC, 27 between 0900 and 1000 UTC, but only 20 flashes between 1000 and 1100 UTC (the time period of interest) for the same area. Interestingly, no flashes occurred in the area after 1100 UTC, so we speculate that reports of thunder by human observers as late as 1115 UTC may well have been borne of in–cloud lightning flashes. Of the 94 cloud–to–ground flashes, 79 (84%) were of negative polarity and 15 (16%) were of positive polarity. Negative flashes had a mean peak amplitude of –43.2 kA (±33.6 kA); the median peak amplitude was –29 kA. Positive flashes had a mean peak amplitude of +38.1 kA (±17.5 kA); the median peak amplitude was +37 kA. The relatively widespread nature of these lightning flashes suggests that thundersnow may have been experienced more widely than was reported. However, that conclusion must also be tempered by the notion that the stations reporting thundersnow were at a relatively high altitude.

3. Case 2 – Northern Hemisphere
3.1 Synopsis
Thundersnow occurred along the Gulf of México coast of the state of Texas in the United States late in the day of 24 December 2004. Situated between 24 and 29°N latitude, snow totals of 31.8 cm and 11.2 cm were measured at Victoria, Texas, and Corpus Christi, Texas, respectively. Even Brownsville, Texas, on the US–México border measured 3.8 cm of snow. The thundersnow event that developed late on 24 December 2004 across southern Texas occurred in the wake of a previous cold frontal passage (Fig. 8); this surface frontal zone was supported by a significant long wave pattern in the mid– to upper–troposphere and a surge of cold air in the lower troposphere. By 0000 UTC 25 December 2004, a closed low had appeared over the Big Bend region of Texas at the 300–hPa level, with the Texas coast found beneath the axis of the subtropical jet (Fig. 9a). Indeed, the 300–hPa low and associated short wave trough lagged behind the larger longwave system, whose center at this time was far to the north over the Hudson Bay area. The development of the closed low was partially a response to the deep column of cold air that had become concentrated beneath the upper low, which will be discussed at greater length shortly. At 500–hPa (Fig. 9b), a distinct circulation was present in the vorticity field over the northern third of México, although a closed low was not present at this level. Cyclonic vorticity advection by the geostrophic wind was indicated downstream of the trough axis, although the signature was weak over coastal Texas. Of interest, too is the band of shear vorticity across the southern and eastern United States that served as a testament to the history of this system and the greater phase speed of the northern wave which, until recently, had been a part of the much larger long wave pattern.
In the lower troposphere, the cold–core signature of this cyclone became more clear with the broad shortwave trough at 700–hPa (Fig. 9c) beneath the ones found at 300 and 500–hPa and the coldest air found along 700–hPa trough axis. To the east over the Texas Gulf coast, only the southernmost tip of the state was above freezing at this level, but a broad thermal gradient was also observed along and parallel to the coastline. A similar thermal pattern was found along the Texas Gulf coast at 850–hPa (Fig. 9d), with the 0°C isotherm immediately along the coastline. At the surface (Fig. 8), a broad region of high pressure was positioned across northern Texas and northeastern México. The cold front that had moved through south Texas previously was analyzed at this time as a stationary front well south into the Gulf of México. An inverted trough was oriented perpendicular to the Texas Gulf coast in the vicinity of Corpus Christi, where near–freezing temperatures, wintry precipitation, and a moderate northerly breeze were observed.
3.2 Mesoscale analysis
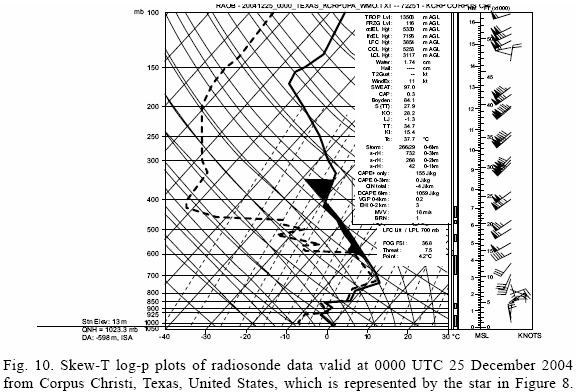
Cold, post–frontal air was present in the lowest ~250 hPa of the sounding from Corpus Christi, Texas (KCRP; latitude: 27.77°N and longitude: 97.50°W), flown at 0000 UTC 25 December 2004 (Fig. 10). Indeed, surface winds were northerly, becoming easterly with height and finally switching to a more southerly flow at and above the frontal inversion, demonstrating a clear profile of veering with height. While this would usually suggest the presence of warm advection (WAD) in the layer, diagnostics at 850 hPa failed to show a significant region of WAD at that level. Yet, the sounding revealed significant mid–tropospheric instability above the frontal inversion (Fig. 10). The 700–500–hPa lapse rate value of 7.3 K km–1 translated into a Lifted Index of–13 and a CAPE of 155 J kg–1, both for a parcel originating at 700 hPa; these values are in line with those found by Market (2006) for central US thundersnow events. This plot suggests a region that approached the criteria for a moist absolutely unstable layer (e.g. Bryan and Fritsch, 2000) and conducive to the development of upright convection.
Cross section analysis (Fig .11) revealed the presence of potential instability over a broad region above the frontal inversion. Moreover, this layer resided south of and above a region of mid–level frontogenesis (> 1.0 K 100 km–1 3 h–1), where the upward vertical motions were already in excess of 5 µb s–1. However, it is important to note that the occurrence of thundersnow went on well beyond 0000 UTC, and while the generation of upright convection dominated early on, at least one investigator (Morales, 2008) has shown that the stability regime eventually evolved, with slantwise convection becoming the dominant mode. Morales also showed that the magnitude and duration of the snowfall was promoted by a quasi–steady flow of dry, northerly air near the surface. This paper differs from that of Morales in that we emphasize the thundering nature of these events, and thus the sounding structure that makes the atmosphere conducive to lightning generation.
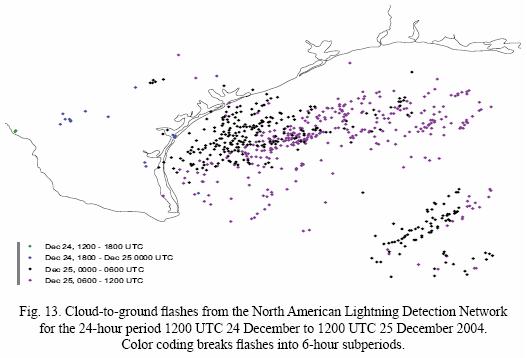
The satellite imagery appeared deceptively benign with the coldest cloud tops, associated with the larger cloud mass, found well off the Texas coast (Fig. 12). Small nascent cloud bands were beginning to emerge over southern Texas with cloud top temperatures of—40°C. Banding was present in the precipitation field, as rendered by radar (not shown), and lightning activity (as revealed by the North American Lightning Detection Network) attended these bands, the full history of which is shown in Figure 13. This event occurred over a much longer time period, so data for a full 24–hour period are supplied. Of the 706 cloud–to–ground flashes shown over the 24–hour period, 511 (72%) were of negative polarity, and 195 (28%) were positive. However, only 16 of the flashes shown in Figure 13 occurred onshore during this time. Therefore, the flash density and frequency were quite low for those onshore flashes that occurred primarily with snowfall. No real trend was apparent in the onshore flashes, although the period of peak activity was clearly between 1800 UTC 24 December 2004 and 0000 UTC 25 December 2004 (the blue dots). Of the 16 flashes that occurred well onshore, only one was positive and had a peak amplitude of +45.4 kA. The remaining 15 cloud–to–ground flashes that occurred well onshore had a mean peak amplitude of –24.2 kA (±17.2 kA); the median value was –17.2 kA. Being deeper into the cold season than the Southern Hemisphere case, it comes as no surprise that both the flash density and the flash frequency are lower with this event.
Freezing rain and other wintry precipitation were already occurring right on the Texas coast (Fig. 8). Yet, that lightning was occurring is in line with the sounding profile from KCRP at that time (Fig. 10), with the most unstable parcel originating with a temperature warmer than –10°C, and its vertical excursion extending nearly 4 km, with an equilibrium level at ~7 km AGL and a temperature of nearly –30°C. These elements of the vertical thermal profile are all in line with the experimental findings of Takahashi (1978) as well as later field investigations (Takahashi et al., 1999). Specifically, this thermodynamic profile allowed for a positively buoyant parcel through a deep layer. Also, such a convective cloud would cross over both the –10°C level (a known charge reversal temperature) and –20°C, a level known for active particle charging processes (provided adequate moisture; Takahashi et al., 1999).
4. Summary
Two cases of thundersnow are examined from the low latitude regions of both the Northern and Southern Hemispheres. The event over southern Brazil was marked by onshore and upslope flow near the surface, while the Texas coast event had no comparable topographic relief, and an offshore surface flow regime. The idea that terrain played a role in the Brazilian event is supported by the nearby soundings, both of which originate from close to sea level. Indeed, the post–frontal sounding from SBPA (Fig. 4a) is cold enough to support snowfall down to 1510 m MSL (and below), yet above, the profile is roughly isothermal about freezing up to –700 hPa. Moreover, the surface conditions evince an atmosphere that is quite unstable, suggesting that surface–based convection was likely. In conjunction with the other regional sounding (Fig. 4b), the Brazilian case appears to have been one of forced ascent over orography, with snow falling from a larger, parent stratiform cloud but with embedded convection.
The event over the Texas coast resulted from the release of elevated instability. It is true that the near–surface flow was offshore, and topographic relief of the kind in the Brazilian case does not exist in coastal Texas. Moreover, the Brazilian case had the benefit of a frontal zone in the immediate area, having passed through the region with thundersnow only hours prior. By contrast, the Texas thundersnow occurred north of a cold frontal zone that had moved through two days prior. More importantly, the thundersnow represented the release of elevated potential instability above the frontal zone.
To summarize, both of the cases were the product of significant and well–defined synoptic–scale weather systems at low latitudes. A strong baroclinic zone was also present in both cases, with a well–defined upper–tropospheric jet structure aloft in support of a lower–tropospheric front. In each case, cold air of appreciable depth and areal extent was drawn much closer to the equator than is typical. Yet, important distinctions existed between these cases on the smaller scale. In both events, a moist neutral thermal profile existed in the mid–troposphere, but external, low–level forcing for ascent was of much greater importance in the Southern Hemisphere event. That forecasters at low latitudes (and lower altitudes) find themselves in a situation where snow is likely or already occurring clearly indicates an anomalous event. It is not unreasonable, then, that such events may also possess dynamics sufficient to create heavy snowfall, and perhaps thundersnow.
Should the synoptic and mesoscale situation appear conducive to snowfall, then one may also assess the likelihood of thundersnow. On the larger scale, forecasters can anticipate such anomalous snow events by looking for these features: 1) significant and well–defined synoptic–scale weather systems at low latitudes, 2) a strong baroclinic zone with a well–defined ( >60 ms–1) jet structure aloft, 3) cold air of appreciable depth and areal extent drawn much closer to the equator than is typical, and 4) a moist neutral to conditionally unstable layer above the frontal zone. On the smaller scale, forecasters can anticipate a thundersnow event best via sounding or cross section analysis. It is desirable for the local atmospheric thermodynamic profile to: 1) be sufficiently cold (<0°C) throughout, 2) be unstable to vertical or slantwise perturbations, often above a stable layer (especially in the absence of orography), 3) have the most unstable parcel originate from a level where the temperature is warmer than –10°C, and 4) have the equilibrium level of the parcel in number 3 above extend to a level where the temperature is colder than –20°C.
Acknowledgements
The authors would like to thank the two anonymous reviewers whose efforts produced an improved manuscript. This work is supported by the National Science Foundation (NSF), Award No. ATM–0239010. Any opinions, findings, conclusions or recommendations expressed herein are those of the authors and do not necessarily reflect the views of the NSF.
References
Bryan G. H. and M. J. Fritsch, 2000. Moist absolute instability: The sixth static stability state. Bull. Amer. Meteor. Soc. 81, 1207–1230. [ Links ]
Crowe C. C., P. S. Market, B. P. Pettegrew, C. J. Melick and J. Podzimek, 2006. An investigation of thundersnow and deep snow accumulations. Geophys. Res. Lett. 33, L24812, doi: 10.1029/2006GL028214. [ Links ]
Guinan P.E., 1988. Acase study of an intense south Texas snowstorm during January 12–13, 1985. M. S. Thesis, University of Illinois at Urbana–Champaign, 103 pp. [ Links ]
Lupo A. R., J. J. Nocera, L. F. Bosart, E. G. Hoffman and D. J. Knight, 2001. South American cold surges: Types, composites and case studies. Mon. Wea. Rev. 129, 1021–1041. [ Links ]
Market P. S., C. E. Halcomb and R. L. Ebert, 2002. A climatology of thundersnow events over the contiguous United States. Wea. Forecast. 17, 1290–1295. [ Links ]
Market P. S., A. M. Oravetz, D. Gaede, E. Bookbinder, A. R. Lupo, C. J. Melick, L. L. Smith, R. Thomas, R. Redburn, B. P. Pettegrew and A. E. Becker, 2006. Proximity soundings of thundersnow in the central United States. J. Geophys. Res. 111, D19208, doi: 10.1029/2006JD007061. [ Links ]
Morales R. F., 2008. The historic christmas 2004 south Texas snow event: Diagnosis of the heavy snow band. Nat. Wea. Dig. 32, 135–152. [ Links ]
Takahashi T, 1978. Riming electrification as a charge generation mechanism in thunderstorms. J. Atmos. Sci. 35, 1536–1548. [ Links ]
Takahashi T., T. Tajiri and Y. Sonoi, 1999. Charges on graupel and snow crystals and the electrical structure of winter thunderstorms. J. Atmos. Sci. 56, 1561–1578. [ Links ]

