


Servicios Personalizados
Revista
Articulo
 Inglés (pdf)
 Artículo en XML
 Referencias del artículo
 Enviar artículo por email
Indicadores
-
 Citado por SciELO
 -
 Accesos
Links relacionados
-
 Similares en
SciELO
Similares en
SciELO
Compartir

 Permalink
Atmósfera
versión impresa ISSN 0187-6236
Atmósfera vol.22 no.3 Ciudad de México jul. 2009
Analysis of some meteorological variables recorded at 4000 m in the Argentinean subtropical Andean region
M. E. CASTAÑEDA
Departamento de Ciencias de la Atmósfera y los Océanos, Universidad de Buenos Aires/
Consejo Nacional de Investigaciones Científicas y Tecnológicas, Buenos Aires, Argentina.
Corresponding author: e–mail: eliza@at.fcen.uba.ar
N. RATTO
Museo Etnográfico Juan B. Ambrosetti, Facultad de Filosofía y Letras, Universidad de Buenos Aires, Buenos Aires, Argentina.
Received May 12, 2008; Accepted March 23, 2009
RESUMEN
Junto al Destacamento Las Grutas de Gendarmería Nacional, Provincia de Catamarca (26° 52' 35"S, 68° 18' 37"W, cota 4000 msnm) en los Andes Subtropicales, fue instalada una estación meteorológica automática en enero de 2004 por primera vez en la región. Desde abril a diciembre las condiciones meteorológicas en la montaña fueron observadas, a fin de tener una mejor comprensión de las condiciones atmosféricas en altura en la región. Este trabajo documenta el diseño, la instalación y operación de la estación, así como los primeros resultados de los análisis de los datos recogidos. Las variables analizadas fueron: temperatura del aire, temperaturas máxima y mínima, humedad, precipitación y viento, así como la presencia de nieve acumulada, registrada por el personal de Gendarmería. La mayoría de las variables ha presentado gran variabilidad interdiurna esperable debido a la ubicación geográfica. Los campos diarios de los reanálisis del NCEP/NCAR relacionan los casos de mayor variabilidad a irrupciones frías en el territorio. La frecuencia horaria de los vientos mostró direcciones preferenciales del SW–NW, presentando a fin de año una mayor variabilidad en la dirección que permite suponer un aporte de humedad a la región desde diferentes fuentes.
ABSTRACT
An automated weather station was installed in January 2004 for the first time at the Destacamento Las Grutas of Gendarmería Nacional, Province of Catamarca (26°52'35"S, 68°18'37"W, 4000 masl). From April to December, meteorological conditions on the mountain were observed in order to better understand the high–altitude subtropical meteorology. This article documents the design, installation, and operation of the weather station, and presents a discussion of the collected measurements. The analyzed variables were air temperature, maxima and minima temperatures, humidity, precipitation, wind, as well as the occurence of snow, registered by the staff at Gendarmería. Large daily variability was recorded in most variables, which is not unexpected given the geographical location. Daily fields of the NCEP /NCAR Reanalysis relate the dates of large variability to cold surges affecting the region. Hourly wind direction measurements show preferential directions of SW–NW, with the largest variability occurring during November and December, indicating that moisture enters the region from different sources.
Keywords: Subtropical Andes, temperature, humidity, atmospheric circulation, cold surges.
1. Introduction
Climate variability is closely related to fluctuations in atmospheric circulation. Knowing this variability has important implications, as extreme weather events may have potentially severe social and economic impacts.
Mountains represent excellent areas to detect climate change and the hydrologic cycle, as well as their impacts. The complex orography and the relation between the mountain environment and the socio–economical system introduce significant problems to climate impact studies. As a tool for evaluating current and future trends in regional climates, the current spatial resolution of general circulation models (GCM) is generally too poor to adequately represent details of the mountainous terrain in many regions (Beniston, 2003). Many of these impact studies require detailed regional topographic or ground cover information, as they are important factors determining the response to changes in the natural or anthropologically managed systems. Observations recorded by weather stations such as temperature, rainfall, and humidity are essential for undertaking regional climate studies.
In order to understand the atmospheric signals in the subtropical Andean region of Argentina, an experimental weather station was installed at the Las Grutas Station of Gendarmería Nacional (the National Border Police of Argentina) at 4000 masl, at 26°52'35"S, 68°18'37"W, in the Municipality of Fiambalá, Department of Tinogasta, Province of Catamarca (Fig. 1). The installation was achieved thanks to the participation and collaboration of Gendarmería Nacional and the Departmento de Ciencias de la Atmósfera y los Océanos of the Universidad de Buenos Aires, which provided the automatic weather station for one year, starting January 2004. The automated observations not only fulfilled the purpose of the investigation, but also constituted a substantial contribution to the meteorological community because it recorded over one year of measurements in a harsh mountainous climate. Furthermore, it proved to be useful to the tourism and mountaineering communities as well.
The main features of the synoptic climatology at high altitudes in this part of the Andes and neighboring areas were described in numerous papers (Schwerdtfeger, 1961; Gutman and Schwerdtfeger, 1965; Virji, 1981; Garreaud and Wallace, 1997; Garreaud and Aceituno, 2001; Garreaud et al., 2003, among others). The present study intends to contribute to the existing literature, by introducing information recorded in the Argentine Andes using an experimental weather station. This report includes the description of the weather station and how it operates, a discussion of the information obtained during the study period, and a preliminary analysis of the present circulation features that may be useful to infer past atmospheric circulation features. This experiment was unique as it was an interdisciplinary effort that involved the entire population of the area and was carried out at 4000 masl.
2. General aspects
The area of Las Grutas is located on a rocky and sandy outcrop, surrounded by high mountains: Cerro San Francisco (6016 m) to the west, the Incahuasi (6638 m) to the southwest and the Cordillera de San Buenaventura to the north (Fig. 1). This topography has created a significant influx of climbers to the region and the presence of the Paso San Francisco international border crossing, increased transit vehicles and tourism.
The region of interest, because of its extreme altitude, arid climate, and sparse population, has very few weather observations or records. The nearest meteorological station is located in Tinogasta (28°04'S, 67°34'W, 1201 m), with no representative measurements at a pressure level of nearly 600 hPa.
2.1 Design and operation of the weather station
Due to the strong winds prevailing in the area, it was necessary to build a special support structure for the weather station and corresponding electric installation. The Automatic Wired Davis Weather Station was installed on a structure consisting of two galvanized–iron masts that were anchored one meter deep in a concrete base. The larger mast supported the anemometer (cup and wind–vane); the smaller one supported the shelter and the rain gauge (Fig. 2). Two horizontal rods were added to support the structure and reduce the vibration caused by the wind.
The automated observations were recorded by the Vantage Pro Datalogger, which was located safely inside the Destacamento OF Gendarmería Nacional. Local inhabitants of the community of Fiambalá received reliable information twice a day on the weather conditions at the Paso San Francisco, thanks to the reports issued by the gendarmes (border police officers). Data could be accessed in real–time through a direct connection by means of a portable computer and specialized software. Therefore, on several occasions it was required assistance to place for information retrieval.
The station recorded the following variables, which are analyzed in the present paper: air temperature, dew point, maxima and minimum temperatures, relative humidity, rainfall, and wind direction and speed. Solar radiation and snow depth were not measured due to the lack of adequate instruments. The station began recording observations on January 6, 2004 and ended on January 8, 2005. Data were logged every 2 hours to ensure a significant amount of information per day. Snow depth was to be measured by the border police staff, as the weather station was not equipped with the corresponding sensor. The information contained in the police reports, however, only indicated whether snow had fallen or not.
Due to technical failures, all data from the first three months of the study period were lost (mid summer to mid fall). Certain features of the daily cycle could only be studied for winter, spring, early summer, and late fall. In addition, a total of 32 hours of data were lost, scattered between mid–April 2004 and early January 2005.
2.2 Additional data
In order to discuss synoptic aspects of the atmospheric circulation in the region, NCEP/NCAR Reanalysis (Kalnay et al., 1996) have been used. The reanalysis fields have a 6–hour resolution on a 2.5° latitude x 2.5° longitude grid and include all mandatory levels from 1000 to 100 hPa.
3. Results
3.1 Air temperature
Weather stations located in tropical regions usually experience relatively little variability throughout the year. Our station is located in a region and at an altitude which is greatly affected by the mid–tropospheric circulation and by the Andes.
Figure 3 shows the daily mean temperature, and absolute maxima and minima temperatures for the entire recorded period. The mean daily temperature was calculated as the average of the twelve air temperature values recorded during a day and it ranged from approximately –10 to +13 Celsius degrees. Due to the subtropical latitude and high elevation of the location, the daily range of the temperature varies from each month. The greatest variability was observed in May, with a standard deviation of 3.5°C, and an average range between the maximum and minimum temperatures of 14°C.

From September through the end of the recording the average daily temperature is always above 0°C while from May to August daily average values were below zero. The lack of registration information for a few days of July was due to technical problems that have not been identified. Although snow could not be measured, as mentioned, the cast members of the station related that during late July and early August there were heavy snowfalls but the temperature sensor was never covered with snow.
Between September and December, most of the absolute minimum temperatures were recorded at 8:00 h (all times are expressed as local time), while between June and August occurred between 8:00 and 10:00 h. The absolute maximum temperatures were registered generally at 16:00 h every month. The highest absolute maximum temperature was 21.3°C, at 16:00 h on December 8, 2004. We must remember that the time span two hours of recording measurements, from which the representative values of the variables are extracted.
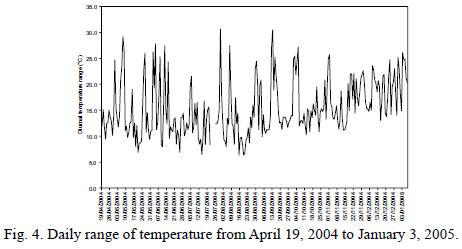
Winter appears as the most variable period, in terms of diurnal temperature range (Fig. 4), which values extended from 6 to 30°C. During this period, 11 days had temperature ranges greater than 20.0°C and 5 days, greater than 25.0°C. The lowest absolute minimum temperature was observed at 10:00 h on July 30 2004; on that day, the minimum absolute temperature reached –23.6°C. A composite of the corresponding daily geopotential height fields from the NCEP/NCAR Reanalysis showed a ridge to the west of the Pacific coast and a trough extending towards the southeast, from the subtropical region towards the South Atlantic. This configuration is similar to the "cold surge" cases described by Garreaud (2000). Other cold surge case studies over Argentina include Scian (1970), Cerne and Rusticucci (1997), Berman and Llano (2005). Campetella and Possía (2006) described the climatology of cut–off systems over the southern South American region; they pointed out the synoptic evidence of the relationship between cut–off low systems and rain and/or snow events over Argentina. An extreme case was reported in Hardy et al. (1998), where a polar air intrusion reached the Bolivian Altiplano and recorded as high as 6500 masl. More recently, Quispe and Ávalos (2006) described the life cycle of a cut–off, and a heavy snowstorm that left profound economic losses in Perú in 2004; this event does not appear in our registered data.
A typical cold surge occurred on July 30 2004, when the weather station recorded an average minimum temperature of –10.1°C. NCEP–NCAR maps of 600–hPa hourly geopotential height and wind speed, from 1200 UTC, 29 to 1800 UTC, 30 July, are shown in Figure 5. A deep trough dominated the circulation over most of Argentina during the previous day (Fig. 5 a–c). During the morning of July 30 the trough has positioned east of the country, with speed winds less than 10 m/s. Hourly surface observations provide additional data to validate the reanalysis. During the days associated with the cold surge, the weather station located at 4000 m.a.s.l. shows a sharp drop in temperature until it reaches the minimum value on July 30, at approximately 10:00 h. (Fig. 7c–d), from the previous day. The record exhibits smooth winds from WSW direction (Fig. 7 d–e), which favors the early morning cooling radiative, which results in a considerable minimum temperature. The Reanalysis also showed the strong subsidence in the region a few days earlier (Fig. 6), with consequent dryness at mid–levels (Fig. 7a), which in turn the records of the meteorological station verified (Fig. 7c).


3.2 Humidity
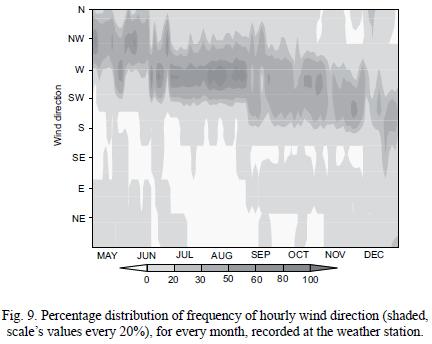
The atmospheric humidity on Las Grutas varies significantly during the study period with extreme values of relative humidity between 1 and 100%. The median relative humidity was below 40% throughout the entire period. In order to describe humidity in terms of a representative parameter, water vapor pressure is calculated and presented in Figure 8. In winter, August was the most humid month with relative humidity ranging from 14 to 33%. In general, stormy weather prevailed in August, as daily water vapor pressure variation was minimum (Lichtenstein 2005, personal communication). November and December showed the highest injection of water vapor in the evening hours; during those months the prevailing wind directions were more variable, with N and NE winds (Fig. 9) that could contribute with moisture from Brazil in the region. Hardy et al. (1998) found similar results in the Sajama; they considered that vertical turbulent transport of moisture from lower levels and advection at 400–500 hPa were responsible for those values.

In general, dry conditions characterized winter months; on an interdiurnal range, this is a period of high variability. These dry conditions were frequently interrupted by short periods of humidity, when cold surges reached these latitudes. As previously mentioned, there were several cold air intrusions during July and August. Quispe and Ávalos (2006) studied an intense event that year that affected the poorest regions of Perú.
In addition, August seems to register the highest amounts of rainfall, as much as what was observed in November and December combined (not showed here). In fact, in August there were snowfalls that, according to information provided in the reports issued by Gendarmería Nacional to the community, were relatively intense and longlasting. During the first week of August alone, the snow depth reached about 0.7 m. However, the weather station was not provided with the necessary instruments to melt the snow accumulated in the rain gauge. Therefore, this month's records must be carefully considered, as the data should be probably showing a combination of rain and snow. Besides the different seasonal cycle of humidity, there is a seasonality of the diurnal cycle. This results in seasonality of snow surface and rainfall evaporation. Water vapor pressure reached the highest values in the afternoon and the early hours of the day. During winter the atmosphere was relatively dry, but November and December show a moist atmosphere and high variability during the day.
3.3 Wind speed and direction
During the entire study period, the most frequent wind directions were SW–NW at all times of the day (Fig. 9). While these are the prevailing wind directions during winter, during the rest of the year there is more variability. As for May, NW winds prevail and as for July, the direction changes to westerly, persisting all day long. Recalling from Figure 8, November and December show the greatest humidity during the night. During these months, the prevailing wind direction showed the greatest variability, with winds from the NE and N which could bring higher humidity from Brazil into the region. Hardy et al. (1998) obtained similar results for the ice–capped Nevado Sajama, and they attributed them to the turbulent vertical transport of humidity from lower levels and to the advection at 400–500 hPa. During November and December, scarce rainfall was recorded and on those occasions, wind blew from the WNW and NE.
Wind speed (Fig. 10) in November, December, and early January was weaker compared to the total record; the summertime mean wind speed was 5.85 m/s. In winter, the increased humidity was apparently not due to the direction but to the intensity of the wind, as a rise in wind intensity causes a rise in humidity. This increase in the wind speed reflects a northward shift of the subtropical jet, which is typically found around 25°S in June.
The greatest mean hourly wind speed recorded was 99.8 km/h (about 28 m/s), on June 10 2004, and the maximum gust was 199.56 km/h (55 m/s) from the NW.
4. Conclusions
An automated weather station was installed in January 2004 next to the Las Grutas police station in the Paso de San Francisco international border crossing, Province of Catamarca. This is the first time that mountain weather conditions were recorded in situ in order to gain a better understanding of high altitude meteorology in this region. This paper reports on the design, the installation, and the operation of the weather station as well as the preliminary results of the analysis of the data. Technical problems reduced the length of the record period from 12 to 8 months.
Mean daily temperatures were above 0°C in spring and early summer and below 0°C during the rest of the year. Winter was the most disturbed period. Atmospheric humidity varied significantly during the period under study. The median relative humidity was below 40%. The daily median of water vapor pressure showed that August was the most humid month of the winter. In addition, rainfall in August was 1.8 mm, which was greater than the rainfall observed in November or December. In fact, in August there were snowfalls which according to the reports were relatively intense and longlasting.
While the estimation of the atmospheric circulation over mountainous regions by GCM is still under debate, these results reflect the importance of recording observations of meteorological variables in such regions. This was a unique experience, as it was an interdisciplinary effort that involved a whole community at 4000 masl.
While many researchers always discusses the approximation of the global models to represent the atmospheric circulation in mountainous regions, these results reflect the importance of obtaining in situ observations of meteorological variables in regions that allow the opportunity to discuss the significance of their results. This was a unique experience, as it was an interdisciplinary effort that involved a whole community at 4000 masl.
Acknowledgement
The authors are grateful to two anonymous reviewers whose suggestions made possible numerous additions and improvements to this work. Funding for the Las Grutas weather station project was provided by Fundación Antorchas No. 14116–236 project. We thank the Departamento de Ciencias de la Atmósfera y los Océanos (UBA) for the weather station. We received technical support and effort from COMACO, Vialmani, Destacamento Las Grutas de Gendarmería Nacional.
References
Beniston M., 2003. Climatic change in mountain regions: a review of possible impacts. Climate Change 59, 5–31. [ Links ]
Berman A. L. and M. P. Llano, 2005. Primera incursión de aire frío del año 2005. IX Congreso Argentino de Meteorología (CONGREMET IX). 3 al 7 de octubre. Ciudad Autónoma de Buenos Aires, Argentina. [ Links ]
Campetella C. M. and N. E. Possía, 2007. Upper–level cut–off lows in southern South America. Meteorol. Atmos. Phys. 96, 181–191. [ Links ]
Cerne B. and M. Rusticucci, 1997. Estudio de la situación sinóptica asociada con la ola de frío extrema de febrero de 1996. Meteorológica 22, 5–17. [ Links ]
Garreaud R. D., 2000. Cold air incursions over subtropical South America: Mean structure and dynamics. Mon. Wea. Rev. 128, 2544–2559. [ Links ]
Garreaud R. D. and J. M. Wallace, 1997. The diurnal march of convective cloudiness over the Americas. Mon. Wea. Rev. 125, 3157–3171. [ Links ]
Garreaud R. D. and P. Aceituno, 2001. Interannual rainfall variability over the South American Altiplano. J. Climate 14, 2779–2789. [ Links ]
Garreaud R., M. Vuille and A. C. Clement, 2003. The climate of the Altiplano: observed current conditions and mechanisms of past changes. Palaeogeogr. Palaeoecol. 194, 5–22. [ Links ]
Gutman G. J. and W. Schwerdtfeger, 1965. The role of latent and sensible heat for the development of a high pressure system over the subtropical Andes in the summer. Meteor. Rundschau 18, 68–75. [ Links ]
Hardy D. R., M. Vuille, C. Braun, F. Keimig and R. S. Bradley, 1998. Annual and daily meteorological cycles at high altitude on a tropical mountain. Bull. Am. Meteorol. Soc. 79, 1899–1912. [ Links ]
Kalnay E., M. Kanamitsu, R. Kistler, W. Collins, D. Deaven, L. Gandin, M. Iredell, S. Saha, G. White, J. Woollen, Y. Zhu, M. Chelliah, W. Ebisuzaki, W. Higgins, J. Janowiak, K.C. Mo, C. Ropelewski, J. Wang, A. Leetmaa, R. Reynolds, R. Jenne and D. Joseph, 1996. The NCEP/NCAR 40–year reanalysis Project. Bull. Am. Meteorol. Soc. 77, 437–472. [ Links ]
Quispe N. and G. Ávalos, 2006. Intense snowstorm in the southern mountains of Perú associated to the incursion of cut–off low–pressure systems at Upper Level. Proceedings of 8 ISDHMO, Foz do Iguaçu, Brazil, April 24–28, INPE, 1945–1958. [ Links ]
Schwerdtfeger W., 1961. Stromungs– und temperaturfeld der freien atmosphäre über den Anden. Meteor. Rundschau 14, 1–6. [ Links ]
Scian B. V., 1970. Situación sinóptica asociada a las temperaturas extremas observadas en junio de 1967. Meteorológica 1, 22–37. [ Links ]
Virji H., 1981. A preliminary study of summertime tropospheric circulation patterns over South America estimated from cloud winds. Mon. Wea. Rev. 109, 599–610. [ Links ]

