Servicios Personalizados
Revista

Articulo
 Inglés (pdf)
 Artículo en XML
 Referencias del artículo
 Enviar artículo por email
Indicadores
 Citado por SciELO
 Links relacionados
-
 Similares en
SciELO
Similares en
SciELO
Compartir

 Permalink
Atmósfera
versión impresa ISSN 0187-6236
Atmósfera vol.22 no.3 Ciudad de México jul. 2009
Vulnerability of water resources in the face of potential climate change: generation of hydroelectric power in Colombia
J. E. OSPINA NOREÑA, C. GAY GARCÍA, A. C. CONDE, V. MAGAÑA
Centro de Ciencias de la Atmósfera, Universidad Nacional Autónoma de México,
Circuito Exterior, Ciudad Universitaria, México, D. F., 04510 México.
Corresponding author: C. Gay García; e–mail: cgay@servidor.unam.mx
G. SÁNCHEZ TORRES ESQUEDA
Universidad Autónoma de Tamaulipas, Facultad de Ingeniería Arturo Narro Siller,
División de Estudios de Posgrado, Centro Universitario Tampico–Madero
Tamaulipas.
Received January 20, 2008; Accepted March 6, 2009
RESUMEN
En este trabajo se identifican algunas variables climático–hidrológicas que mejor expresan la vulnerabilidad de los recursos hidrológicos a nivel de cuencas (Cuenca del Sinú–Caribe, Colombia); el análisis utiliza las salidas de algunos modelos de circulación general, corridos bajo diferentes escenarios de emisiones de gases de efecto de invernadero (A2 y B2). El IPCC ha generado diversos escenarios de emisiones de gases de efecto invernadero, reportados en el Informe Especial sobre Escenarios de Emisiones (SRES, por sus siglas en inglés), (IPCC, 2001); se utilizan modelos de reducción de escala (SDSM, Statistical Downscaling Model) que permiten observar los cambios climáticos a nivel local; se aplica el Sistema de Evaluación y Planeación del Agua (WEAP, por sus siglas en inglés), el cual es una aproximación integrada para simular sistemas del agua y orientar políticas de manejo, además de ciertos análisis matemáticos y aplicación de métodos estadísticos, así, el estudio visualiza y analiza la incidencia del potencial cambio climático sobre el sector hidroeléctrico, encontrando el grado de vulnerabilidad del mismo o cualquier sector que tenga el agua como fuente, brinda herramientas, estrategias y criterios para planear y direccionar las proyecciones en los diferentes sectores productivos. Los resultados predicen aumentos de temperatura máxima, media y mínima, por ejemplo, la temperatura máxima antes de finales de siglo podría aumentar de 1.3°C a 2.5°C en los escenarios A2 y de 0.9°C a 1.7°C en B2, se estima aumento de la precipitación aproximadamente hasta del 30.4% en A2 y 27.9% en B2, también se encontró el número de eventos extremos proyectados sobre umbrales previamente determinados, se estima el balance hídrico, y la relación de las variables anteriormente mencionadas con el aporte de caudal del río Sinu a la represa Urrá 1 y la generación de energía hidroeléctrica; encontrando cambios para el periodo 2010–2039 que pueden ir de 0.6 % a –35.2 % en la generación de energía hidroeléctrica, disminución en el aporte de caudal del Río Sinú a la presa en un rango de –2.3 % a –34.9 % y disminución del volumen almacenado en presa de –10.9 % a –29.4 % con relación al volumen máximo técnico (VMT), según el escenario analizado.
ABSTRACT
This work identifies some of the climate–hydrological variables that best express the vulnerability of hydrological resources at watershed level (Sinú–Caribbean Basin, Colombia). The analysis utilizes the outputs of some general circulation models runs under different scenarios of greenhouse gas emissions (A2 and B2). The IPCC has produced diverse scenarios of greenhouse gas emissions, reported in the Special Report on Emissions Scenarios (SPES) (IPCC, 2001). Statistical downscaling models (SDSM) are used that allow the observation of climate change at local level; the Water Evaluation and Planning System (WEAP), an integrated approach to simulate water systems and orient management policies, is applied as well as certain mathematical analyses and statistical methods. Thus, the study visualizes and analyzes the incidence of potential climate change on the hydroelectric sector, finding the degree of vulnerability for this or any other sector that relies on water as a source, and offers tools, strategies and criteria for the planning and orientation of projections in the different productive sectors. The results predict increases in maximum, mean and minimum temperatures, for example, the maximum temperature before the end of the century could rise from 1.3° to 2.5°C in scenario A2 and from 0.9° to 1.7°C in B2; an increase in precipitation is estimated up to approximately 30.4% in A2 and 27.9% in B2. The number of extreme events forecast is found over previously determined thresholds; an estimation is made of the water balance and the relation of the above variables to the Sinú River inflow to the Urrá 1 dam and the generation of hydroelectric energy. Changes in the generation of hydroelectric energy vary from 0.6 to –35.2% for the period 2010 to 2039, reduction in the Sinú River inflow to the dam in a range of –2.3 to –34.9% and a drop in the stored volume in the dam of –0.9 to –29.4 percent in relation to the maximum storage capacity (MSC), according to the analyzed scenario.
Keywords: Hydrological resources, watershed, general circulation models, downscaling models, hydroelectric sector.
1. Introduction
For Ángel et al. (1997), the environment is integral; the natural habitat and human medium are fundamental elements that envelop environmental management in infrastructure projects and productive activities. This last requires an unavoidably complex, ecological and social frame of reference. The integral environment must be conceived as a result of the interaction between natural and human media. Impact assessment aims, then, to prevent environmental degradation through the communication of better information to decision makers in order to prevent or mitigate the potential environmental consequences of development activities (Therivel et al., 1992; Wathern, 1994; Gilpin, 1995).
Climate change, according to the definition by the Intergovernmental Panel on Climate Change (IPCC, 2001), refers to any change in climate over time whether due to natural variability or as a result of human activity. This definition is thought to clash with that given by the Framework Convention on Climate Change (FCCC) according to which climate change is a change of climate attributed directly or indirectly to human activity, that alters the composition of the global atmosphere, and that is in addition to natural climate variability over comparable time periods. For the Instituto de Hidrología, Meteorología y Estudios Ambientales of Colombia, (IDEAM, 2000) this change can determine differences in the average values of a climate factor, that is, its change can be shown as a new normal climate and, therefore, lead to an adjustment in human activities.
In this sense, the analysis of future climate scenarios and the vulnerability of the different systems and sectors is essential, as well as the preparation of adaptation strategies. Gay (2000) analyzes and introduces basic elements for the construction of said future scenarios: vulnerability studies on different physical aspects such as meteorological drought, water resources, forest ecosystems and coastal zones; vulnerability studies on some productive sectors such as agriculture, energy and industry and on human settlements and population. Other relevant studies and research closely related to the above issues have been undertaken and developed by different authors (Gay et al., 1995, 1996, 2007, Conde et al., 1997; Magaña et al., 1997; Gay et al., 2007; Conde and Eakin, 2003).
Since approximately 81.2% of Colombia's electrical energy supply is hydroelectric (UPME, 2005), the study attempts to take an in–depth look at what is known about the impact of global warming on hydropower, in order to establish parameters to minimize its harmful consequences and prepare methodological proposals and mechanisms that minimize uncertainties during the planning and execution of infrastructure works and social policies. The goals of this work are to (i) bring elements and variables into environmental management analysis that lead to the determination of negative or positive effects due to the natural variability of the environment or in the face of potential climate change, and (ii) establish how the vulnerability of hydrological resources from climate change can directly influence the elements of supply and demand analysis (territorial generation and zoning) and the projections of electrical energy generation and transmission sectors and other related sectors.
2. Methodology
According to the Instituto de Hidrología, Meteorología y Estudios Ambientales of Colombia (IDEAM, 2001), Colombian climate varies as much along the length of the country as it does over time. This climatic diversity is determined largely by its geographical location and the physiographical features of Colombian territory; the diversity of the Colombian climate is an important resource for the country, and climate variations play an important role in different kinds of human activities.
Its geographical position places Colombia in the torrid zone or lower latitudes of the two hemispheres, crossed by the equator and under the influence of the northeast and southeast trade winds. These warm, humid air currents from subtropical latitudes of both hemispheres meet on a strip called the Intertropical Convergence Zone (ITCZ) which favors the development of cloud and rains (IDEAM, 2001). As a result, the climate is tropical: the four thermal seasons are absent; there are only prolonged summers and winters during which the rains are more frequent; days and nights are of almost equal length (CCO, 2003).
The study area is located approximately between latitude 7 and 10° north, and longitude 74.5 and 77° west, to the northeast of the Republic of Colombia.
In the Sinú–Caribbean Basin the monthly rainfall ranges from approximately 20 to 350 mm in some months with an annual average of 2212.0 mm. Maximum temperatures of 37.5, mean of 28.2 and minimum of 18.7°C are recorded.
2.1 Compilation of information
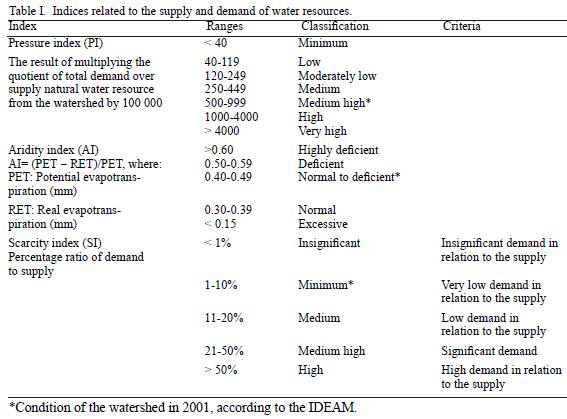
The criteria for the selection of the Sinú–Caribbean Basin in Colombia (Fig. 1), were the indices of scarcity, pressure and aridity, in relation to supply and demand of water resources (Table I), found in recent studies conducted by the IDEAM (2000, 2001). In this basin, three quarters (22 500 km2) of the total area (30 000 km2) of the watershed are affected by desertification processes and the majority of the forest and elements that protect and regulate water resources have been lost. Nonetheless, the watershed is dedicated in part to the generation and distribution of hydroelectric power.
Two meteorological stations were selected in the study area with the codes 1307502 and 2502524 with sufficient information for the purposes of this work. The stations have daily records of maximum and minimum temperatures and precipitation for over thirty years from 1964 to 2005 (IDEAM, 2006). It should be noted that only records from these two weather stations were taken into account, due to the difficulty in obtaining the data bases, and because they had the most complete records of all IDEAM data. These stations were therefore assumed to be representative of the whole basin, although it is clear that only two stations are not enough to characterize the whole basin.
The behavior of the climatic variables in the study area is analyzed as a baseline for later analyses and generation of scenarios.
The indexes in the table incorporate certain adjustments made by the IDEAM in order to improve estimation and visualization of the indexes in the Colombian context. For example, PI is the scarcity index (SI) multiplied by 100,000, and RET is estimated from the difference between precipitation and flow, a method known and validated by UNESCO.
2.2 Forecasts, simulation and comparison of models
Output from the atmosphere–ocean coupled general circulation model (AOGCM) of the Hadley Centre in the United Kingdom (HadCM3) (detailed information on the model can be found in Mitchell, 2004) for cell 7.5° N–75° W was used under two emission scenarios, A2 and B2. According to the IPCC (2001), the new scenarios serve as a basis to assess climatic and environmental consequences of future greenhouse gas emissions and to prepare mitigation strategies and adaptation to climate change alternatives.
Said scenarios represent the emissions that result from suppositions on the development of the planet in terms of economic and population increases and different avenues of technological development.
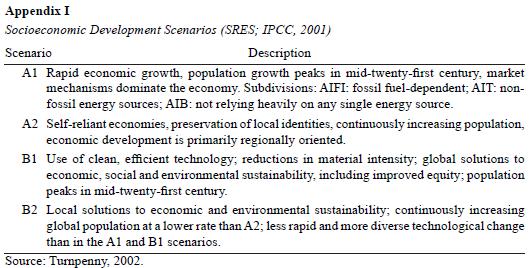
The A2 family scenarios, for example, describe a very heterogeneous world of different forms of self–reliance and conservation of local identities, a continuously increasing world population and regionally oriented economic development related to resulting technological changes (IPCC, 2001). The B2 family scenarios describe an emphasis on local solutions to economic, social and environmental issues leaning towards "sustainable" development; population growth is progressive but slower than in A2 (IPCC, 2001; Levy et al., 2004), with intermediate levels of economic development and less rapid and more fragmented technological change than in scenarios B1 and A1 (IPCC, 2001). This scenario is oriented towards environmental protection, improved equity and centers mainly on local and regional levels (IPCC, 2001).
The A1 family of scenarios supposes a future world of rapid economic growth, a world population that peaks around mid–century and then diminishes and a quick spread of new and efficient technologies. B1 scenarios project the same world population as in A1 but with rapid changes in economic structures towards a service and information economy and the introduction of efficient resources and technologies (see Appendix I).
Using the output from the HadCM3 model under emissions scenarios A2 and B2 (this latter having more environmental characteristics) and taking into account current climate characteristics, an analysis is made of the projected potential climate change at regional level and its incidence over hydrometeorological parameters for the periods 2010 to 2039 (2020s), 2040 to 2069 (2050s) and 2070 to 2099 (2080s), through the application of the SDSM (Statistical Downscaling Model) developed by Wilby and Dawson (2007), specifically on temperature and precipitation variables. A subsequent analysis finds its relation to water levels.
The SDSM enables the spatial reduction of predictor–predictand ratios using multiple linear regression techniques. The daily predictor variables provide broad scale information relating to the condition of the atmosphere, while the predictand describes local site conditions. The software facilitates the reduction task in a discrete number of processes:
1. The first task is to identify the broad scale predictor variables that show a significant correlation to the data observed at the station (predictand). A series of variables is included, for example, magnitude of air flow, meridional and zonal air flows and vorticity. These variables are used to determine the multiple linear relations between them and local data from the station (Wilby and Dawson, 2007).
2. After estimating the actual precipitation conditions in each station, various tests were carried out to compare the observed and estimated data in each station and their averages using the Statgraphics Plus 4.0 in order to observe whether or not there were any significant differences.
3. Using the database of Colombia's ISA (Interconexión Eléctrica S.A) of the flow from the Sinú River into the Urrá 1 reservoir, located in the study area, different regressions were tested to try to find the relation between the flows and other variables: maximum temperature (Tmax), mean temperature (Tmean), minimum temperature (Tmin) and cumulative monthly and annual precipitation (PCP). This procedure is carried out given that there are historical monthly records from 1960 to 2004 of the aforementioned variables and the flow at the dam site, enabling realistic relations between the variables.
4. Many models and scenarios differ in the projection of regional climatic variables (uncertainty); therefore, in order to obtain better information about these differences and be able to introduce them into the hydrological modeling process, the results of 17 models contained in MAGICC–SCENGEN were taken into account for the periods 2020s, 2050s and 2080s and scenarios A2 and B2.
In addition, the output from experiments carried out by the Canadian Institute for Climatic Studies (CICS) was analyzed for the scenarios reported in the SRES and the emission families A2 and B2 for the time periods mentioned above (http://www.cics.uvic.ca/scenarios/data/select.cgi).
2.3 Sensitivity and vulnerability of the hydroelectric generation system
1. The results allow the construction of a series of sensitivity scenarios in many sectors and/or systems, in particular the case of water resource/hydroelectric energy generation. Additional, more detailed information on the study area and the Urrá 1 dam was compiled for these scenarios such as: resource supply/demand, current population, population growth projections, technical and operative aspects of the dam, bathymetry and watershed evaporation, which are required input parameters for the WEAP application. The information was obtained from various Internet sources and in some cases given directly by staff members of the following institutions: Instituto Geográfico Agustín Codazzi (IGAC), Departamento Administrativo Nacional de Estadística (DANE), Unidad de Planeación Minero Energética (UPME), Consejo Nacional de Operación Sector Eléctrico (CNO) and Empresa Urrá.
2. Through the use of the WEAP, which allows the realization of integrated water system simulations and the orientation of policy management, various sensitivity experiments were conducted in the hydroelectric generation sector, according to the different climate projections determined beforehand.
WEAP functions using a basic principle of mass balance and can be used for municipal and agricultural systems, in a single watershed or complex river systems. WEAP can also simulate a wide range of natural and intervening components of these systems, including precipitation run–off, basic flows and groundwater recharge by precipitation, sectoral demand analysis, water conservation, water rights and allocation priorities, reservoir operations, hydroelectricity generation, pollution tracking and water quality, vulnerability assessments and ecosystem requirements. A financial analysis model allows the user to investigate project cost–benefit comparisons (Lee et al., 2005; Sieber and Purkey, 2007).
WEAP was chosen because of the intention to subsequently analyze the actual and projected water resource supply and demand ratio for the different uses and sectors in the 28 demand sites of the watershed, information that will be conveyed in future works.
3. Analysis and results
3.1 Current analysis and behavior of variables
Using data from the selected stations, the current behavior analysis of the climatic parameters or variables in the proposed study area is given below.
For stations 1307502 and 2502524, in the Sinú–Caribbean Basin, monthly precipitations are seen that range from approximately 20 mm to 350 mm; station 2502524 (Fig. 2) reports greater precipitation volumes.
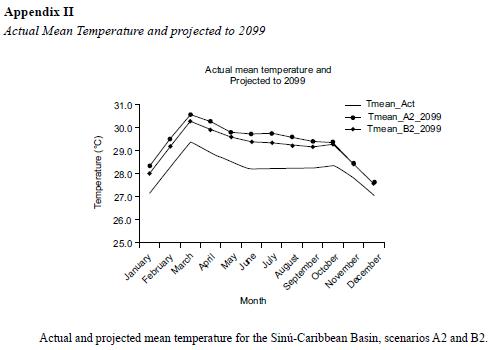
Maximum and minimum temperatures are higher in station 1307502 where less precipitation was recorded. The Tmax can be seen to oscillate between 35 and 37.5°C, and Tmin from 19 to 21.5°C depending on the month and station (Fig. 3a and b); the mean temperature lies between 27.5 and 29.5°C (Appendix II).
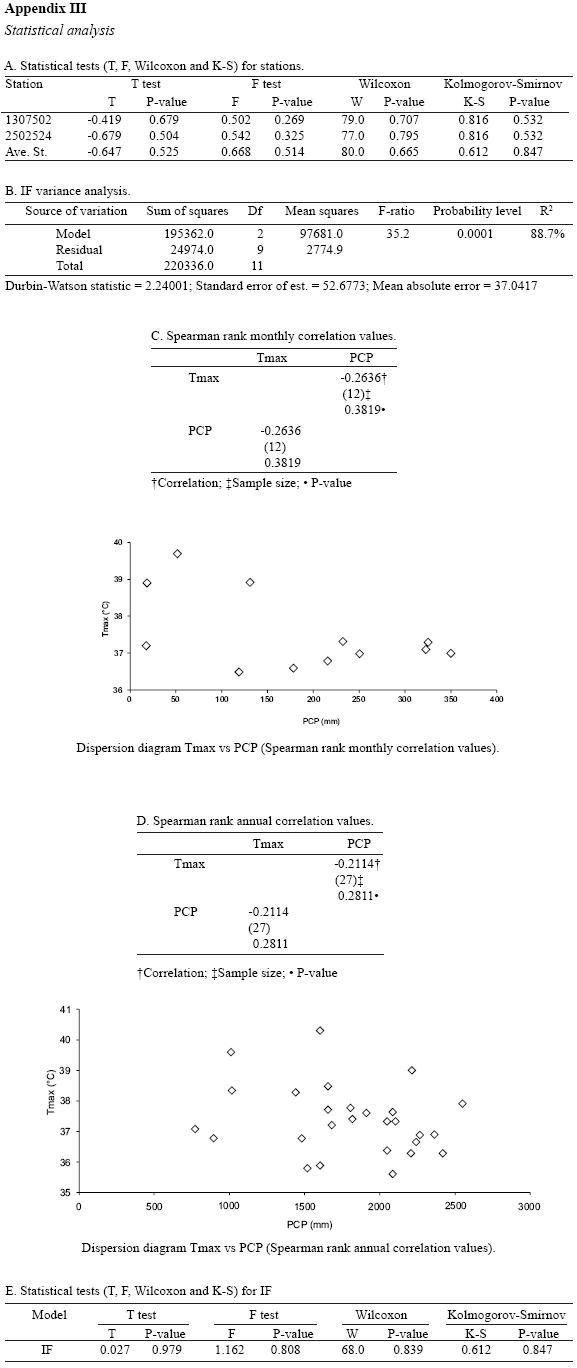
No significant differences were found, to 95 percent reliability, when the T, F, Mann–Whitney (Wilcoxon) and Kolmogorov–Smirnov tests were applied to actual observed and estimated precipitation data obtained using the SDSM, for each of the stations and their averages. These tests compare mean, standard deviation, median and sample distribution respectively (Appendix IIIA).
3.2 Projections
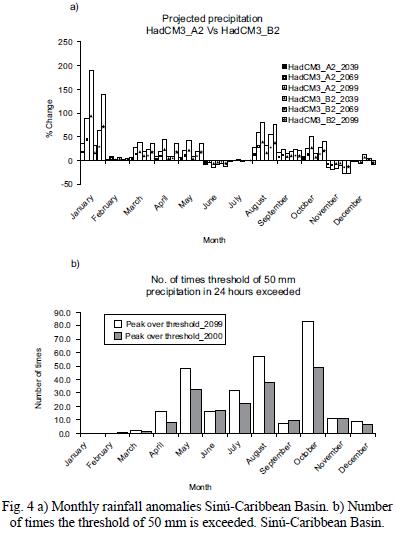
As can be seen in Table II, precipitation tends to increase in all the analysis periods and in almost all months of the year, except June, July, November and December, when a slight decrease is shown (Fig. 4a). Very similar projections are found in the comparison of scenarios A2 and B2. There are slight differences between them, scenario A2 having the most impact with projected increases of cumulative annual precipitation that are greater than those projected for scenario B2, especially for periods 2050s and 2080s (Table II).
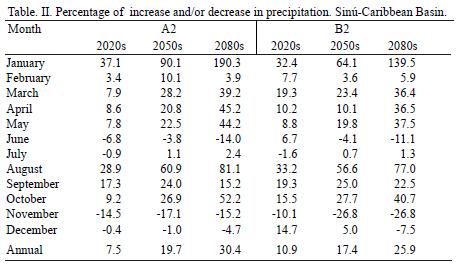
In line with the above, Bernal (2001), uses the downscaling method (canonic relations) and output values from the Community Climate Model (CCM3) general circulation model, and assumes a duplication of CO2 to estimate the changes in annual precipitation values for each of the 24 regions in Colombia. Bernal concludes that precipitation in the Sinú region is forecasted to increase by up to 41%. In contrast, the analysis of data projected by the Japanese model MRI/JMA with a 20 km resolution under scenario A1B for greenhouse gas emissions for the end of the century shows a predicted increase of 47.5% in the Sinú–Caribbean Basin. This agrees with the course of the possible precipitation changes in the region, i.e. the increase, and with the relatively close values of 30.4 and 25.9% found in this investigation for scenarios A2 and B2, respectively, for the end of the century.
One of the characteristics of the watershed in the study is its susceptibility to flooding produced by extreme rainfall that may occur in a specific site of interest or further upstream (IDEAM, 2001), hence the importance of the definition and study of the occurrence of extreme events.
Figure 4b shows the months and the number of times the 50 mm threshold was exceeded according to historic data on maximum 24–hour rainfall recorded in the region. A comparison of the number of times the threshold value is exceeded for the periods 1975 to 2000 and 2070 to 2099 (scenario A2), shows an increase in these events in the latter period.
In addition, taking into account the monthly average maximum temperature recorded in the stations in the watershed from 1964 to 2005 and the anomaly values for said variable (estimated using the output from the HadCM3 model and the SDSM application for scenarios A2 and B2), it is possible to project the behavior of the expected maximum temperature for periods 2020s to 2050s and 2050s to 2099 2089s.
Figure 5 shows the comparison of the maximum temperature (Tmax) calculated under the scenarios mentioned with the actual Tmax. Increases can be seen that go from 1.3 to 2.5°C in scenario A2 for the entire period, and from 0.9 to 1.7°C in scenario B2.
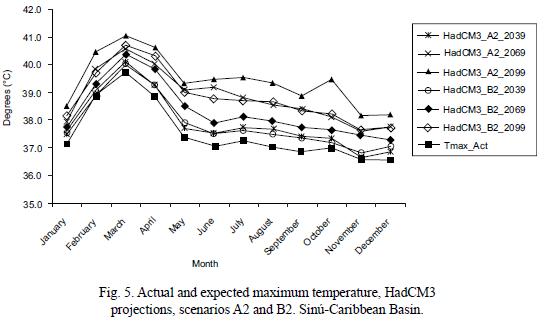
An analysis of the curves of scenario B2 for the period 2080s, superimposed onto that corresponding to scenario A2 projected to 2069, suggests a more rapid and much greater long term increase in maximum temperature in scenario A2 than in B2.
In relation to the actual mean temperature observed (historic average to 2005), the projections for the period 208s evidence an increase that ranges from 0.5 to 1.2°C for B2 and from 0.5 to 1.5°C for A2. It is important to note that scenario A2 shows the greater increases: up to 0.4°C in some intervals (Appendix II). Changes in the maximum and minimum temperatures could establish a new mean temperature pattern in the study area in the future making it an equally important parameter in the creation of adaptation, planning and watershed management strategies.
The above highlights the importance of policies, strategies and measures adopted in all productive and economic sectors as well as new technological advances and the construction of a new culture in order to diminish greenhouse gas emissions. These emissions show a greater increase in scenarios A2 (with the resulting implications on climate variables) than in B2.
3.3 Estimation of the Sinú river inflow to the Urrá 1 dam
With the analyzed variables (Tmax, Tmean, Tmin, cumulative monthly and annual precipitation) and using the database of inflow from the Sinú River to the Urrá 1 dam provided by ISA, various multiple regressions were performed taking the inflow as a dependent variable and the rest as independent variables. The following model was selected from the regressions:
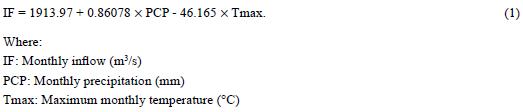
The model fit well finding a statistically significant relation between its variables at a reliability level of 99 percent; the Durbin–Watson (DW) statistic of 2.24001 suggests no autocorrelation of errors (Appendix IIIB). Spearman and Pearson correlation tests were also performed for precipitation and Tmax, finding no strong linear relation between the two variables; all the p–values are above 0.05 and, therefore, any other kind of relation can logically be ruled out (Apendices IIIC and IIID). After using model (1), comparison tests were performed between the observed and estimated values which showed no statistically significant differences for mean, standard deviations, median and sample distribution, to a reliability level of 95% (Appendix IIIE). The observed and estimated values are shown in Table III.
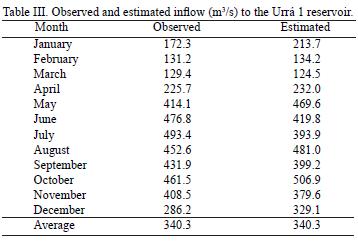
It should be pointed out that the independent variables used in the running of the model were the values obtained from the GCM output data and the SDSM application, which appear indirectly to indicate once again that the HadCM3 adequately explains the climatic behavior in the study region and that the SDSM is a suitable downscaling technique.
3.4 Comparison of models and sensitivity analysis of the system
Following the described methodology, the values given for the 17 models run through the MAGICC–SCENGEN program show that:
All the models project an increase in mean temperature in the study area. Certain differences were observed regarding precipitation: 70.6% (12) of the models showed an increase in the variable over time. Only 11.8% (2) projected reductions in all analyzed periods and 17.6% (3) showed changes that range from small increases at the onset of the period to small reductions at the end.
Figures 6a and b are dispersion diagrams of mean temperature and precipitation according to the 17 models used for scenario A2 in the study area.
The figures show the general tendency towards an increase in mean temperature in all the analyzed periods, while precipitation shows an ever greater dispersion over time, due mainly to the number of models that project a reduction in the variable, although in the majority of cases that reduction is relatively small. The scenario called HAD_A2_SDSM, is the result of the application of downscaling which, as the figures show, is located within the range of temperature and precipitation dispersion as a reasonably possible scenario, according to most of the models.
The output from the experiments carried out in the CICS for SRES scenarios and emission families A2 and B2 was also examined. Figures 7a and b illustrate the anomalies produced by the models and experiments which showed precipitation and maximum temperature values, since this last variable carries more weight for the calculation of inflow in formula (1).
As in the previous case, the maximum temperature increases in all the analyzed periods, while precipitation shows a growing dispersion over time: for 2039, 70% (7) of the experiments (solutions) projects, an increase in the variable and 30% (3) shows, a reduction; for the periods 2069 and 2099, 40% (4), projects, increases and 60% (6), reductions.
3.5 Sensitivity and vulnerability of the hydroelectric generation system
Various sensitivity experiments for electricity generation were conducted using the WEAP, according to the changes in inflow to the Urrá 1 dam calculated using formula (1) and data originating from the different climatic scenarios (Tmax and precipitation) determined earlier.
The net evaporation variable (evaporation – precipitation) was also introduced for which the annual evaporation at the dam site was calculated using the expression 75 x Tmean proposed by Visentini (1937), which, according to the author, is a good approximation for water bodies in elevations of less than 200 masl. This was later distributed month by month according to the percentage of monthly sunshine hours that are recorded at this latitude (see Appendix IV).
Table IV shows the values of the annual changes that can occur in the generation of electrical energy for the period 2010 to 2039, obtained from the different climate models including the so–called HadCM3_A2_SDSM (Appendix V).
Observing the values of the first column (changes relating to the reference scenario), only one model predicts small increases in the generation of electricity, the HadCM3_A2_SDSM with 0.6%. The rest indicate reductions that range from 0.7 to 35.2%. In the second column, however (changes relating to the maximum generation capacity), all the scenarios including the baseline indicate reductions in a range of 15.4 to 45.5%.
The reduction in inflow (column 5) is evident in all the studied scenarios, even though precipitation is projected to increase; similar results have been reported in different studies and important watersheds around the world such as: the Lerma–Chapala–Santiago watershed, that of the Pánuco River and Balsas River in México (Gay, 2000), and rivers in other parts of the world such as the Amazon, Mississippi, Congo, Ganges, Yenisei, Ob, and Amur (Axel et al., 2000).
It should be emphasized here that the increases in precipitation shown in some scenarios (column 4) for the period 2010 to 2039 are not yet particularly relevant and can be compensated by the rise in temperature, evapotranspiration and other related processes. In addition, a constant flow of 300 m3/s must be maintained downstream of the dam according to its regulations and technical and operative specifications, aspects that, in turn, have a combined influence on the reduction of electrical energy generation.
Likewise, although the frequency of spillover is projected to increase in some months of the year and this can be utilized to maintain volume levels in the dam, it must be remembered that this analysis was performed for the period 2070 to 2099 (Fig. 4b), while the analysis for the generation of electrical energy was performed for 2010 to 2039, taking into account the service life of the reservoir (Fig. 8a).
The decrease in inflow from the Sinú River to the Urrá 1 reservoir is directly related not only to the generation of electrical energy (Fig. 8a), but also to the reservoir storage volume (Fig. 8b).
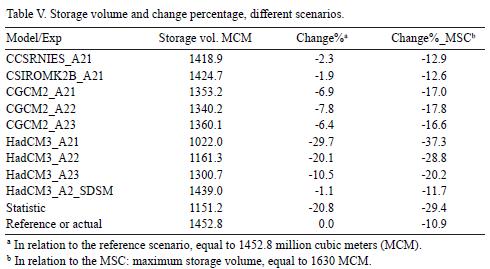
It is important to note that the reference scenario (actual) already reveals a reduction of 10.9% in the maximum storage capacity. Table V shows the average annual storage volume according to the different scenarios, the percentage of change in the reference scenario and the maximum storage capacity.
The reductions observed in the generation of electrical energy are of great importance when it comes to covering demand which, according to the (UPME, 2006), shows an average annual growth of 2.8% from 2000 to 2005. It should be emphasized that in 2005 the energy demand showed an accelerated increase of 5.8% and is projected to grow at an interannual rate of 3.3% on a national level for the period 2006 to 2025. Figure 9 illustrates the monthly behavior of actual and projected energy generation.
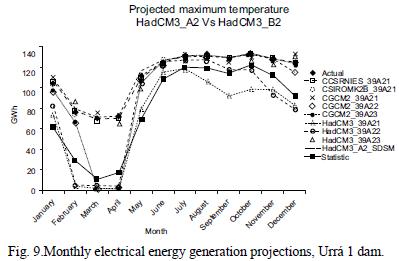
Figure 9 shows that the greatest reductions occur in the first quarter of the year, the most critical months being from mid–February to mid–April when temperatures in the study area are high and projected to be even higher (Fig. 5), while precipitation is scarce (Fig. 2).
The above suggests that the flow, electrical energy generation and stored volume of the dam must be carefully assessed month to month due to the projected changes in temperature and precipitation being different throughout the year (see Appendix V).
In this work, only the possible effects of climate change on water resources and the generation of electrical energy have been analyzed. Other factors which influence both of these either directly or indirectly, have not been taken into account: sedimentation and silting up of the dam, erosion processes, vegetative cover, changes in land use in the watershed, among others, all of which generate important synergies but are outside the purposes and scope of this investigation.
4. Conclusions
The methodology proposed in this investigation incorporates a variety of tools and models that enable the robust inclusion of potential climate changes and vulnerability analyses of water resources and related sectors at watershed level.
Although the HadCM3 scenarios appear in the analysis of uncertainties with extreme values, the application of downscaling places it as a reasonable model in the study area. The model should also be taken into account in environmental management and impact assessment, in the logic of prevention, avoidance if possible and if not, the mitigation of undesirable extreme impacts.
The analyses performed under scenarios A2 and B2 evidence the need to design policies and strategies and take efficient and effective measures to reduce greenhouse gas emissions.
The production of greenhouse gases alongside the characteristics and considerations of the A2 family of scenarios would imply, therefore, a more rapid and greater temperature increase and more marked changes in precipitation in relation to the changes observed in B2 scenarios, whose projections for the production of these gases are lower.
Although projections for the watershed in some scenarios show an increase in precipitation for all the periods analyzed and no great deficit in the water resource is observed, the inflow from the Sinú River to the reservoir, the stored volume in the dam and the generation of electrical energy will have to be carefully analyzed from month to month.
In the sensitivity analysis, the different scenarios allowed the stored volume in the dam to be determined in a range from approximately 10 to 15% (CCSRNIES_A21, CSIROMK2B_A21 and HadCM3_A2_SDSM), from 16 to 25% (CGCM2_A21, CGCM2_A22, CGCM2_A23 and HadCM3_A23) and greater than 25% (HadCM3_A21, HadCM3_A22 and statistic); inflow reduction ranges from 0 to 10% (CCSRNIES_A21, CSIROMK2B_A21 and HadCM3_A2_SDSM), from 11 to 20% (CGCM2_A21, CGCM2_A22, CGCM2_A23 and HadCM3_A23) and greater than 20% (HadCM3_A21, HadCM3_A22); the reduction in electrical energy generation falls between 15 and 20% (CCSRNIES_A21, CGCM2_A21, HadCM3_A23 and HadCM3_A2_SDSM), 21 and 30% (CSIROMK2B_A21, CGCM2_A22 and CGCM2_A23) and greater than 31% (HadCM3_A21, HadCM3_A22 and statistic).
The reduction in energy generation over time could result in higher production costs which may, in turn, be passed on to consumers, causing an imbalance in the supply–demand ratio that affects users and all sectors that depend on the water resource and the energy it generates.
Climatic variations as a result of global warming must be included in environmental impact studies and assessments, at sectorial level and in the planning, execution and scope of development projects since, as can be seen, these give clear indications of the vulnerability and/or potentiality of future systems, providing better information to planners and decision–makers which, in turn, may result in lower management costs, better contingency plans, disaster reduction and in the design and implementation of environmental strategies and policies.
References
Ángel S. E., S. I. Carmona and L. C. Villegas, 1997. Gestión ambiental en proyectos de desarrollo: una propuesta desde los proyectos energéticos. Fondo FEN, Santa Fe de Bogota, 290 pp. [ Links ]
Axel K., K. Fraedrich and M. Heimann, 2000. Green planet versus a desert world: estimating the maximum effect of vegetation on the land surface climate. Climatic Change 44, 471–493. [ Links ]
Bernal N., 2001. Aplicación del método de reducción de escala (statistical downscaling) al modelo climático global CCM3 en el territorio colombiano. Universidad Nacional de Colombia. Bogota, 119 pp. [ Links ]
Conde C., D. Liverman, M. Flores, R. Ferrer, R. Araujo, E. Betancourt and G. Villarreal and C. Gay, 1997. Vulnerability of rainfed maize crops in México to climate change. Clim. Res. 9,17–23. [ Links ]
Conde C., 2003. Cambio y variabilidad climáticos. Dos estudios de caso en México. Ph. D. Thesis Doctorado en Física de la Atmósfera. Programa de Posgrado en Ciencias de la Tierra, Universidad Nacional Autónoma de México, México, D.F., 227 pp. [ Links ]
Conde C. and H. Eakin, 2003. Adaptation to climatic variability and change in Tlaxcala, México. In: Climate change, adaptive capacity and development (J. Smith, R. Klein and S. Huq, Eds.). Imperial College Press, London, 241–259. [ Links ]
Gay C. (Comp.), 2000. México: Una visión hacia el siglo XXI. El cambio climático en México. Instituto Nacional de Ecología, UNAM, United States Country Studies Program, 220 pp. [ Links ]
Gay C., F. Estrada and C. Conde, 2007. Some implications of time series analysis for describing climatologic conditions and for forecasting. An illustrative case: Veracruz, México. Atmósfera 20, 147–170. [ Links ]
Gilpin A., 1995. Environmental impact assessment: Cutting edge for the twenty–first century. Cambridge University Press. USA, 200 pp. [ Links ]
IDEAM, 2000a. Estudio Nacional del Agua. Instituto de Hidrología, Meteorología y Estudios Ambientales, Colombia, 39 pp. [ Links ]
IDEAM, 2000b. La atmósfera, el tiempo y el clima. Instituto de Hidrología, Meteorología y Estudios Ambientales. Colombia, 80 pp. [ Links ]
IDEAM, 2000c. Flujo de materiales y energía en la economía colombiana., Instituto de Hidrología, Meteorología y Estudios Ambientales. Colombia, 52 pp. [ Links ]
IDEAM, 2001. Colombia: Primera Comunicación Nacional ante la Convención Marco de las Naciones Unidas sobre el Cambio Climático. Instituto de Hidrología, Meteorología y Estudios Ambientales. Colombia, 271 pp. [ Links ]
INE, 1995. Memorias del Primer Taller del Estudio de País: México ante el cambio climático. Cuernavaca, México. 1994. (Gay C., L. G. Ruiz, M. Imaz, C. Conde, Eds.). Instituto Nacional de Ecología, Centro de Ciencias de la Atmósfera, Universidad Nacional Autónoma de México, United States Country Studies Program. México. México, 101–111. [ Links ]
INE, 1996. Memorias del Segundo Taller del Estudio de País: México ante el cambio climático. Cuernavaca, México. 1995. (C. Gay, L. G. Ruíz Suárez, M. Imaz, C. Conde, B. Mar, Eds.). Instituto Nacional de Ecología, Centro de Ciencias de la Atmósfera, Universidad Nacional Autónoma de México, United States Country Studies Program. México. [ Links ]
IPCC, 2001. Special Report on Emission Scenarios. A Special Report of Working Group III. WMO, UNEP, USA, 27 pp. [ Links ]
IPCC, 2001a. Third assessment Report. Mitigation. Climate change. Contribution of Working Group III to the Third Assessment Report by the Intergovernmental Panel on Climate Change. WMO, UNEP, USA, 95 pp. [ Links ]
IPCC, 2001b. Third Assessment Report: Impacts, Adaptation and Vulnerability. Climate Change. Contribution of Working Group II to the Third Assessment Report, Intergovernmental Panel on Climate Change. WMO, UNEP, USA, 110 pp. [ Links ]
Lee A. H., J. Sieber and C. Swartz, 2005. WEAP. Water Evaluation and Planning System. Userguide. Stockholm Environment Institute, Tellus Institute, Boston, MA, 176 pp. [ Links ]
Levy P. E., M. G. R. Cannell and A. D. Friend, 2004. Modelling the impact of future changes in climate, CO2 concentration and land use on natural ecosystems and the terrestrial carbon sink. Global Environ. Change 14, 21–30. [ Links ]
Magaña V., C. Conde, O. Sánchez and C. Gay, 1997. Assessment of current and future regional climate scenarios for Mexico. Clim. Res. 9, 107–114. [ Links ]
MAVDT, 2004. Plan de Acción Nacional de Lucha contra la Desertificación y la Sequía en Colombia. Ministerio de Ambiente, Vivienda y Desarrollo Territorial. Bogotá, 124 pp. [ Links ]
Mitchell J. F. B., 2004. Environmental prediction. Science and Technology in the Meteorogical Office, UK, 38 pp. [ Links ]
Sajjad M.m., P. Coulibaly and Y. Dibike, 2006. Uncertainty analysis of statistical downscaling methods. J. Hydrol. 319, 357–382. [ Links ]
Sieber J. and D. Purkey, 2007. Water Evaluation and Planning System. User guide for WEAP21. Stockholm Environment Institute. US Center, USA, 219 pp. [ Links ]
Turnpenny J., 2002. Power, politics and science: Development of the UKCIPO2 climate change scenarios for the UK. Presentation at the AIACC Course on Development and Applications of Scenarios in Impacts, Adaptation and Vulnerability Assessments. Norwich, UK, April 15–26. [ Links ]
Wathern P., 1994. An introductory guide to EIA. In: Environmental impact assessment: theory and practice. (P. Wathern Ed.). Routledge, 3–30. [ Links ]
Wigley T. M. L., S. C. B. Raper, M. Hulme and S. Smith, 2001. The MAGICC/SCENGEN Climate Scenario Generator: Version 2.4, Technical Manual, Climatic Research Unit, UEA, Norwich, UK, 48 pp. [ Links ]
Wigley T. M. L., 2003. The MAGICC/SCENGEN. User–friendly software for GCM intercomparisons, climate scenario development and uncertainty assessment. National Center for Atmospheric Research, Boulder CO, USA. [ Links ]
Wilby R. L., C. W. Dawson and E. M. Barrow, 2001. SDSM – a decision support tool for the assessment of regional climate change impacts. Environmental and Modelling Software. In press. [ Links ]
Wilby R. and C. Dawson., 2007. SDSM 4.1 – A decision support tool for the assessment of regional climate change impacts. User Manual. London, UK, 93 pp. [ Links ]