


Servicios Personalizados
Revista
Articulo
 Inglés (pdf)
 Artículo en XML
 Referencias del artículo
 Enviar artículo por email
Indicadores
-
 Citado por SciELO
 -
 Accesos
Links relacionados
-
 Similares en
SciELO
Similares en
SciELO
Compartir

 Permalink
Atmósfera
versión impresa ISSN 0187-6236
Atmósfera vol.22 no.1 Ciudad de México ene. 2009
The risk of early and late frost behavior in central México under El Niño conditions
A. R. PERALTA–HERNÁNDEZ and L. R. BARBA–MARTÍNEZ
Centro de Ciencias Agropecuarias, Universidad Autónoma de Aguascalientes, Jesús María, Aguascalientes
Corresponding autor: A. R. Peralta–Hernández; e–mail: arperal@correo.uaa.mx
Received June 8, 2007; accepted October 7, 2008
RESUMEN
El problema de la presencia irregular de bajas temperaturas (heladas) en el centro de México (~19–23° N) causa pérdidas elevadas en la producción agrícola año tras año, afectando principalmente a cultivos que son sensibles a las temperaturas bajas con importantes implicaciones socioeconómicas. En el centro de México, existe carencia de estudios sobre las heladas en relación a su duración especialmente en respuesta al fenómeno de El Niño (EN). Debido a la accidentada orografía del terreno las estaciones climatológicas se agruparon en rangos de 300 m de altura, resultando cinco regiones: I, III, IV–VI con elevaciones de 875 a 2999 msnm, conformadas por 50 estaciones con datos de temperaturas mínimas diarias (< 2 °C) de 1960 a 1998. Nuestros resultados indican (aunque no significativamente) que durante años EN se presenta la primera helada en las cinco regiones bajo estudio y durante años neutrales (N) se presenta la última helada en las regiones más altas (IV–VI). Durante EN, el período libre de heladas (PLH) es más corto que para años N, excepto en la región VI donde fue más corto para años N. Se determinó también la ocurrencia de heladas con 20% de probabilidad de ocurrencia por regiones y para las estaciones con los PLH más cortos. Las pruebas de regresión entre las fechas de ocurrencia de heladas y la elevación, indican que la presencia de heladas está más correlacionada con la altitud del lugar que con los eventos EN y N; los lugares con mayor elevación presentaron PLH más reducidos comparados con los de menor altitud.
ABSTRACT
The irregular occurrence of cold temperatures (frost) in central México (~19–23° N) produces high agricultural losses each year; the greatest effect is on cold–sensitive crops, which has important socio–economic implications for the region. There is a lack of information on frost–related studies regarding the onset and duration of frosts in central México, especially in response to the El Niño (EN) phenomenon. Due to the land's irregular topography, the weather stations were grouped into 300 m range heights, resulting in five regions: I, III, and IV–VI with elevations from 875 to 2999 masl. Daily minimum temperatures (< 2 °C) from 50 weather stations and for each year from 1960 through 1998 were analyzed. The EN effect was evaluated by region comparing the frost–free period (FFP) for EN vs. neutral (N) events. Our results (although not statistically significant) show that the first frost occurs during EN years in the five regions under study; the last frost occurs in the highest regions (IV–VI) during N years. Also, during EN, the FFP is shorter than for N years, except in region VI where it was shorter during N years. The probability of frost occurrence at a 20% level was determined for stations with the shortest FFP. Regression analysis between frost periods and elevation show that frost occurrence is better correlated with elevation than with EN and N events; areas with higher elevation showed shorter FFP compared to areas with lower elevation.
Keywords: Central México, early frost, late frost, El Niño, frost–free periods.
1. Introduction
The EN event has emerged as one of the dominant topics in climatology issues over the past few decades. Changes in temperature and precipitation patterns among others have been associated with the EN phenomenon. The El Niño/Southern Oscillation (ENSO) phenomenon is a natural part of the global climate system and results from large scale ocean–atmosphere interactions that mainly occur in the tropical eastern Pacific (Allan et al., 1996). The eastern Pacific Ocean region, known as Niño–3.4 (4° N – 4° S latitude and 150° W–90° W longitude), corresponds to loci where atmospheric teleconnections begin, as quasi stationary waves that span into the western coast of both North and South America (Magaña and Ambrizzi, 2005). ENSO is an irregular and aperiodic phenomenon that tends to occur every two to seven years and is characterized by two well–defined phases: the warm phase named El Niño (EN) and the cold phase named La Niña (LN). Once it begins, the average event tends to last between 18–24 months and shows features of being strongly associated with the seasonal cycle (Philander 1985, 1989; Yasunari 1985; Allan et al., 1996). Years between EN and LN are named neutral (N) years.
According to Rasmusson (1985), Gray (1993), Glantz (1998), Barry and Chorley (1998) and Magaña (1998), El Niño builds up when there is an abnormal warming of the waters in the eastern tropical Pacific Ocean. This process is characterized by the change in direction of the easterly winds, which weaken or even become westerly winds. These conditions cause atmospheric instability off the South American coast, producing intense precipitation over the coast of Perú and Ecuador and floods. However, in other regions such as Australia or Indonesia, extreme hot and dry conditions are experienced.
When several criteria to define a frost are taken into account a correct definition of a frost is difficult to find. Thus, from the weather viewpoint Romo and Arteaga (1989) mention that a frost occurs when the air temperature measured at a 1.5 m height inside of a weather shelter is 0 °C. It is important to note that air temperature from the inside of a weather shelter is higher than that outside the shelter. Hence, the office of Comisión Nacional del Agua (CNA, 1993) uses the air temperature value inside the shelter of < 2 °C to give information on frost. From an agricultural viewpoint, a frost occurs whenever the air temperature decreases enough to kill the plants (regardless of whether its value is below, equal or above 0 °C).
The abnormal occurrence of frost in many areas in México is a big problem: every year, frost periods show different dates of occurrence; in certain years, frosts occur too early and in other years, frosts end too late causing much damage to plants. According to Romo and Arteaga (1989), frosts are classified according to the following criteria: a) time of occurrence (spring frost or late frost, fall frost or early frost) b) physical formation process (advection, radiation, mixed and evaporation) and c) visual effects (black and white frost).
Regarding the time of occurrence, late frost or spring frosts are the most dangerous because they may occur in May and even in June or July (mainly in high–altitude places) when crops are already in full development. Early frosts or fall frosts –unless occurring since late July, August or September– are not considered too dangerous because the spring–summer crops have finished their vegetative cycle and have already been harvested (October, November).
The physical process which gives rise to advection frosts is formed by huge masses of cold air moving down from northern Canada and the United States, frequently associated with the passage of a deep cyclone and a very well–developed cold front in advance of a strong anticyclone. Radiation frosts often occur in connection with slow moving anticyclones, in which the air is moderately cool and dry according to Blanc et al., as mentioned by Pérez (1990). According to this author, in terms of atmospheric dynamics, the formation of tropical cyclones in winter in the northeast of the Gulf of México has influence on the occurrence of early frosts in the Mexican plateau. Also, in every case, there is formation of anticyclones in central and northwestern México, causing clear skies, temperature drop and calm winds. In cases where cyclonic activity was reported, the states of Guanajuato, Estado de México, Puebla, Tlaxcala, Veracruz and Hidalgo were affected with killing frosts.
The complex dynamics of the lower and middle troposphere explains the formation of late frost in June or July. When troughs form in the northwestern and central United States, an anticyclone circulation develops and covers central and northwestern México. Also, tropical depressions can interact with troughs in the western Caribbean Sea. They move toward the northeastern United States and rapidly (several hours) a late frost may occur in the south central plateau, bringing killing frost to a large number of places in that region (Pérez, 1990).
On the other hand, Hastenrath as cited by Magaña et al. (1999) mentions that: "Nortes are the result of cold air accumulated in middle latitudes and intense meridional pressure gradients in the lower troposphere, thus resulting in large movements of cold air towards the tropics." Magaña et al. (1999) conclude that Nortes may occur in the period from October to May, causing temperature drops. Also, in the case of the El Niño phenomenon, the middle latitudes jetstream (in which cyclones of middle latitude are immerse), moves toward the south, causing a large quantity of cold fronts and rain in northern and central México.
Radiation frosts are much localized and are caused by the decrease of incoming solar radiation (in winter, days are shorter) and by the loss of heat by radiation (Romo and Arteaga, 1989); cloudy days and clear nights worsen the problem of localized radiation frost (Ahrens, 1993). Frost by radiation often occur in connection with slow–moving anticyclones in which the air is moderately cool and dry, as mentioned above (Pérez, 1989). Thermal inversions are common with these types of frosts because there is no wind to mix the cold and warm layers of air surrounding the soil surface; in these cases the air close to the soil surface is colder than that above.
Our working hypothesis is that during El Niño events the onset of frost periods starts earlier and frost periods are shorter than during N events.
2. Methodology
2.1 Study area
The study area is located in central México between 19 and 23° N, and 98 and 106° W, and 105 and 94° W (Fig. 1). This area is surrounded by two major mountain ranges, the Sierra Madre Oriental and the Sierra Madre Occidental. The former is a mountain range in northeastern México, spanning 1000 km long, 150 km average width, and 1500 m average altitude. The latter is an imposing mountain range in western México, spanning 1500 km long, 150 km average width and 2000 m average altitude (Sánchez, 1991). These geographical features greatly influence the spatial and temporal temperature patterns in central México. Most of the inner states in this study are located in the meridional plateau with an average altitude of 2000 m; other states are located at higher altitudes within the Eje Volcánico area, and others on the opposite side of the mountains, closer to the oceans and with lower altitudes. According to García (1988), the main types of climates are the arid climate in the central plateau, the wet temperate climate just below the central plateau, the tropical rainforest climate in the Gulf of México, the savanna climate in the inner part of the eastern coast and the tropical savanna in both coastal areas: the Gulf of México and the Pacific Ocean (with no occurrence of frosts).
2.2 Classification of El Niño and neutral years
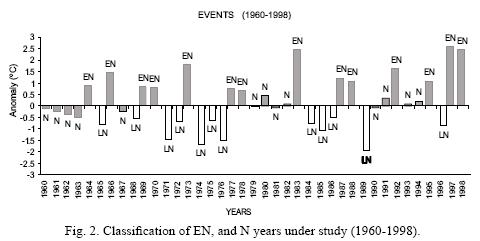
Monthly sea surface temperature data from the Climate Prediction Center (CPC) (ftp://ftp.cpc.ncep.noaa.gov/wd52dg/data/indices/ssti.indices, 2003) were used to classify the El Niño and neutral (N) years during the period 1960 to 1998. According to the Japan Meteorological Agency (JMA, 2003), an El Niño event occurs when the 5–month running mean (from October to February) of the spatially averaged tropical Pacific sea surface temperature anomaly (SSTA) satisfies the following criterion: 0.5 °C < SSTA < 2 °C. A neutral year occurs when –0.5 °C < SSTA < 0.5 °C (Izaurralde et al., 1999) and a La Niña year occurs when SSTA < –0.5 °C. Overall, 14 of the years from 1960 to 1998 were classified as El Niño and 13 were classified as neutral years (Fig. 2). The remaining years, such as 1964–1965 and 1967–1968, were thus classed as La Niña years. To classify the El Niño and N years we followed the JMA (2003) criteria to characterize the 5–month study from October through February, and used the SST indices derived from spatially–averaged SST anomalies over the tropical Pacific from the CPC.
2.3 Minimum temperature
Historical (1960–1998) daily minimum temperatures from 13 states and 50 weather stations with frost occurrence (T < 2 °C) (Fig. 1) were analyzed during EN and N events. The data were obtained from ERIC II (Extractor Rápido de Información Climática) provided by the Instituto Mexicano de Tecnología del Agua (IMTA, 2002). The data were placed in an Excel file to run it in the program SICA2.5 by Medina et al. (2003). The program SICA2.5 uses the methodologies of Ortiz (1987) which chronologically orders and codifies the first and last frosts; the program also uses the methodologies of Thom (1966) and Villalpando (1985), which process different percentages of frost probabilities. Because SICA assumes data possess a normal distribution, we applied the goodness–of–fit test of Kolmogorov–Smirnov (Barrow and Hulme, 1996) to prove that early and late frosts had a normal distribution, as was the case. The results given are dates of frost occurrence by using the Z–value, which includes the average and standard deviations of the series of years under study.
Prior to creating the daily databases, individual station data time series were evaluated for potential irregularities through time; weather stations with 30% or more of missing daily data were eliminated. In addition, stations with gaps of three or more years in between series were also discarded as were stations with clearly erroneous temperature values. Also, several stations were eliminated because they had no frost data due to their proximity to the ocean at lower altitudes on the windward side of the mountains, or because there were located in wet subtropical regions. In the end, we were left with 50 stations located throughout central México (Fig. 1). Then for each station and for each year, the first and the last frosts and the frost–free period (FFP) (i.e. the number of consecutive days from the day of the last frost with minimum air temperature equal or minor to 2 °C) were identified. In order to facilitate dealing with dates (days and months), we worked with Julian days, which makes it easy to determine the number of days between two dates (just subtract one Julian day number from the other). In order to know if the dates of early and late frosts during EN and N years were statistically different, a t–Student test analysis was performed.
The presence of low temperatures in a given place obeys many factors, the most important of which is altitude. Since the study site shows a very irregular topography producing high altitude gradients among weather stations, these stations were grouped into 300 m high ranges. These ranges were established because the resultant thermal gradient (temperature variation with altitude) shows good sensitivity for temperature variation (1.8 °C/300 m). Following the previous procedure, five regions were defined (Table I). There were no weather stations with elevations between the 1176–1476 m range belonging to region II. Even though region I has only two stations, we decided to leave it in the study. We did this so we could compare in further studies their frost behavior along with another stations located in different regions and whose altitude range is the same.

We followed a three–step methodology in order to know if EN had any effect on the number of early and late frosts and on the length (in days) of frost–free periods (FFP) as follows: a) a comparative statistical analysis by using t–Student tests for early and late frost occurrence and FFP; b) a 20% probability level of early and late frost occurrence; and c) an analysis of the length of the extreme FFP and its correlation to altitude (Rahimi et al., 2007).
In order for farmers to have a longer FFP to grow rainfed crops, they take a risk of 20% probability of frost occurrence; in other words, farmers take the risk of having a killing frost in one out of every five years. As an example, according to Table II, there is a 20% chance that the first frosts during EN years in region IV occur on September 10 or before; and the last frosts during EN years in region IV, occur on May 25 or later, instead of August 12 and April 30, respectively, as indicated on Table III. Thus, the FFP gets longer from 69 days (Table III) to 108 days (Table II). In other words, the 20% probability level of frost occurrence makes dates more suitable for farmers.


3. Results
According to its altitude, each station was grouped into five regions (I, III and IV–VI) from 875 to 2999 m, following the 300 m range elevation criteria based on a 1960 to 1998 length period (Table I). Then we performed a Kolmogorov–Smirnov test to show that both early and late frosts belong to a normal distribution. Also, for the same period of time we identified the early and late frosts in each region (Table III). Each region was analyzed separately to find the effects of EN vs. N events on the length of the FFP by finding the dates of the first and last frost (Table III).
Even though there were no statistical differences among the FFP between EN and N years (p < 0.05), there are important remarks to make about the patterns of early and late frosts during EN and N events per region: In regions with low elevations (I and II) (Table I) early frosts during EN events begin on Sep. 30 and on Oct. 12 in both Zacatecas' stations 32003 and 32019 (Table III). Thus, early frosts in both stations do not show any risk since their onset starts when most rainfed crops have already been harvested. However, late frosts at the same stations present a danger for crops since they end as late as May 17 and May 3, respectively, when their occurrence is close to planting schedules which begins roughly as soon as the rainy season gets established. Early frosts during N years begin on Oct. 7 and on Oct. 31 for stations 32003 and 32019, when most of rainfed crops have been harvested. Late frosts do not present a threat for rainfed crops either, because they end before the planting schedule on April 30 and on May 2 for the same stations, respectively. The FFP is shorter for EN years than for N years: 136 and 162 days vs. 160 and 182 days.
In region IV at Hidalgo's station 13006 early frosts during EN begin on August 12 and on August 10 during N years (Table III) when crops are in full development. Late frosts end as late as April 30 during EN and as late as June 25 during N years. In this case, late frosts become extremely risky during N years than during EN years, mainly in the early phases of crop development because of the presence of killing temperatures. The FFP is shorter for N years (46 days) than for EN years (69 days).
In the highest regions V and VI (Table I), it is very clear that the FFP are largely affected by early and late frost occurrences, making these regions at high risk for plant development in both events. In region V at Estado de México's stations 15059, 15073 and 15170, early frosts begin as early as on July 20 and late frosts occur as late as on June 4 during EN years as well (Table III). The previous dates allow a very short FFP of just 46 days for those stations. In addition, in region V at Hidalgo's station 13047, early frosts start on August 9 and late frosts end on June 18 allowing a FFP of just 52 days.
In region VI at Estado de México's station 15076, early frosts begin on July 25 and late frosts occur on June 4 during EN. The FFP in this station is 52 days (Table III). In the same region at Estado de México's station 15026 early frosts begin on July 24 and late frosts end on June 15 during N years allowing a FFP of just 39 days (Table III) for crop development. Such a short FFP in regions V and VI make farming almost impossible to deal with because of the occurrence of early and late killing frosts.
Because it is very important for farmers to count on reliable longer FFP without risking too much losing their crops due to killing frosts, a probability distribution at 20% level was performed. In other words, we analyzed FFP by each station within each region. In this section we discuss only results for stations with shortest FFP by region because those periods are the riskiest for crops development; other stations located in the same region with longer FFP, pose less risk of killing frosts as is shown in figures 3 through 7 [3, 4, 5, 6, and 7].


In region I (Fig. 3) Zacatecas' station 32003 had the shortest FFP during EN years with 136 days and 160 days in N years. However, the occurrence of early and late frosts at 20% probability level lengthens the FFP 34 days for EN and 25 days for N events (Table II). At this level of probability, EN shows shorter FFP than N events (170 and 185 days, respectively), thus helping crops to end their vegetative cycle without the risk of killing frosts.
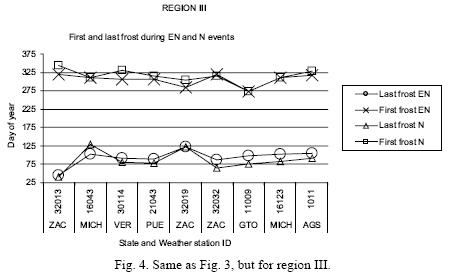
In region III (Fig. 4) Zacatecas' station 32019 had the shortest FFP with 162 days during EN years and 182 during N years. Nevertheless, the occurrence of early and late frosts at 20% probability level lengthens the FFP 28 days for EN and 28 days for N events (Table II). Here, EN again shows shorter FFP than N events (190 and 210 days, respectively), but still long enough to show suitable FFP for crop management (planting and harvesting dates) during both events.
In region IV (Fig. 5) Hidalgo's station 13006 had the shortest FFP with 69 days during EN and 46 days during N years. The occurrence of early and late frosts at 20% probability level lengthens the FFP 39 days for EN and 7 days for N events (Table II). That period of time is not long enough to broadly cover the vegetative cycle of rainfed crops (108 and 53 days, respectively) during both events. However, EN years seem to be more suitable for short cycle crop development, between 90 and 110 days.
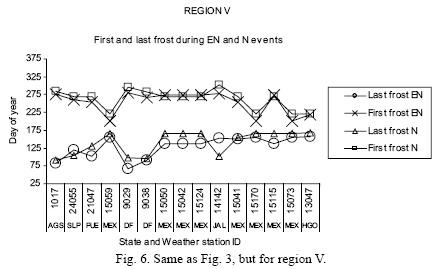
In region V (Fig. 6) three stations belonging to Estado de México 15059, 15073, and 15170 had the shortest FFP with 46 days during EN years and Hidalgo's station 13047 had the shortest FFP with 54 days during N years (Fig. 6). The high elevations of some stations from 2175 to 2319 masl, such as the ones located in Hidalgo and Estado de México, may also explain this temperature behavior. The occurrence of early and late frosts at 20% probability level in region V in Estado de México's stations lengthen the FFP 63, 66, and 63 days for EN years and 3 days for N events (Table II). Thus EN years bring more suitable dates for rainfed crops (109, 112 and 109 days) unlike N years that only showed a FFP of 55 days.
Stations with the highest elevations (>2485 m) belong to region VI (Table I and Fig. 7). In this region, Estado de México's station 15076 had the shortest FFP during EN years with 51 days. The occurrence of early and late frosts at 20% probability level in region VI lengthened the FFP 58 days during EN years from 51 days to 109 days (Table II). Also Estado de México's station 15026 had the shortest FFP during N years with 39 days. However, the occurrence of early and late frosts at 20% probability level during N years lengthened the FFP 70 days from 39 to 109 days (Table II). In both cases, the 20% probability level allows crop development for this region, at least for plants with short vegetative cycle, as mentioned before.
The early occurrence of late frosts (July) during both events in these regions poses a great risk of killing temperatures when an anticyclone circulation develops and covers central and northwest México in summer, as previously explained; thus, this poses a real threat for crops which cannot complete their vegetative cycle before late frosts begin showing up in July. Station 9026 in Distrito Federal (D. F.) shows an abnormal behavior compared to other stations in its group with a relatively long FFP. A possible explanation for that behavior could be the "heat island" effect which tends to raise the natural daily course of temperature. The 20% probability level of frost occurrence is extremely helpful mainly in high elevation places; this allows, particularly in those regions, a longer period of time for crops development.
On the other hand, early frost studies have explained the relationship between elevation and the presence of minimum temperatures, accounting for katabatic flow and cold, denser air accumulation (Laughlin and Kalma, 1987). We performed a regression analysis for both EN and N events for free–frost periods as the dependent variable and altitude (in meters) as an independent variable, taking the form FFP(EN ave) = – 0.0758x + 236.23 (R2 = 0.6746) and FFP(EN ave) = – 0.0904x + 272.62 (R2 = 0.7034). Evaluation of the regression coefficients reveals that spatial variation in frost free periods was controlled by alltitude rather than by ENSO events. The previous equations can only be seen as an approximation, because geographical/climatological factors other than altitude –not included in this study– may affect these calculations. However, for farmers located in high elevations this may be the first signal of the length of frost–free periods in either of the two events EN and N.
4. Discussion and conclusions
In this investigation, we assembled and analyzed daily minimum temperatures for 50 stations located throughout the area. Even though we found that EN had no effect on either the FFP or the FFP at 20% probability level (p < 0.05) we found interesting results in frost behavior in our study area: in regions I and III during EN years early frosts start earlier and late frosts end later than during N years. Thus, the FFP are shorter during EN years than during N years. The 20% probability level of frost occurrence offers longer FFP during EN years than during N years. Also, during EN years in regions with higher altitude (IV–VI) frosts start earlier than during N years; however, late frosts end later during N years. The FFP for N years is much shorter than for EN years. The 20% probability level of frost occurrence offers longer FFP during EN years than during N years. In the highest region under study (region VI) early frosts start almost at the same time for both events; nevertheless, late frosts end later during N years. The FFP is much shorter during N years than during EN years. The 20% probability level of frost occurrence offers longer FFP during EN years than during N years. In region VI, it is very noticeable that the 20% probability level of frost occurrence offers longer FFP for both EN and N years, making farming viable in this region, otherwise farming would be almost impossible. This is very useful for crop production because it allows farmers to understand the risks of occurrence of early and late frosts, thus helping them to better schedule planting days, in order to decrease crops failure. Regression analysis showed that frost occurrence is better correlated with altitude than with EN and N years. Also, altitude is highly correlated to the length of FFP; locations with higher elevations showed shorter FFP and locations with lower elevations showed longer FFP. Thus, higher areas are more prone to earlier frosts in autumn and later frosts in spring.
Annual rainfed crops are highly vulnerable to frost periods contributing to the success or failure of crop production. To date, crop phenology and historical crops yields for the study site have been quite limited due to the lack of research in the first case, and lack of digitized data on crop production, in the second case. Thus, it is necessary to take more general approaches when talking solely about FFP and crop production. Despite this, the results of this study provided us with very useful information on frost behavior during EN and N events in central México. In order to be able to reduce froze hazards for agricultural management, it would be convenient to take into account the results of this study on how frost periods behave over time in central México.
Acknowledgement
We would like to thank the Universidad Autónoma de Aguascalientes for providing financial support with the grant: PIAG/RN03–1 through Centro de Ciencias Agropecuarias.
References
Ahrens C. D., 1993. Essentials of meteorology. An invitation to the atmosphere. Ed. Wadsworth, Belmont, California, USA, 437 pp. [ Links ]
Allan R. J., J. A. Lindesay and D. E. Parker, 1996. ENSO and climate variability in the past 150 years. In: El Niño and the Southern Oscillation, 2000. Ed. Cambridge, 496 pp. [ Links ]
Barrow E. M. and M. Hulme, 1996. Changing probabilities of daily temperature extremes in the UK related to future global warming and changes in climate variability. Clim. Res. 6, 21–31. [ Links ]
Barry R. G. and R. J. Chorley, 1998. Atmosphere, Weather and Climate. 7th Edition. Ed. Routledge. G. Britain, 409 pp. [ Links ]
CNA, 1993. Servicio Meteorológico Nacional. Comisión Nacional del Agua. México, D. F. Personal communication. [ Links ]
CPC, 2003. Climate Prediction Center. ftp://ftp.cpc.ncep.noaa.gov/wd52dg/data/indices/sstoi.indices. Consulted on March, 2003. [ Links ]
García E. 1988. Modificaciones al sistema de clasificación climática de Köppen. México, 252 pp. [ Links ]
Glantz M. H. 1998. Currents of change: El Niño's impact on climate and society. Cambridge University Press, USA, 208 pp. [ Links ]
Gray W. M., 1993. Forecast of Atlantic seasonal hurricane activity for 1993. Fort Collins, CO. Department of Atmospheric Sciences, Colorado State University, USA, 10 pp. [ Links ]
IMTA, 2002. ERIC II. Extractor Rápido de Información Climática. Instituto Mexicano de Tecnología del Agua. [ Links ]
Izaurralde R. C., Rosenberger, R. A. Brown, D. M., Legler, M., Tiscareño L. M. and R. Srinivasan, 1999. Modeled effect of moderate and strong "Los Niños" on crop productivity in north America. Agric. Forest Meteorol. 94, 259–268. [ Links ]
JMA, 2003. Japan Meteorological Agency. http://coaps.fsu.edu/jma.shtml. Consulted on March, 2003. [ Links ]
Laughlin J. P. and J. D. Kalma, 1987. Frost hazzard assessment from local weather and terrain data. Agric. Forest Metorol. 40, 1–16. [ Links ]
Magaña V. O., 1998. Climatología de México. In: Los Impactos de El Niño en México. (V. O. Magaña, Ed.) Centro de Ciencias de la Atmósfera. UNAM, México, 228 pp. [ Links ]
Magaña V., J. L. Pérez, J. L. Vázquez, E. Carrisoza and J. Pérez, 1999. El Niño y el clima. In: Los Impactos de El Niño en México. (V. O. Magaña, Ed.). IAI, CONACyT, SG, UNAM, México, 27–66. [ Links ]
Magaña, V.O. and T. Ambrizzi, 2005. Dynamics of subtropical vertical motions over the Americas during El Niño boreal winters. Atmósfera, 18, 211–234. [ Links ]
SICA, 2003. Medina, G. G., J. A. Ruiz Corral and A. María Ramírez. Sistema de información para caracterizaciones Agroclimáticas. Versión 2.5 INIFAP. Centro de Investigación Regional Norte–Centro. Campo experimental Calera, Zac. 78 pp. [ Links ]
Ortiz S. C. A., 1987. Elementos de agrometeorología cuantitativa con aplicaciones a la República Mexicana. 3a. Ed. Universidad Autónoma de Chapingo. 327 pp. [ Links ]
Pérez G. I., 1990. About the premature and tardy frost that occurred over the central plateau of México and were associated with some tropical cyclones. Atmósfera 3, 143–164. [ Links ]
Philander S. G. H., 1985. El Niño and La Niña. J. Atmos. Science 42, 2652–2662. [ Links ]
Philander S. G. H., 1989. El Niño and La Niña. American Scientist 77, 451–459. [ Links ]
Rahimi M. S., Hajjam, A. Khalili, G. A. Kamalid and C. J. Stigter, 2007. Risk analysis of first and last frost occurrences in the Central Alborz, Iran. Int. J. Climatol. 27, 349–356. [ Links ]
Rasmusson E. M., 1985. El Niño and variations in climate. American Scientist 73, 168-173. [ Links ]
Romo G. J. and R. Arteaga, 1989. Meteorología Agrícola. 2a. Ed. Universidad Autónoma Chapingo. Departamento de Irrigación, Chapingo, México, 442 pp. [ Links ]
Sánchez M. A., 1991. Síntesis Geográfica de México. 1a. Reimpresión. Ed. Trillas. México, 265 pp. [ Links ]
SICA 2.5, 2003. Medina G. G., J. A. Ruiz y A. M. Ramírez. Sistema de información para caracterizaciones agroclimáticas. Instituto Nacional de Investigaciones Forestales, Agrícolas y Pecuarias. Centro de Investigación Regional Norte–Centro. Campo Experimental Calera, Zac. México, 74 pp. [ Links ]
Thom C. S., 1966. Some methods of climatological analysis. WMO. Technical Note 81. Geneva, Switzerland, 53 pp. [ Links ]
Villalpando J. F., 1985. Metodología de investigación en agroclimatología. México. SARH. 155 pp. [ Links ]
Yasunari T., 1985. Zonally propagating modes of the global east–west circulation associated with the southern oscillation. J. Meteorol. Soc. Japan 65, 67–80. [ Links ]

